Talking Points
- The NZD/USD is Trading Lower After ISM Data
- Bearish Reversals Begin Under .6991
- Sentiment is Negative, Reading -1.42
(Created using Marketscope 2.0 Charts)
What’s next for the US Dollar ? Find out more with our analysts Free forecast!
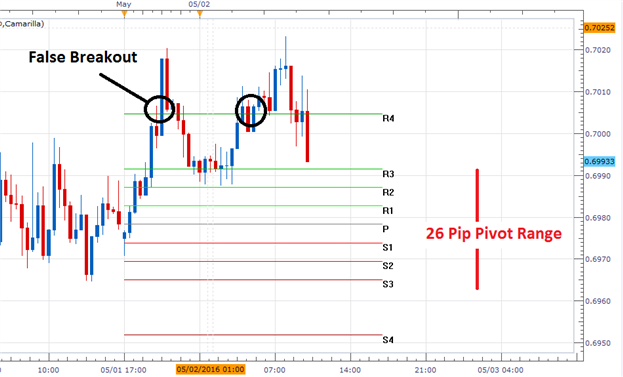
The NZD/USD has attempted to breakout higher on two separate occasions this morning. So far neither attempt has been successful with prices now turning lower after the release of Aprils US ISM manufacturing survey. Expectations for today’s event were set at 51.4, and were released at 50.8. Despite price action trading to a new high earlier in the session, a move towards lower lows may suggest that prices are preparing to retrace some of last week’s gains.
Technically, the NZD/USD is now trading back below today’s R4 Camarilla pivot. With a series of false breakouts this morning, it opens up the pair for a technical reversal below .6991. This point is represented in the graph above by the R3 pivot, and a decline to this point would place the pair back inside of today’s pivot range. A further decline opens the pair up to test values of support, which includes today’s S3 pivot, which is found at a price of .6964.
Traders looking for a breakout should continue to monitor both the S4 and R4 pivot. A move below the S4 pivot found at .6951 should be considered significant, as it would be the first bearish breakout in the last 4 trading sessions. In this scenario, traders may extrapolate 1X today’s 26 pip range to find initial targets at .6925. If prices move back above the R4 pivot, it would be the third attempted bullish breakout of the session. If a bullish breakout does occur, traders may look to target 1X range extension towards price targets of .7030.
Find out real time sentiment data with the ’s sentiment page .
SSI ( speculative sentiment index ) for the NZD/USD currently stands at -1.42. While this total is negative, it still remains beneath extremes. In prices do break higher; traders should look for SSI to move towards a rating of -2.0 or more. Conversely, in the event of a bearish reversal, SSI would be expected to decline back towards more neutral values.
To Receive Walkers’ analysis directly via email, please SIGN UP HERE
See Walker’s most recent articles at his Bio Page .
Contact and Follo w Walker on Twitter @WEnglandFX