Talking Points
- The USD/JPY Trades Lower for the Third Consecutive Session
- Short Term Momentum Points Higher, Suggesting the Pair is Retracing
- Bearish distributions begin at 108.61, Signaling a Resumption of the Trend
The USD / JPY is set to close lower for the third consecutive trading session this week, having fallen as much as 292.5 pips from the weekly high at 111.449. This initial move was predicated on an Inside bar breakout on Wednesday morning. Currently price action is trading just off the weekly low, which stands at 108.524. As such, momentum traders will be looking to see if a new low is in store for the pair, or if a rebound is imminent for the USD/JPY.
USD/JPY 3-Minute GSI Chart
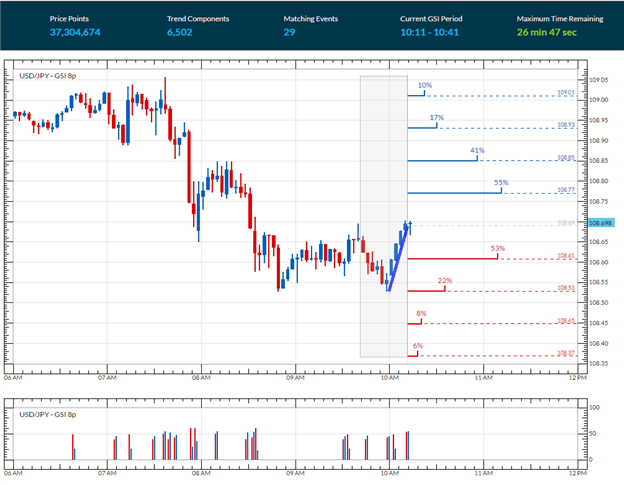
(Created using Grid Sight Index)
Monitor GSI in Real time! Get started HERE.
In the chart above, the USD/JPY decline this morning can be clearly seen with a series of lower lows. However, the GSI indicator has signaled fresh bullish momentum, after the pair challenged and failed to breakout to a new daily low. The Grid Sight Index has reviewed 37,304,674 pricing points, and has indicated that price action has advanced 8 pips in 55% of the 29 matching historical events. If price reaches this bullish distribution point at 107.77 it would suggest a potential retracement for the USD/JPY. In this scenario, it would suggest that this morning’s decline has at least temporarily stalled. At which point traders may elect to look for fresh bullish signals, or wait for a bearish reversal back in the direction of this week’s primary trend.
Traders should watch for a continuation of today’s trend if price declines 8 pips to reach the first bearish distribution point at108.61. In this scenario, traders may look for prices to begin testing the next point at 108.53 followed by the lowest bearish distribution point at 108.37. A movement to this price would be considered significant, as the USD/JPY would then be trading at fresh weekly lows.
What is GSI?
Grid Sight Index is a powerful big data indicator that can help you determine whether short-term trends will continue or reverse. GSI takes a snapshot of current price action and uses that to find similar events by studying millions of historical data points. Then it studies those events to show you how often the trend continued or reversed in the past.
To Receive Walkers’ analysis directly via email, please SIGN UP HERE
See Walker’s most recent articles at his Bio Page .
Contact and Follow Walker on Twitter @WEnglandFX.
Looking for additional trade ideas for US Dollar Pairs? Check out our Trading Guide