Talking Points
- USD/CAD is Looking for Support Near 1.2780
- If the USD / CAD Bounces, Resistance is Found Near 1.2829
- The Speculative Sentiment Index Reads at +1.17
USD/CAD 30 Minute Chart
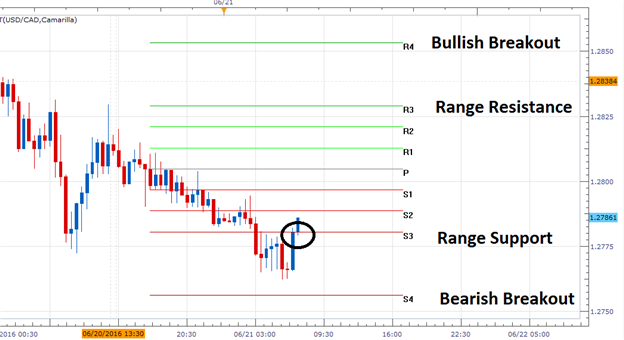
(Created using Marketscope 2.0 Charts)
Losing Money Trading? This Might Be Why.
The USD/CAD is attempting to find support today, after the pair broke lower in late trading yesterday. So far, support has been identified at the S3 pivot point displayed below at a price of 1.2780. With price action hovering near this value, it opens the USD/CAD up to potentially rally in the short term. If prices do bounce, traders may look for resistance near 1.2829. This area is represented graphically at the R3 pivot, and is acting as range resistance for today’s 49 pip trading range.
In the event that prices rise above the R4 pivot, it opens the USD/CAD to attempt a bullish breakout above 1.2853. Traders looking for a bullish reversal may extrapolate 1X today’s range to place initial targets near 1.2902. It should be noted that bearish breakouts may begin under the S4 pivot point at 1.2756. A move to this point would be significant as it would mark the 3rd consecutive attempted bearish breakout in the last three trading sessions. In this scenario, traders may again use a 1X extension of the pivot range to place initial targets near 1.2607.
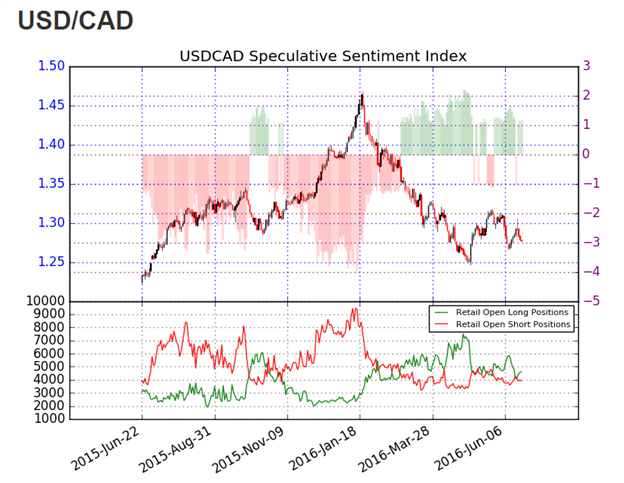
SSI ( Speculative Sentiment Index ) for the USD/CAD is currently reading at +1.17. While this value is not extreme, it is important to note that 54% of positioning is net long. If SSI continues to move towards a positive extreme, sentiment may signal further declines for the pair. Alternatively, if prices reverse and trade higher, traders may look for SSI to neutralize of flip to a negative reading.
To Receive Walkers’ analysis directly via email, please SIGN UP HERE
See Walker’s most recent articles at his Bio Page .
Do you know the biggest mistake traders make? More importantly, do you know how to overcome the biggest mistake? Read page 8 of the Traits of Successful Traders Guide to find out [free registration required].
Contact and Follow Walker on Twitter @WEnglandFX.