The Aussie and Yen are two polar opposite currencies that are currently consolidating against its previous high at 90.11, established on April 11th of this year. The pair has failed to create no higher highs or new lows at this point and is consolidating in a classic wedge pattern. With price staying between support and resistance, this is a great chart to use for a breakout scenario.
Fundamentally, Australia has a much higher yielding currency (4.75%) comparatively to the Japanese (.10%). Traditionally, money follows yield and becomes apparent when viewing our current trend which is still running from its inception in 2009. Today’s meeting of the RBA (Reserve Bank of Australia) resulted in rates staying the same, however statements suggest that further hikes are not out of the question if signs of an inflating economy continue. With the fundamental picture still looking up for the Aussie we can look for our established trend to continue.

Price Action
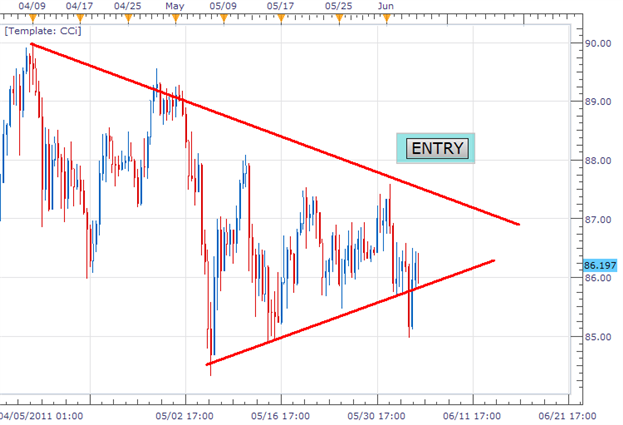
Taking price in to an 8Hr chart we can see price finding support currently near the 86.00 figure. This coincides directly with our opinion of a consolidating triangle being created. Normally these wedge patterns are considered as an interruption within an existing trend. We can use support and resistance levels to spot a break in the direction of the daily trend.
Trading O pportunity
My preference is to buy the AUD/JPY with the existing trend on a break of resistance over 88.00. Stops should be set under support near 86.00. Profit targets will look for new yearly highs near 92.00. This 400 pip target gives us a clear 1:2 risk/ reward level.
Alternative scenarios include using entry to sell the AUD /JPY upon break of support.
Walker England contributes to the Instructor Trading Tips articles. To receive more timely notifications on his reports, email [email protected] to be added to the distribution list.