Many traders are familiar with the Golden Ratio (1.618) which is derived from the Fibonacci sequence. Today we are incorporating a different golden ratio for clues about the market (the gold to silver ratio).
Let's first start off with the trade set up. Then, further down, I'll discuss why this trade set up was chosen and its connection to the gold /silver ratio and shares indices.
The Trading Opportunity
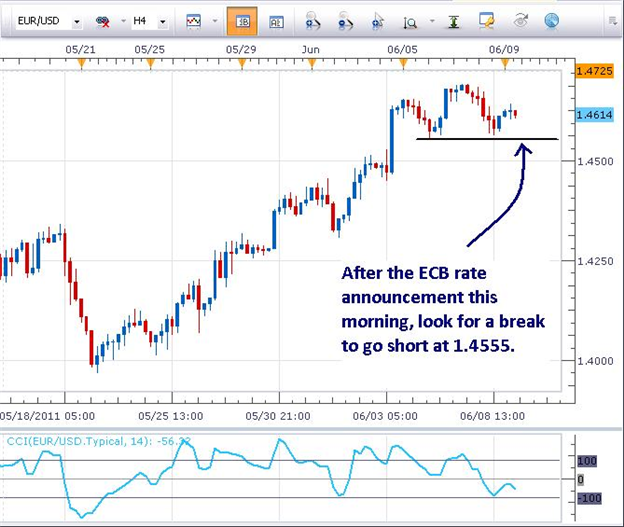
Yesterday, we pinpointed a significant resistance zone in the EURUSD . If prices cannot make it into the zone to sell, a trader can enter into that market with a breakout trade going short. For traders outside of the United States, there are additional opportunities to trade in the shares markets further down in the article.
Wait until after the ECB rate decision this morning, then sell below a break of 1.4555 support.
Place a stop just above the swing high (near 1.4710).
Take profits near 1.4200.
Why the EURUSD
For more insight into the why the EURUSD is chosen today, let’s take a clue from a different golden ratio (the gold to silver ratio) and compare it to the risk appetite of traders. The conclusion is that risk appears to be turning off unless the gold to silver ratio and stock markets resume their previous trends. Therefore, the USD may find relative strength and thus why the EURUSD short was selected.
Gold to Silver Ratio
Many traders are watching the price of gold and silver as they fear the central banks will print money to pay off debts. We can gain some clues about the market by taking a look at the gold to silver ratio (simply divide the price of gold by the price of silver).
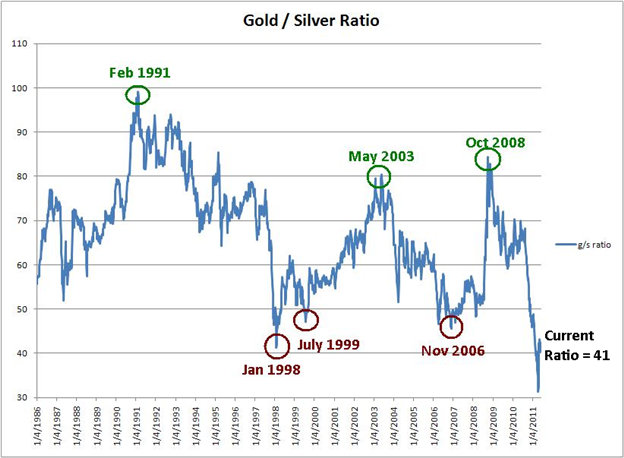
Here is a 25 year chart of the gold : silver ratio. Significant turning points in the ratio have occurred near significant turning points in risk appetite. A turn in risk appetite factors on the currencies you would choose to trade.
As the gold to silver ratio tops out, that typically coincides with a stock market bottom as traders turn into a risk taking mode. Green circles at the top of the chart correspond to a ‘risk on’ environment and carry trade pairs tend to do well.
Here are some relationships near the green circles at the top of the chart :
*Ratio tops out near 100 in February 1991. The stock market began a bull rally 4 months earlier that gained nearly 300% to 1998.
*Ratio tops out near 80 in February 2003 and May 2003. The stock market rallied about 65% from March 2003 to November 2006.
*Ratio tops out near 85 in October 2008 in during the height of the Lehman Bros collapse and AIG take over. The stock market began a bull market rally 5 months later.
As the gold to silver ratio bottoms, that typically coincides with an impending correction in the stock markets as traders become averse to risk. Red circles at the bottom of the chart correspond to a ‘risk off’ environment and safe haven currencies tend to do well ( USD , CHF , and JPY ).
*Ratio bottoms near 41 in January 1998. 6 months later the US30 stock market began a 20% correction as the Asian currency crisis spread. The USDJPY depreciated 24% in 4 months.
*Ratio bottoms near 47 in July 1999. 5 months later the US30 stock market began a 39% correction ( NASDAQ began its 80% correction!).
*Ratio bottoms near 45 in November 2006. 11 months later the US30 stock market began a 55% correction.
Last month, the ratio has bounced from a 30 year low at near 31 to rest currently at 41. Could this be another turn up and subsequent red circle? Time will tell. If the risk appetite continues to be turned off, then we could see a correction in the stock markets and a safe haven flows towards the USD, JPY, and CHF.
Share Indices Near Support

The stock markets have been selling off the past week and significant support levels are nearby. If these support levels break, look for an acceleration of the correction in the shares market. If a trader is bearish the stock market, enter on a break below the support levels.
Jeremy Wagner contributes to the Instructor Trading Tips articles.
http://www..com/how_to_trade_forex/course_trading_tips