The NAS200 ( NASDAQ ) Index has of present failed to break the 2011 high set on May 2nd at 2,429. The Index has been trading in a rage up to this point with the 2,200 level showing clear support. Prior to our current range the NAS200 trended nearly 25% higher during the 2010 trading year. Patient trend traders have been waiting to see if resistance can be broken and higher highs finally formed.
Today’s Non- Farm Payroll numbers will give us insight into job creation outside of the Agricultural sector in the United States. Economic Calendar . Current projections estimate a result near 105K. Any good news regarding employment may be the catalyst needed to finally break the index into new highs within the confines of its overall two year trend.

Price Action
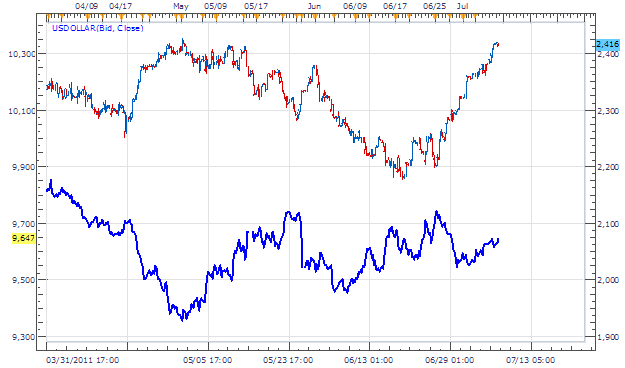
Taking price in to a 4H chart, we can look at the inverse correlation between the NAS100 and the USDOLLAR Index . Knowing the correlation between these two assets will give us insight into future price action. In a breakout scenario for the NAS200 we would look for the USDOLLAR Index to again begin creating lower lows. Likewise if the USDOLLAR Index surges higher, there is likely potential that the 2,425 resistance line will hold for the NAS200.
Trading O pportunity
My preference is to trade the NAS200 using entry orders over resistance placed near 2,450 or better. Limits should be looking for a minimum of 250 points. Stops should be placed near 2,300 or better risking 150 points for a clear 1:2 Risk/Reward ratio.
Alternative scenarios include price returning to support at 2,175.
Walker England contributes to the Instructor Trading Tips articles. To receive more timely notifications on his reports, email [email protected] to be added to the distribution list.