A few weeks back we did a webinar on employing Multiple Time Frame Analysis in your trading. It generated many questions and, as a result, a Post of the Day article was written.
(To access that particular article, click HERE .)
In today’s Post we will elaborate in more detail on another aspect of Multiple Time Frame Analysis: Embedded Trends.
Have you ever entered a trade in the direction of the longer term trend only to find your trade stopped out in a relatively short period of time? (For the record, I am raising my hand!) You probably wondered, especially if you were new to trading, what happened? Trading in the direction of the longer term trends, the Daily for example, is supposed to be a higher probability trade. So…what happened?!?!
You may have been the victim of Embedded Trends…trends, within trends, within trends.
Each long term trend is comprised of many mid-term trends and each mid-term trend is comprised of many
short term trends.
Take a look at my “drawing” below for a visual on this…
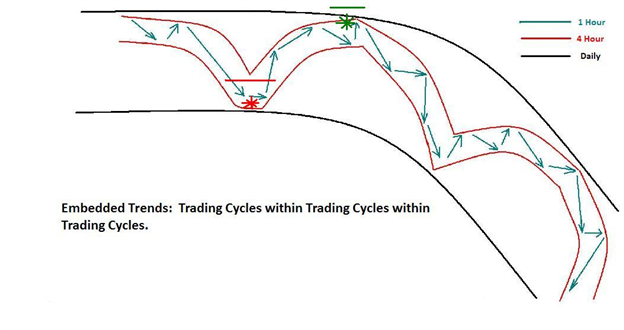
(Believe it or not, people actually REQUESTED I post that!!)
The black lines represent the Daily trend. Within the Daily trend to the downside we see the red lines which represent the 4 hour trend. Within the 4 hour trend we see the green arrows which comprise the 1 hour trend.
So, for an ideal entry, we would like to see all the trends aligned and headed in the same direction at roughly the same time.
For example…
What if a trader had opened a short position, in the direction of the overall trend at the red asterisk on the diagram above and placed their stop above the entry at the red line? Right…they would have been stopped out. The Daily trend may have been going down but the 4 hour and 1 hour trends were just beginning a retracement.
Now, what if a trader had shorted the pair at the green asterisk with a stop at the green line just above their entry? They would not have been stopped out and in fact would be in a profitable trade as price action moved in their favor. They entered the trade at a more opportune time…when the 4 hour and the 1 hour time frames had completed their retracement and were moving back in the direction of the Daily trend.
This is what we mean when we say “fine tuning” the entry.
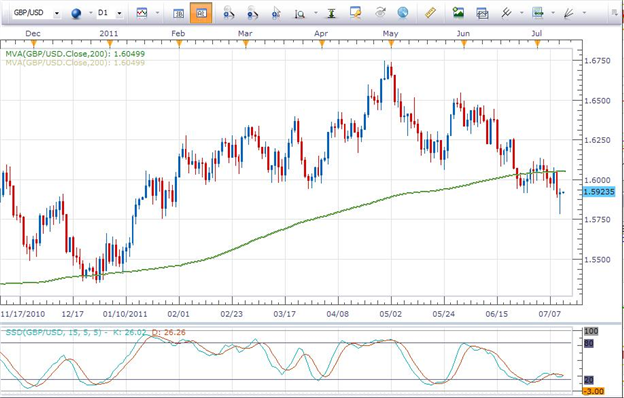
Let’s take a look at a pair that currently demonstrates these embedded trends in action…the GBPUSD .
On the Daily chart below we can see that the pair has a bearish (downside) bias. The pair is trading below the 200 SMA and has been building lower highs and lower lows on the chart since the beginning of May. Slow Stochastics is also in a bearish posture. Also, the GBP is among the weaker currencies and USD is among the stronger ones. Based on this, the higher probability direction to trade this pair is to the downside…we want to short it.
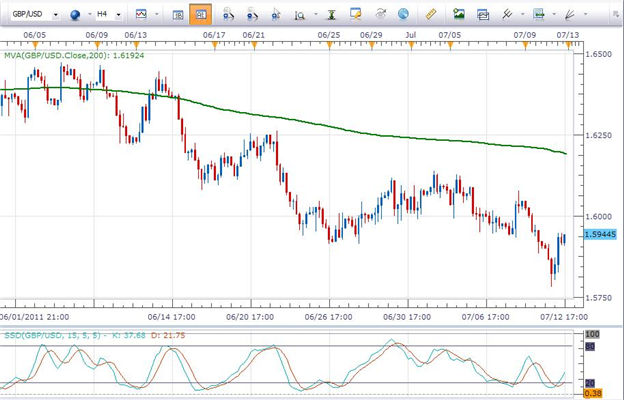
Taking a look at the 4 hour chart below we see that price action is still retracing to the upside. Slow Stochastics also indicates that we may see more upside potential on this pair in this time frame. So based on this chart we will need to exercise patience as the pair is not yet ready to move to the downside in this time frame.
On the 1 hour chart below we can see that price action has potentially stalled as it may have begun to move in a range. To “fine tune” our entry in the direction of the Daily trend we will be waiting for Slow Stochastics to begin to rollover to the downside and move below the 80 line on the indicator. This will signal that bearish momentum in now in favor on this 1 hour chart.
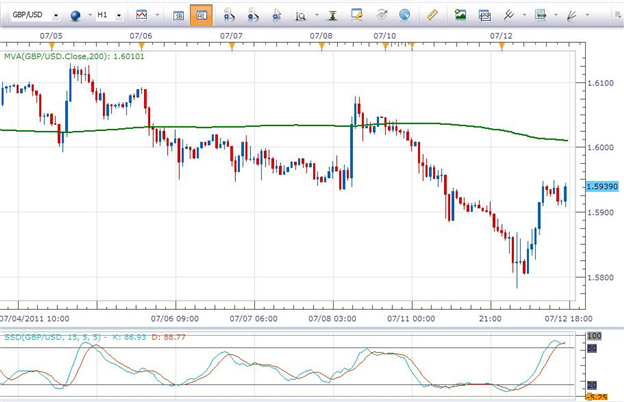
So, if the move to the downside follows through on this chart, the 4 hour chart will begin to stall and rollover to the downside on that time frame as well. This will be our smaller time frames falling into alignment with our Daily chart and giving us a higher probability entry.
Embedded trends in action…