With the August 2 debt ceiling deadline upon us, there is still uncertainty regarding the final resolution. If you think the resolution will be USD bearish, then look to trade the NZDUSD or the USDCHF . If you think the resolution will be USD bullish, then look to trade the EURUSD .
US Congressional leaders are reviewing the latest proposal to increase the US debt ceiling and feel they have enough votes for a deal. Voting will begin later today in the Senate and may carry over into Tuesday for the House of Representatives if there are any sticking points. To help guide us on how to trade the US Dollar through the crisis, we’ll look at relative strength and weakness of the greenback versus the other majors.
The August 2 debt ceiling deadline has been understood by markets and politicians for a few months now. We will look at July’s price movement to help us see what the markets may be indicating regarding relative strength and weakness of the US Dollar.
| July's Dollar Strength (in Pips) | |
|---|---|
| USDCHF | -533 |
| NZDUSD | -501 |
| GBPUSD | -369 |
| USDJPY | -367 |
| AUDUSD | -266 |
| USDCAD | -81 |
| EURUSD | 129 |
July 2011 Pip Movement
Here are the monthly pip movements of the USD relative to the 7 other major currencies. A negative number represents the USD losing ground. A positive number means the USD strengthened in that pair. By determining the net pip movement in July, which was a recent month where the August 2 deadline is known, we see that the CHF and NZD have shown relative strength through the negotiations thus far. On the other hand, the EUR has been relatively weak as it lost ground against the USD.
Putting it all Together
The green highlights mean that the USD has lost the most ground in July 2011 relative to the CHF and NZD. Therefore, if you are anticipating additional US Dollar weakness, then look to trade the USDCHF or the NZDUSD.
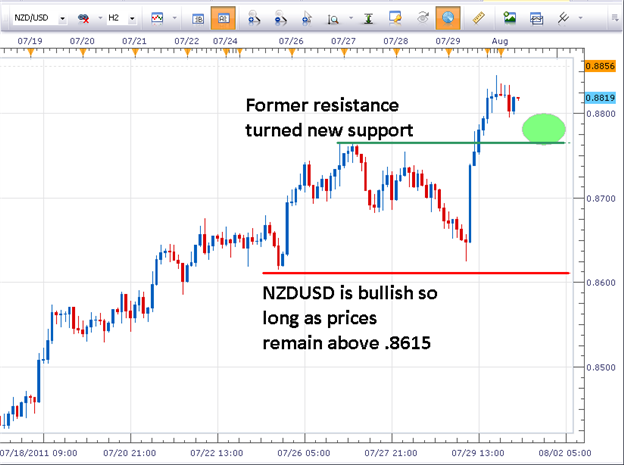
(Created using FXCM’s Marketscope 2.0 charts)
The New Zealand Dollar has gained 501 pips against the Greenback during July 2011. So long as prices remain above .8615, the pair technically has a bullish bias. Look for the green line (.8765) to offer support and consider a buy trade in that zone.
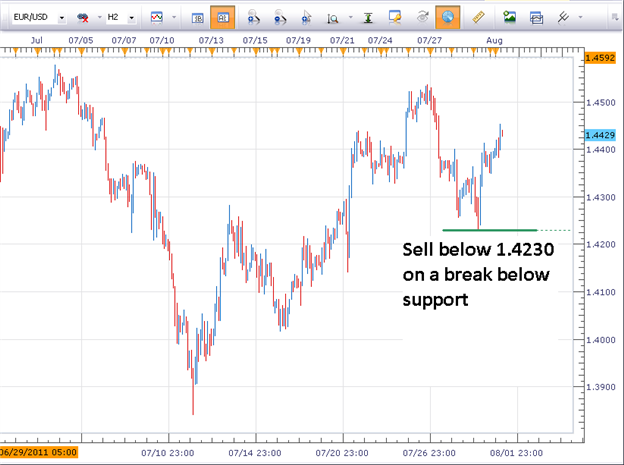
(Created using FXCM’s Marketscope 2.0 charts)
If you feel the USD may gain strength, look to sell the EURUSD pair as the EUR was the only currency the Buck strengthened against in July 2011. A breakout strategy can be used where you would let the market prove to you it is wanting to trade at lower levels. Place an entry order to sell below the 1.4230 zone…if prices push to this level it would be creating a series of lower highs and lower lows.
Additional educational resources
How to Trade with Support and Resistance Part 1
Trading Support and Resistance in Forex Part 2
How to Trade a Breakout Strategy on the EURUSD
Jeremy Wagner contributes to the Instructor Trading Tips articles.
http://www..com/how_to_trade_forex/course_trading_tips
To receive more timely notifications on his reports, email [email protected] to be added to his distribution list.