A simple moving average provides the trader 2 important pieces of trading information.
-The moving average can act as support or resistance depending upon the trend
-The moving average can provide us trend direction
One of the most widely used moving averages is the 200 period Simple Moving Average (SMA) on a Daily Chart. Large institutions and professional traders look to this moving average as strong technical support of a market in an uptrend or technical resistance in a downtrend. The 200 SMA is simply the last 200 days of closing prices averaged together. So if prices fall through the 200 SMA in an uptrend, that can indicate weakness in the market and that the uptrend may be slowing down or possibly reversing.
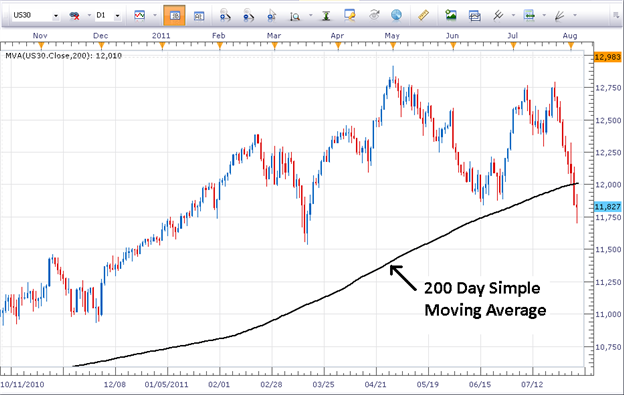
As noted above, yesterday, the US30 (a cfd for the Dow Jones Industrial Average) collapsed through the 200 SMA.

The SPX500 (a cfd on the S&P500) has been flirting and finally crashed through the 200 SMA as well. This indicates weakness in the market and perhaps a shorter term trend to the downside. Look for the 200 SMA to provide resistance into the future.
So we can then plot the average of the previous 200 days on a chart to smooth out the market movement and get a better feel for the mood of the market. The use of Moving Averages can be of great help in determining the direction of the trend or for showing possible support and resistance levels. Here is a daily chart of the EUR/USD with a 200-day Simple Moving Average plotted on it.
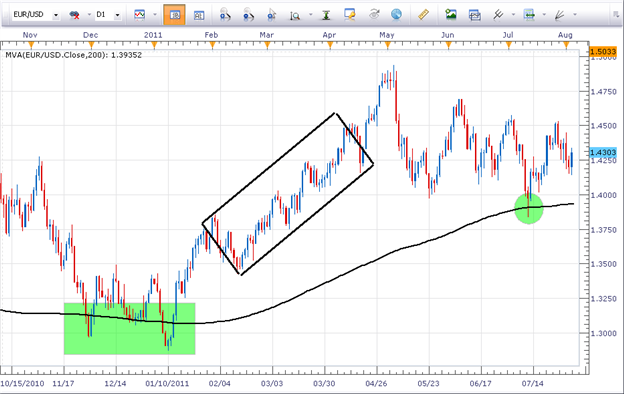
We can see two things with the chart. The first is how the market has a tendency to find support or resistance on a move to the Moving Average. Those two points are noted by the green highlights on the chart. So if we are buying pullbacks in an uptrend or selling rallies in a downtrend, the use of a Simple Moving Average can help us better time our entry. We can also see the price activity that I have highlighted in the rectangle as a good example of how Moving Averages can be of great help in noting strong trending moves.
Three items are working together in boxed off area.
-The price of the EURUSD was above the 200-day Simple Moving Average.
-The Moving Average was also moving up.
When you have all three points working at the same time like the activity in the rectangle, you have a strong trending move. We would want to buy in an uptrend and sell in a downtrend. This simple technical indicator has a lot of value it today’s trading environment, but we just have to be sure we understand its strengths and weaknesses to better judge its effectiveness.
Additional educational resources
How to Trade with Support and Resistance Part 1
Trading Support and Resistance in Forex Part 2
---Written by Jeremy Wagner, Lead Trading Instructor, Education
To contact Jeremy, email [email protected]. Follow me on Twitter at @JWagnerFXTrader.
To be added to Jeremy’s e-mail distribution list, send an email with the subject line “Distribution List” to [email protected].