There are a variety of ways that a trader can determine where to place their stop on a trade. One such method is the Two Day High/Low stop.
Here is how it would work…
Looking at the Daily chart of the GBPNZD below, we can see that the pair is in a downtrend so we would be looking for opportunities to sell the pair.
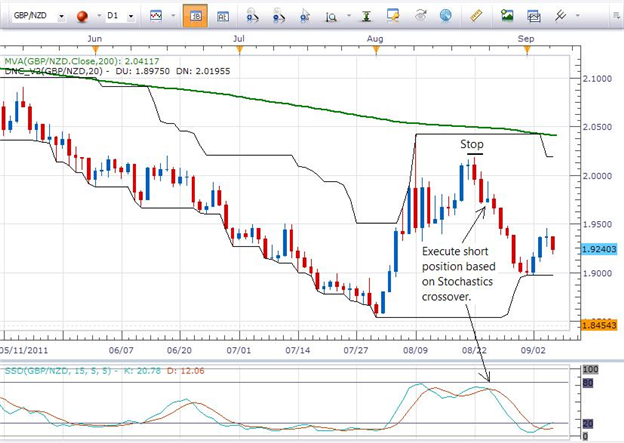
One such opportunity presents itself when Slow Stochastics crosses over to the downside. Taking that entry signal, we would have shorted the pair at the candle indicated by the arrow. Since the pair is in a downtrend, we would be following the “two day high” rule for placing the stop. As such, the stop would go just above the second candle to the left of our entry candle since this candle represents the highest price to which this pair traded in the prior two days.
When the next daily candle opens at 5 PM Eastern time the following day, we would adjust our stop to be just above the next candle to the right of the one where our stop was initially placed. Each day when the daily candle closes, we would follow this same procedure and adjust the stop downward. (In a downtrend we would never adjust the stop upward.)
This process can continue until a profit target (limit) is hit or until price action retraces to the level of the advancing stop.
In an uptrend this process would be reversed and we would trail the stop upward by using the “two day low” rule.
While this strategy can be used in any market condition, it will function best in a trending market.
Richard Krivo contributes to the Instructor Trading Tips articles. To receive more timely notifications on his reports, email [email protected] to be added to the distribution list.