Fractals; an Assistant for locating Swings
By James Stanley
Traders looking to trade with market inflection points, or swing-highs and swing-lows can be doing so for a number of reasons.
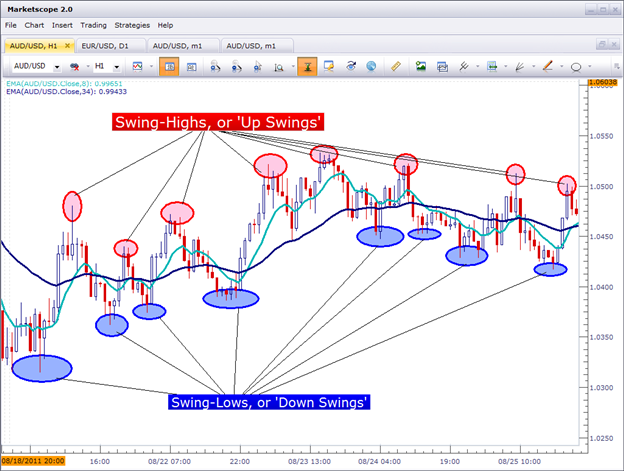
Swings can best be characterized as market ‘inflection points,’ that are exhibited during the multiple changes in price that take place in almost every currency pair.
Rarely does a market make a clean move in one direction. Most down-trends are characterized by deeper ‘down swings,’ and smaller ‘up swings.’
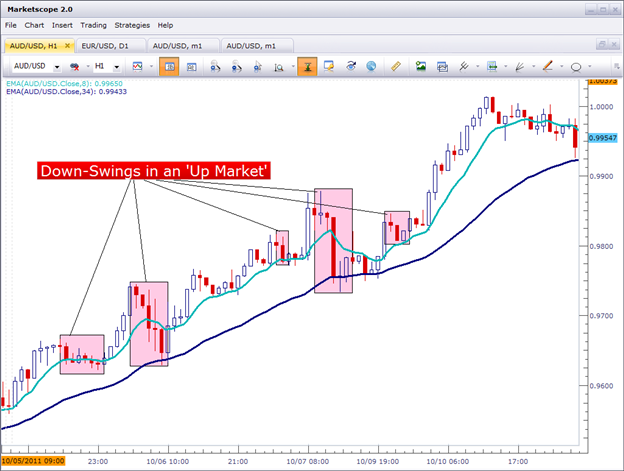
Or up-trending markets can exhibit ‘swing-lows,’ as the market gyrates higher in the direction of the trend, although those swing-lows will often be at progressively higher prices , much like the chart below:
In our previous articles in the price action series (links available at the bottom of this article), we show numerous mechanisms that traders can use to identify trends, initiate trades, and manage positions using only price action on the chart.
Swings can best be characterized as market ‘inflection points,’ that are exhibited during the multiple changes in price that take place in almost every currency pair.
For traders looking to trade with swings, or traders looking to deepen their identification of market swings, the fractal indicator can be of great assistance.
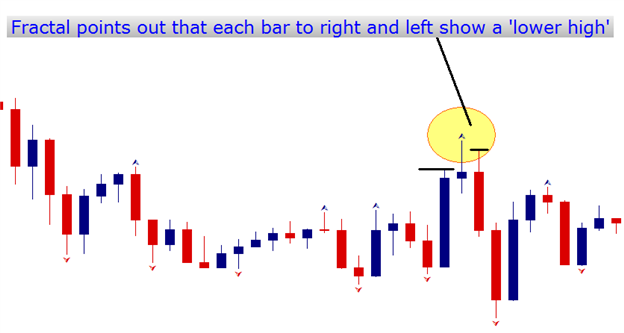
Fractals are going to point out swings on the chart for us.
An ‘Up,’ fractal is going to be shown on candles in which the candle to the left and the candle to the right show us a higher value.
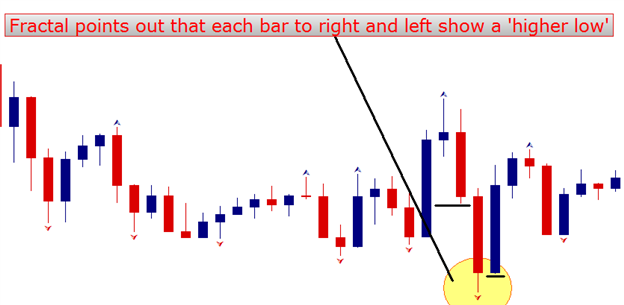
On the other hand, a ‘Down,’ fractal will point out those candles on the chart in which the previous and following candle display a ‘higher low.’
Next: Don't Miss This Tip That a Currency Pair Might be Reversing (37 of 47)
Previous: Price Action Swings
Links to additional resources:
You can follow James on Twitter @JStanleyFX.
To join James Stanley’s distribution list, please click here.