Oftentimes traders mention that they have a hard time visualizing an uptrend within a downtrend…or a downtrend within an uptrend for that matter.
If you have ever found yourself in that situation, read on…
Have you ever heard the expression, “you may have to take 3 steps backwards before you can take 5 steps forward?” In the overall scheme of things, following that plan, you will be making forward progress even though at times you will be moving backwards andaway from your overall objective. This is the same relative premise as downtrends having uptrends in them…and vice versa.
Take a look at the chart below for a visual…
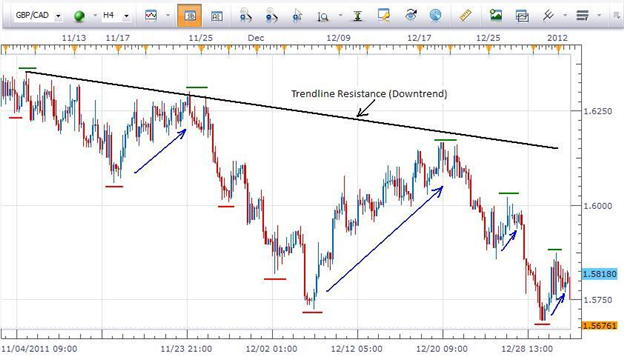
The overriding trend on this 4 hour chart of the GBPCAD is represented by the black trend line . As trend line resistance is sloping down, it shows that price action on this chart is bearish and to the downside.
We can also tell the pair is in a downtrend as it has been making lower highs (green lines) and lower lows (red lines).
Within this downtrend, however, there are several blue arrows that show uptrends… bullish moves against the dominant trend. Even though some of these moves against the trend are quite strong, the overall downtrend prevails.
Since as trend traders we want to trade in the direction of the dominant trend , we would ignore the moves against the trend and only take trades to the downside based on the example chart as these would be the higher probability trades.