Trading Breakouts on US Oil
After rising tensions in the Middle East helped Oil climb 4% to begin the week, crude finds itself in the precarious position sitting atop previous resistance. The chart below illustrates previous inflection points of the US Oil chart with the contentious price of 103.30.
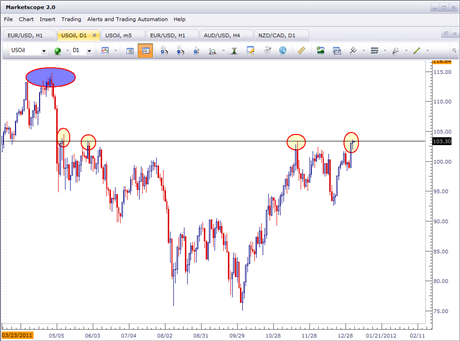
Created with Trading Station/Marketscope
Notice how the price of Oil appeared to bounce off this level with each inflection, including the 1/04 candle from yesterday with a high price of 103.70. This confirms the level as resistance, in which case I can certainly employ my breakout strategy in an effort to capitalize on this opportunity.
As outlined in the article “How to Trade a Breakout Strategy on the EURUSD,” by Jeremy Wagner, traders can look for support and resistance levels in an attempt to play the ‘breaks,’ of these prices ; hoping for a ‘slingshot’ type of effect with price rising meteorically after the stubborn level of resistance is penetrated.
Price may be taking a brief break at 103.30 before trading higher, and if that’s the case, I want to look to play bullish breakouts to the upside over the previous high of 103.70.
To contact James Stanley, please email [email protected]. You can follow James on Twitter @JStanleyFX.
To join James Stanley’s distribution list, please click here.
Additional Resources: