The US equity market is ripe for a pullback based on sentiment and technical readings. Several currency pairs have a correlation to the stock market. Therefore, look for trading opportunities to buy the US Dollar in the coming days versus the Australian Dollar .
According to the weekly American Association of Individual Investors (AAII) poll, the percentage of bears dropped a whopping 13% last week to 17%. That means of those investors who answered the survey, only 17% were bearish about the future 6 month price movement of the US stock market. Like ’s Speculative Sentiment Index, these ratios can be used as contrarian signals. Since most participants have a bullish outlook of the US equity market for the next 6 months, this means the sentiment is ripe for a stock market selloff.
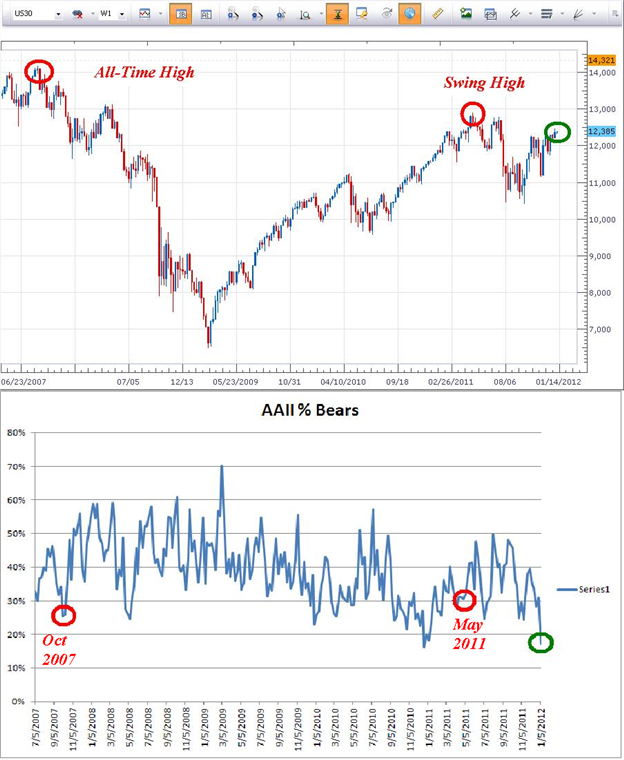
Two interesting points on the above AAII bearish survey reading. First of all, the current reading of 17% bears is lower than the all time market top of October 2007 (26%). Secondly, the current reading of 17% is below the swing high of May 2011 (29%). In essence, investors are more bullish on the stock market outlook now, than during previous highs in the market.
If the momentum behind the current upswing was that strong, then prices should be ABOVE previous highs, not BELOW. The strong bullish sentiment could not propel prices to new highs. This is a bearish signal for the stock market.
From a technical perspective, the Dow Jones Industrials is near a significant resistance point. Last week’s high in the Dow (12,482) could be the high. If not, look for resistance a little higher near 12,500.
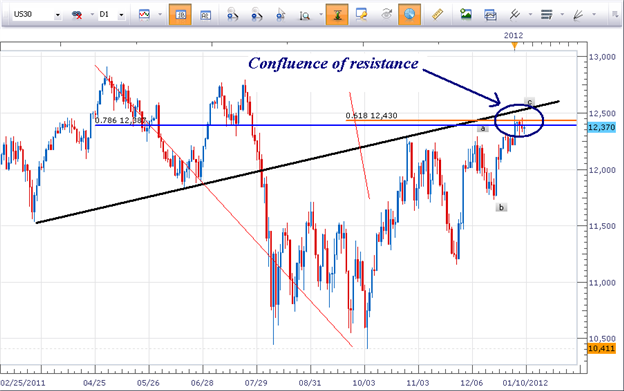
First off, prices are near the 78.6% retracement level of the May-Oct 2011 down trend (blue horizontal line). The 78.6% retracement level is considered the retracement of last resort. Many traders will look for these opportunities because of the good risk to reward ratios it offers.
Secondly, prices are near the bottom side of the black trend line. What was support during the first half of 2011 has acted like resistance since October 2011.
Lastly, we have a 3 wave counter trend move since November 25, 2011. Wave c is 61.8% the length of wave a (orange horizontal line), which is a common relationship.
Therefore, we have 3 points of resistance all in the same area on the price chart. If stocks start to fall, then it is likely the AUDUSD may fall as well. By selling this pair, we are effectively buying the US Dollar while simultaneously selling the Australian Dollar.
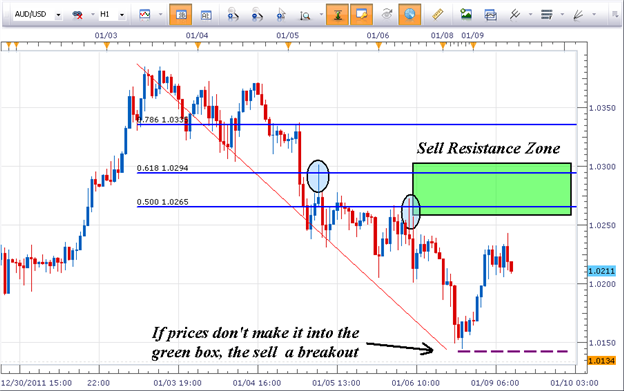
The green box noted above is a resistance zone we can look to initiate a short entry into the AUDUSD pair. This green box is generated by 2 long wicks (blue circles) as well as the 50-61.8% retracement levels. Place a stop just above the swing high near 1.0400.
If prices never make it into the green box, then look to initiate a sell trade on a break below 1.0144. Place a stop loss just above the swing high near 1.0250.
---Written by Jeremy Wagner, Lead Trading Instructor, Education
To contact Jeremy, email [email protected] . Follow me on Twitter at @JWagnerFXTrader.
To be added to Jeremy’s e-mail distribution list, send an email with the subject line “Distribution List” to [email protected].