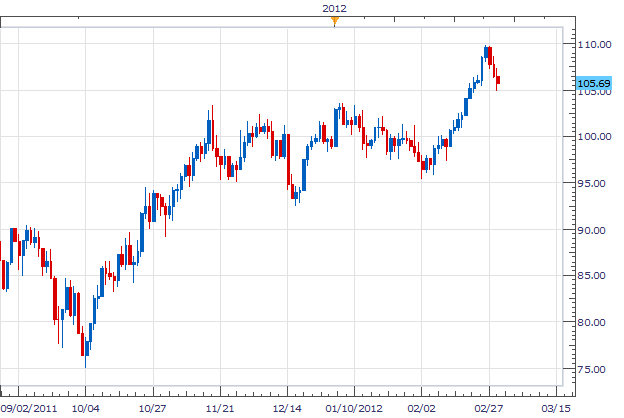
USOil (WTI) has been one of the strongest market trends for the month of February. Since its low on February 2nd at 95.41 the commodity has surged over 15%. The current monthly high was created on February 24th and resides at 109.9. Price has declined this trading week with prices now trading near 105.69. As price retraces, hidden divergence again can be a great tool to assist traders to find new momentum to the upside.

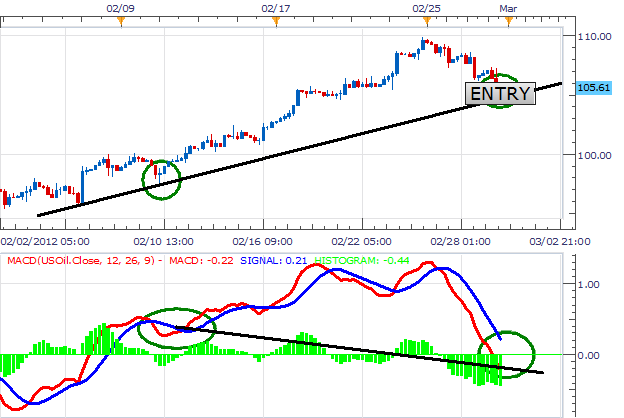
As we discussed in our previous chart of the day, RSI Hidden Divergence Forms on EUR/CAD under 1.3500 , hidden divergence can be used to find swings during trending markets. In that example we focused on using the RSI Indicator . Today we will be using the MACD indicator to spot hidden divergence on a 4Hr chart. In an uptrend, we will need to connect our previous lows on USOil and compare them to the lows created on MACD. The Key is to find an area where price is making a higher high while the indicator is forming a lower low.
Once hidden divergence is spotted, we can use MACD to trigger our entry. Traders will look for the MACD line to cross above the signal line back with the direction of the trend. This event occurring, over our zero line, can add to a trader’s bullish opinion of the market.

My preference is to buy USOil on a MACD crossover above our zero line. Entry’s should be near 105.50 or better. Stops should be placed under support near 104.50. Primary profit targets should look for prices reaching 106.50 a barrel for a 1:2 Risk / Reward ratio .
Alternative scenarios include price breaking support to form lower lows.
---Written by Walker England, Trading Instructor
To contact Walker, email [email protected] . Follow me on Twitter at @WEnglandFX.
To be added to Walker’s e-mail distribution list, send an email with the subject line “Distribution List” to [email protected].
provides forex news on the economic reports and political events that influence the currency market. Learn currency trading with a free practice account and charts from FXCM.
