Trading consolidation patterns does not have to be a difficult proposition. The EURGBP daily chart below is a prime example. The first key is to trading this chart is to identify support and resistance . Moving down the chart, we can see support most recently created by connecting a series of wicks beginning at the February 2nd low at .8263. Resistance can be found by using the wick from our February 24th high at .8505. Once we have found these two charting lines, we can extrapolate them to form a triangle pattern .
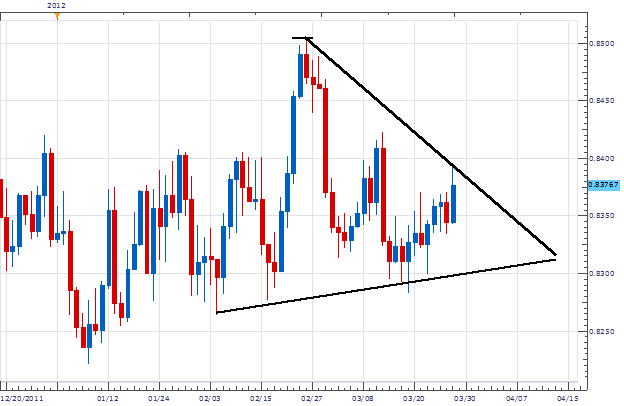
Once a consolidating pattern such as a triangle is found, our trading decisions become much easier. We can either wait for price to breakout of its existing holding pattern, or trade between support and resistance. Breakouts should plan for the collapse of one of our drawn charting lines as price seeks to make a higher high or lower low. Trading the interior of a triangle can be as easy as applying your favorite oscillator. The below chart is a 4Hr EURGBP graph, with a CCI indictor . As price turns from resistance, we can sell the pair looking to take profit near our support line.
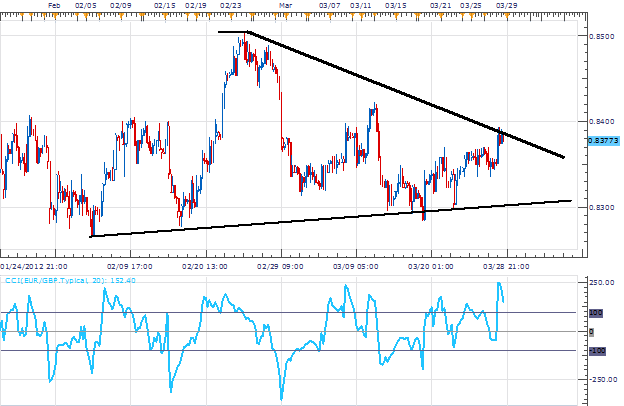
My preference is to sell the EURGBP on a turn of the CCI indicator near .8380. Stops should be placed over resistance at .8420. Limits should look for pricing targets near support at .8300 for a clear 1:2 Risk/Reward profile.
Alternative scenarios include price breaking out of our triangle, triggering fresh entry orders.
---Written by Walker England, Trading Instructor
To contact Walker, email [email protected] . Follow me on Twitter at @WEnglandFX.
To be added to Walker’s e-mail distribution list, send an email with the subject line “Distribution List” to [email protected] .
provides forex news on the economic reports and political events that influence the currency market. Learn currency trading with a free practice account and charts from FXCM.