Talking Points:
- Gold has rebounded from the monthly 38.2% Fibonacci level
- Gold has broken above regression down channel
- Monthly CCI signals a buy
As the Euro became the official currency of twelve European Union’s members, Brazil won the 2002 World Cup, and gasoline in the U.S. was $1.61/gallon. In 2002, you could have also bought an ounce of gold for $300/oz., for a few months at least, before the breakout that marked the beginning of a 12-year, $1600 rise.
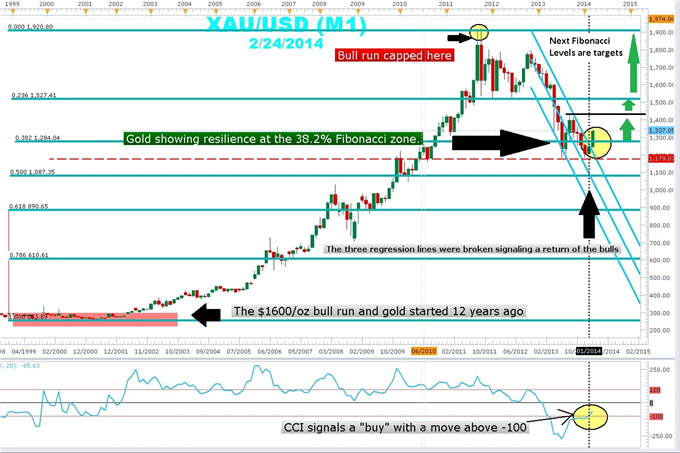
The slow but steady ascent to new highs culminated with the 2011 high at 1920.80. With a high in place and a low, Fibonacci traders can use monthly retracement lines to establish areas of support and resistance. These levels will be help for traders in letting them known when the profit-taking decline is over and the uptrend resumes. In addition, CCI can be used to confirm a “rush” back into gold.
Learn Forex: Gold Monthly Chart Rebound

Created Using Marketscope 2.0
As can been seen in the chart above, gold looks to have concluded an orderly three-wave decline forming a double bottom just below the 38.2% Fibonacci retracement of the swing from the 2001 lows near $254.00/oz. to the 2011 highs near $1920/oz. The failed attempt to push below these levels has emboldened the gold bulls.
However, to reduce the odds of falling for a fake out, we can employ the CCI indicator to confirm this move higher. CCI is an unbanded oscillator that is helpful in identifying when prices have been trading above their average. CCI generates a buy signal when the line moves above the -100 horizontal reference line and generates a sell signal when it moves below the +100 horizontal reference line.
In the monthly gold chart above, monthly CCI has just crossed above the -100 horizontal reference line signaling a buy. We have not seen a fresh CCI buy signal in gold since 1999.
In addition to CCI and Fibonacci, the three lines of a regression channel can be drawn on the downswing as another visual aid for confirming a true bounce rather than a fake out. The regression lines form a channel, that when broken, would give a strong confirmation that prices will continue to move in the direction of the breakout. Notice the wide-ranging green candlestick outside the regression channel. With just four days before this candles is closed, it is very important for gold to hold these levels to keep the bull trend alive.
Look for the previous August 2013 highs near 1431 to be the first target before an extended rally to the 23.6% Fibonacci level at 1527.41 However, a close below the 2013 lows in the 1186-1200 region could open the door for a drop to the 50% Fibonacci retracement at $1087.35.
---Written by Gregory McLeod Trading Instructor
This article showed you how to use Fibonacci to trade the Gold bounce. I want to invite you to enroll in our free Fibonacci Retracement Course to further your understanding of Fibonacci. Sign our Guestbook to gain access to this course that will help you get up to speed on basics. Register HERE to start your Forex learning now!
