Talking Points:
- Candle patters can pinpoint reversals in the trend
- The evening star requires 3 candles for confirmation
- Once spotted, traders can look for breakout opportunities
Traders looking for confirmation in their entries often turn to candlestick analysis. Patterns of candles can assist technical traders in both continuations and potential reversals in price. Today we will review the bearish evening star pattern, and how it can be used in trading. Let’s get started!
What is a bearish evening star?
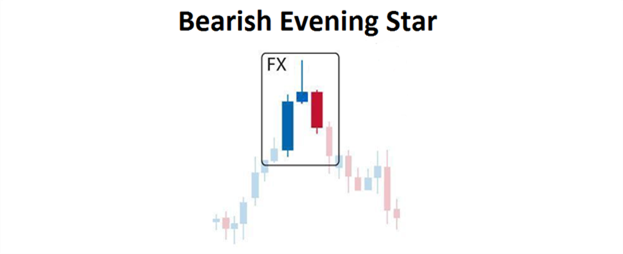
The bearish evening star is a three candle, candle pattern used to determine turns or reversals in an established uptrend. Pictured above you can see the composition of an evening star as it should appear on your graph. The first two candles are used to represent the conclusion of an existing uptrend. The second candle in the pattern is often identified with a long wick, or has the appearance of a doji candle . This is the trader’s first clue that a bearish evening star is developing.
The 3rd candle of the evening star is arguable the most important. A bearish candle is needed in this position to signal a change in the trend. Preferably traders want to see a strong selloff at this point on the graph. The further this candle declines in price, the greater bearish momentum becomes. Often we will find a bearish engulfing candle here, signaling a breakout in the trend. Now that you are more familiar with the evening star pattern, let’s look at an example.
(Created using FXCM’s Marketscope 2.0 charts)
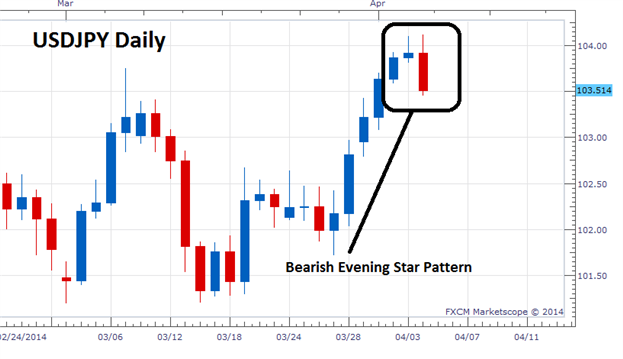
USDJPY Trading
Bullish hammer candles can be found on a variety of charts and time frames. Depicted above is an example of an evening star developing on the USDJPY daily chart. Over the past three days this pattern has been developing with the continuation of bullish momentum on April 2nd. This momentum is concluded with a doji on April 3rd, and today’s price action is breaking towards lower lows to complete the pattern.
Normally traders choosing to look for evening stars like to trade breakouts in the direction of the new downtrend. One way to do this is to plan entry orders underneath the low of the first candle in the pattern. This ensures that a lower low has been established prior to market entry. Another popular method to trade this pattern is in conjuncture with oscillator divergence. When paired with an indicator like MACD, both signals can help spot reversals and better plan market entries.
To practice trading candle patterns, register for a Free Forex Demo account with FXCM. This way you can become comfortable with your new strategy while working on your technical analysis skills in real time!
---Written by Walker England, Trading Instructor
To contact Walker, email [email protected] . Follow me on Twitter at @WEnglandFX.
To be added to Walker’s e-mail distribution list, CLICK HERE and enter in your email information
New to the FX market ? Save hours in figuring out what FOREX trading is all about.Take this free 20 minute “New to FX” course presented by Education . In the course, you will learn about the basics of a FOREX transaction, what leverage is, and how to determine an appropriate amount of leverage for your trading.
Register HERE to start your FOREX learning now!
provides forex news on the economic reports and political events that influence the currency market. Learn currency trading with a free practice account and charts from FXCM.
http://www..com/forex-education