Talking Points:
-The Current Technical Juncture for AUDUSD
-200-DMA Could Support Price Further
-Price Patterns Favoring a 2014 High Is Coming
“[Michael Marcus] taught me one other thing that is absolutely critical: You have to be willing to make mistakes regularly; there is nothing wrong with it. Michael taught me about making your best judgment, being wrong, making your next best judgment, being wrong, making your third best judgment, and then doubling your money.”
-Bruce Kovner
AUDUSD plays a very important role in the FX Market. First, AUDUSD is often a key proxy for the risk-on sentiment that is prevalent among G10 currencies. If AUD is bid, risk appears to be favored as AUD is a high-yielding currency and is often bought as institutional and retail investors look to be pair more in an environment that favors risk and downplays risk-avoidance. If AUD is offered / sold, risk appears to be out of favor of many traders as they look to favor a safe currency like the USD, JPY , or CHF in preference over higher-yielding AUD , NZD or EMFX crosses. In other words, markets are emotional and AUD is at the axis of the emotions.
These patterns are looking for price action confirmation. If you’re not comfortable with price-action analysis, register for our free online price action course here .
The Current Technical Juncture for AUDUSD
From April 2013 to January 2014, AUD was having a hard time finding any long-term buyers. There was a strong bear-market rally from August to October, but that was overcome and AUDUSD pushed new lows not seen since 2010. Now, a similar rally to the Fall ’13 rally is at play and we’re approaching a critical point on the chart that will bring light to whether the technical edge favors the bulls or bears.
Learn Forex: Will History Repeat
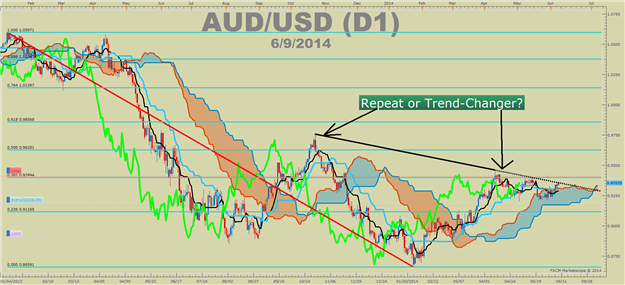
Presented by FXCM’s Marketscope Charts
From his chart alone, you’ll notice a few key things are at play. First, the move from the late January low of 0.8659 looks similar to the last bear-market rally that ended up in a 900 pip downtrend. Second, a trendline connecting the October ’13 top to the tops in mid-2014 are acting as resistance to the upside. However, a few factors favor the upside that could be more important and if broken with a close higher, could signal a move into 2014 highs soon.
200-DMA Could Support Price Increases Further
If the Forex market have any equivalent to a compass, it could very well be the 200 day moving average . In no uncertain terms, price above the 200-dma favors a further increase in price, which is common for an uptrend. Price below the 200-dma favors a further decline in price, which is common for downtrends.
Learn Forex: 200-dma on AUDUSD
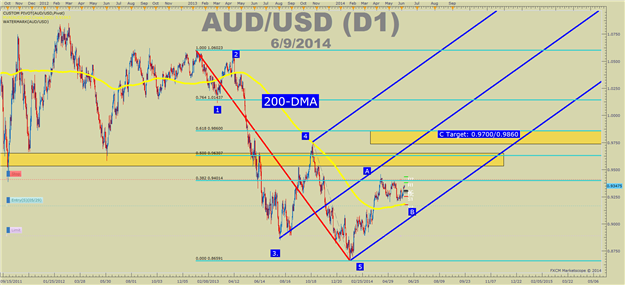
Presented by FXCM’s Marketscope Charts
The yellow line above denotes the 200-dma. As you can see, price is currently above the 200-dma, which favors further upside in a trending market. If you look above (click on the chart for a better view), the 200-dma acted as resistance in October 2014 and effectively capped the move before resuming the downtrend that started in January 2014. This prior reaction to the 200-dma helps us to see the 200-dma as significant and if price continues to stay above the 200-dma, then further prices should be favored.
Price Patterns Favoring a 2014 High Is Coming
There are two patterns unfolding that are pointing to the potential for significantly higher prices should AUDUSD close above 0.9410. The two patterns are Elliott Wave Patterns and a bullish flag. Both of these patterns could see AUDUSD targeting between 0.9695-1.000.
Learn Forex: AUDUSD Patterns Favoring Higher Potential
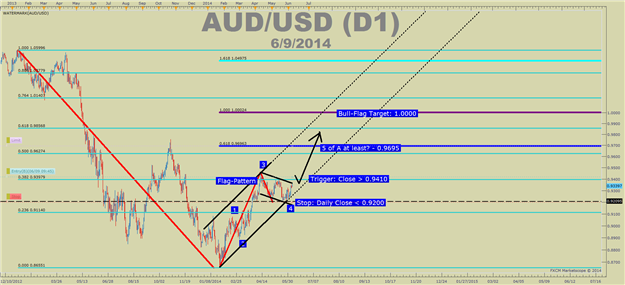
Presented by FXCM’s Marketscope Charts
Let’s breakdown the two patterns so that you can see their trigger, stops, and targets. The trigger to enter is 0.9410 & the stop at 0.9200 is the same for both patterns. The only difference between the two are the potential targets and you can decide which you prefer based on how aggressive you want to be.
The first pattern is the Elliott Wave Pattern that look for a 5th wave to finish a common 5-wave pattern. A common Elliott Wave target is to look for wave 5 to equal 0.618% of the total distance traveled between waves 1-3. Projected from the end of W.4 near the 200-dma around 0.9200 would take us near 0.9695.
The second bullish pattern, known as a bull flag, which would be triggered on a break and close > 0.9410. The flag is a pattern made from a small correction after an impressive push higher that presumes another push higher. The bull flag target is based on the prior impulse distance projected from the flag low, which sits around 0.9200 bringing a target near parity of 1.0009
Now that you're armed with a method of finding technical targets on AUDUSD, feel free to try this information out on a FREE Forex Demo Account with access to multiple markets.
Happy Trading!
---Written by Tyler Yell, Trading Instructor
To contact Tyler, email [email protected]
To be added to Tyler’s e-mail distribution list, please click here
Tyler is available on Twitter @ForexYell
Add me to your Google+ Forex Circle