Talking Points
- SSI is a trading tool comparing long and short positioning
- Scalpers will use SSI extremes to identify strong Forex trends.
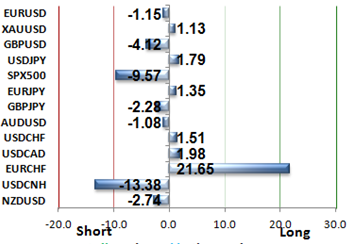
- At -4.12 traders will look for the GBPUSD uptrend to continue
SSI (Speculative Sentiment Index) is a proprietary trading tool to FXCM, which is used to determine trade positioning. The idea behind sentiment is to see if more traders are long than short, then making an educated trading decision based on current market trends . Currently the GBPUSD is reading at an extreme -4.12 SSI level. Today we will examine exactly what this may mean, and how this data can be useful for traders going forward. Let’s get started!
Learn Forex – Current SSI Readings
SSI and the Pound
As of this morning we can see in the chart above that the SSI reading for the GBPUSD has reached an extreme reading of -4.12. Since SSI is reading negative, this means that short positions out number long positions. The actual number represents there being nearly 4 positions short for every position taken long.
The main reason that the SSI reading has reached these extreme negative levels is primarily due to the currency pair’s strong uptrend. Below you can see price action for the past month using a daily chart. During this period the GBPUSD has rallied as much as 370 pips! As traders attempt to fade this strong trend, SSI has become more negative while the pair continues to push towards higher highs.
Learn Forex – GBPUSD Daily Trend
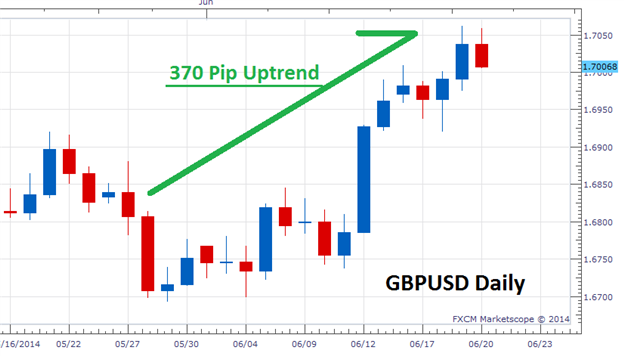
(Created using FXCM’s Marketscope 2.0 charts)
Trading the GBPUSD
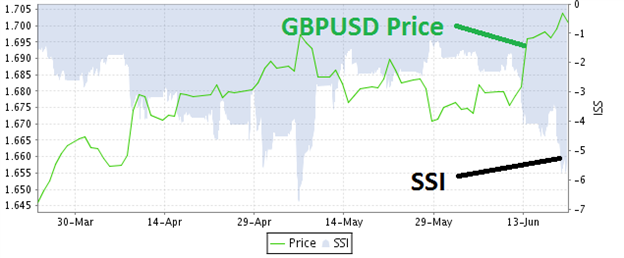
Below we have combined both price and SSI to see how the two data points relate over time. Putting both aspects together we can see that SSI increases in value, during periods of strong trends. Knowing this, traders should consider SSI as a contrarian tool. As short positioning increases, this can be taken as a strong signal for a trend continuation. Knowing this, traders can then proceed to look for new buying opportunities using the strategy and time frames of their preference.
As with any indicator or trading tool, SSI should be monitored as the market progresses. This can be done through PLUS where SSI is updated twice daily. If position continues to be largely net short, then this can be taken as a confirmation to the continuation of the current downtrend. Conversely, if SSI begins to advance and net short interest declines this could be taken as a signal that the current uptrend in the GBPUSD is at least temporarily coming to a pause.
Now that you are familiar with SSI, you can begin working this trading tool into an active strategy. You can get started analyzing price along with SSI with a Free Forex Demo with FXCM. This way you can develop your trading skills while tracking the market in real time!
---Written by Walker England, Trading Instructor
To contact Walker, email [email protected] . Follow me on Twitter at @WEnglandFX.
To be added to Walker’s e-mail distribution list, CLICK HERE and enter in your email information.