Article Summary: FXCM Trading Volume on the AUDUSD showed a lack of endorsement on the recent push higher. A lack of endorsement on a countertrend move turns focus on the larger trend, which has been validated by other technical developments. Additionally, w ith SSI showing retail traders building a long position , sentiment traders are favoring downside .
Talking Points:
- AUDUSD trading volume w as muted on recent counter-trend price spike
- Volatile Corrective Pattern looks to have finished at the 38.2% Fib Level
- AUDUSD SSI shows 67% of traders are long favoring further downside
Countertrend price patterns are varied but their message is similar. The inability for the market to build momentum favors the prior trend. A key way to recognize whether momentum is being build is whether or not volume is carrying through in the new directional bias.
The recent spike in AUDUSD happened on muted volume, which favors prior trend. Combining the lack of volume on the terminal move in an addition to the following factors of sentiment and chart patterns. This article will guide you through what to look for on the chart while adding sentiment and volume analysis to see if the trend is ready to resume or rather a reversal is underway.
The Multi-Year Downtrend in AUDUSD with a few Interruptions
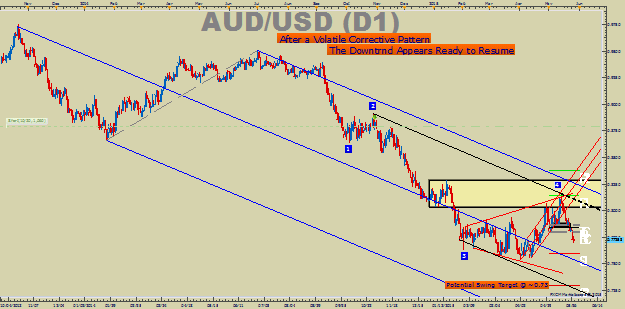
(Created using Marketscope 2.0 charts )
Complementing sentiment and volume is the technical analysis approach.
Technical analysis looks for potentially repeatable patterns that can provide an edge, so long as risk is managed. The chart above shows AUDUSD traced out a clean broadening pattern (diverging red trend lines), which communicates trend interruption more than trend reversal and often favors a new low is likely in a larger downtrend.
This article will look at what these circumstances mean for the pair moving forward.
Retail Sentiment is acquired using Plus’ Speculative Sentiment Index. It is free for real FXCM account holders, but is also free for anyone using a two week trial: Plus Trial . Most often, SSI will help you see the beginning of a new trend, which is historically fought by the retail trading crowd.
Retail Volume is available on FXCM’s Trading Station Desktop platform. This free software can be downloaded here and a free demo login can be acquired here . Real Volume is a default indicator that can be added to your charts. Volume is used by Institutional FX traders as well as traders from other markets to understand market participation in a move.
AUDUSD trading volume was muted on recent counter-trend price spike
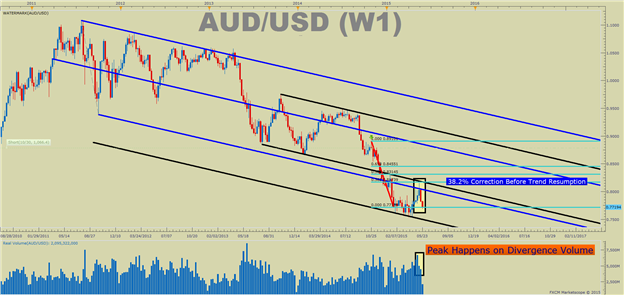
(Created using Marketscope 2.0 charts )
Utilizing FXCM’s real volume indicator has been very helpful for AUDUSD traders. The help came in showing that volume was dwindling on most counter-trend moves through the years as the counter-trend move matured. This occurrence happened once again on the recent volatile correction that appears to have ended on May 14, 2015.
Traditionally, traders can look to volume to see what direction price is moving when volume is at its highest. On the other hand, low volume on moves against the trend rightfully should make traders doubtful regarding the counter trend move. Additionally, traders and can look to support levels or pivot points acting as support to break in order to validate the down trend is resuming.
On the bigger picture, moves against the larger uptrend tend to be discredited. Discrediting counter trend moves aligns with the favorable trend following approach. On the chart above, you can see how volume came up short on the same week a counter trend multi-month high was made.
In last week’s article, we discussed looking at volume as a proxy for enthusiasm or social proof of a move. The lack of volume into Fibonacci resistance on AUDUSD shows that very few traders were willing to push this pair higher and that the next move would join the seemingly inevitable path lower as favored by the RBA.
Going forward, traders can add sentiment while looking for a major breakdown in price that is matched with volume hitting relative record levels. A development where price breaks support, currently at 0.7681 and volume moves higher would complement the idea that the larger trend is resuming.
AUDUSD SSI shows 67% of traders are long favoring further downside
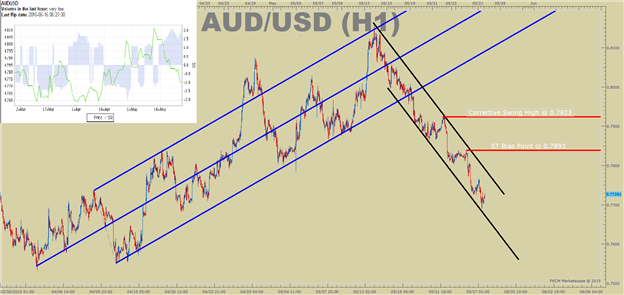
(Created using Marketscope 2.0 charts )
A trader can look to the two recent corrective highs to build a bias against. A move near these levels should be expected because nothing moves in a straight line. However, based on the pattern of the move lower since mid-May, these levels holding would encourage the view of new lows.
To help a trader validate that belief of new lows, volume can be utilized. Specifically, a trader can look for volume to push above recent highs if the 2015 lows are broken on the chart. This would validate the view that investors are endorsing the move. Naturally, if price breaks higher on increased volume then a trader would likely be better off exiting the trade until clarity develops.
AUDUSD SSI Shows A Nearly Twice As Many Traders Are Long As Are Short.
The Speculative Sentiment Index, or SSI, is a contrarian tool where we look to take trades that are opposite of its reading. So during times when SSI is positive, we would look for sell trades and when SSI is negative, we would look for buy trades. Typically, a reading above 1.5 or below -1.5 are seen as statistically significant and increases the need to be on the watch out for breakouts occurring against retail crowd positioning.
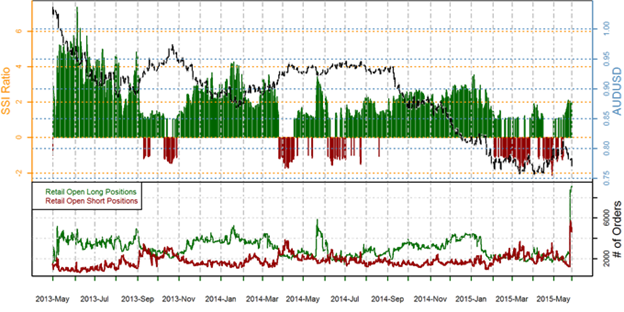
(Screen capture from Plus.com )
We use our SSI as a contrarian indicator to price action, and the fact that traders are aggressively adding to their longexposure adds to the potential signal that the AUDUSD may resume the trend lower. You can see in the chart above, the strong downtrend has resumed on positive SSI. This combination has correlated to lower moves, whereas a negative SSI has been present in trend corrections . As a testament to the Speculative Sentiment Index, you can notice that the pattern of positive SSI holds up with trend resumption lower. We will have to see if the positive sentiment holds and if it does a move lower appears promising.
In Conclusion
Every pair has its own sets of tendencies and patterns. AUDUSD did not attract the volume on the prior countertrend extreme showing traders there were was not a lot of enthusiasm for the counter trend move. The subsequent resumption has been sharp and it’s best to expect a weak retracement that could give you a better risk: reward. However, an aggressive reduction in long exposure turns our focus towards price resistance and a potential volume breakout to confirm the larger trend is ready to resume. Thanks to technical analysis, we have a firm shelf of support around 0.7682 to build a bearish bias upon breaking and resistance around 0.7930 & further at the recent high of 0.81623 to invalidate an imminent lower move.
The sentiment and volume readings are providing signals showing the turn lower could have room to run. However, risk must always be managed in case this does not develop as it has historically. Continue to watch price action, sentiment, and volume to see if the view of a turn higher is validated. Also, feel free to utilize a demo account to practice trading risk-free before trading with real money if you are just starting out.
Happy Trading!
Prior Articles:
USDCAD Symmetry Backed by FX Sentiment & Volume Analysis
Using FX Sentiment & Volume Analysis to Spot USDJPY Trend Resumption
EURJPY New Trend - FX Sentiment & Volume Analysis
---Written by Tyler Yell, Trading Instructor
To contact Tyler, email [email protected]
To be added to Tyler's e-mail distribution list, please click here
Tyler is available on Twitter @ ForexYell
Video Lessons || Free Forex Training
Trading Using Fibonacci (13:08)
Trading With Moving Averages (14:25)
Reading the RSI, Relative Strength Index (13:57)
Money Management Principles (31:44)
Trade Like a Professional Workshop (1:44:14)