Talking Points
-3 different higher probability Elliott Wave counts
-Sentiment and volume suggests bulls still in control
- 1.1090 is at risk of breaking leading to a larger move higher
Next Wednesday December 16 is a highly anticipated date for market participants. The Fed is scheduled to announce their latest assessment of monetary policy and the expectation is for a 25 basis point rate hike. Leading into this meeting, we wanted to take a step back and assess the technical patterns for the EUR/USD before the meeting so we can be mentally prepared during what could be an emotional day for market participants.
There are 3 higher probability Elliott Wave counts we are watching going into the announcement. Each scenario is mapped out with some key levels to watch.
Scenario #1 – Impulsive Move Lower Pivots from Current Levels
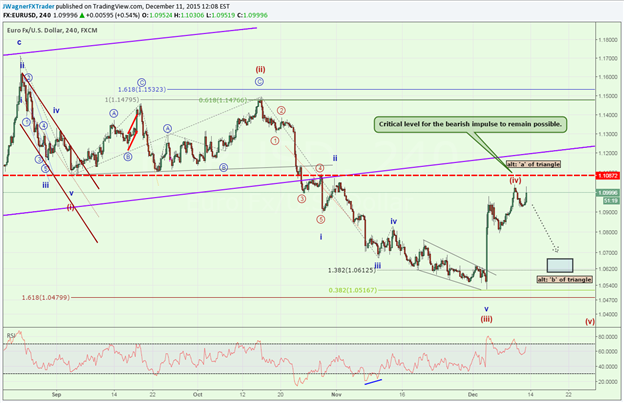
EUR / USD is currently near 1.10. This pattern suggests we are in wave (iv) of a 5 wave impulsive move lower. Using the guideline of alternation, since wave (ii) was a complex correction, then wave (iv) likely will be a sharp zig zag or triangle. The powerful move we saw last week certainly fits the mold as a sharp zig zag.
Additionally, that sharp zig zag might be just wave ‘a’ of the triangle. The key level to watch on this pattern is the September 3, 2015 low. If we break above 1.1090, then the zig zag is eliminated as this proposed wave (iv) would overlap with the wave (i) low. It is debatable if the triangle is still alive as the triangle technically isn’t finished and it would likely terminate below 1.1090. Bottom line, this scenario is essentially eliminated at 1.1090.
This pattern has the potential to press below 1.06.
Scenario #2 – Diagonal Pattern Lower That Drifts Higher First
A break above 1.1090 solidifies the August 24, 2015 high to December 3, 2015 low as a 3 wave move. That is a critical pattern because it narrows the focus of outcomes. One such outcome is that this 3 wave move lower is the first of a 5 wave diagonal that grinds lower. Diagonals carve out a sequence of 5 sets of 3 wave moves. Under this scenario, prices break 1.1090, then likely stall in the 1.12-1.15 zone to finish the second of 5 waves. If prices work up towards 1.12-1.15, this pattern gets tricky to catch in the wave 2 or wave 3 position. Therefore, it will be difficult to catch in real time. This pattern is eliminated above the August 24 high.
Scenario #3 – ‘C’ Leg Higher to Retest 1.17
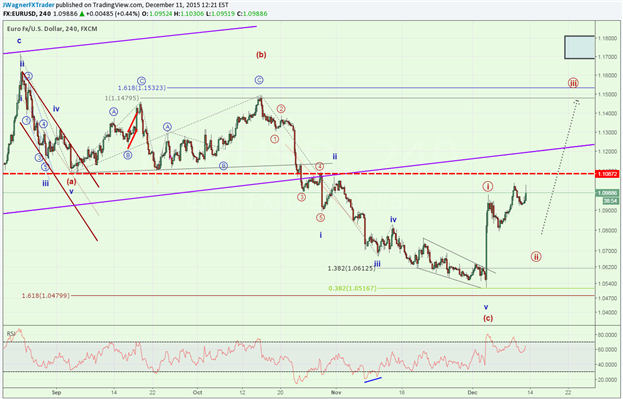
This pattern becomes the preferred count on a break above 1.1090. In essence, we would be in a large flat like pattern that began March 13, 2015. This pattern suggests a booming rally that retests the August 24 high of 1.1719. Under this interpretation, the December 3, 2015 low of 1.0517 is the key level. A break below 1.0517 and a lack of impulsive moves higher at smaller degree of trends would negate this possibility.
This opportunity becomes a good risk to reward ratio trade on an immediate drop to the 1.06-1.07 handle. That way, a stop loss can be set near the 1.0517 low while targeting levels above 1.12.
Which scenario is preferred?
These scenarios are provided in anticipation of a volatile and emotional market surrounding the Fed’s announcement on December 16. With that said, let’s look to some other tools for clues on which patterns to focus on.
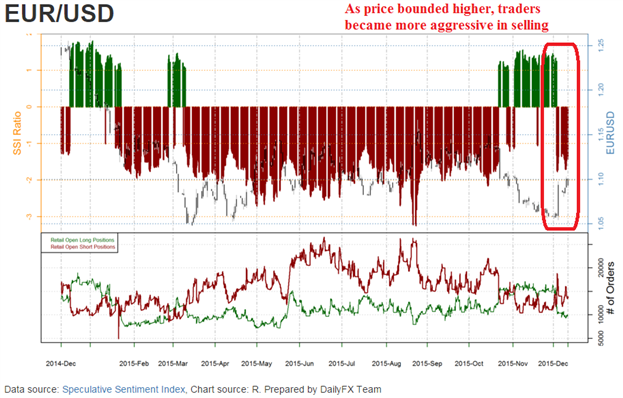
Sentiment (SSI)
We noted in last week’s publication that SSI was turning more negative in the days leading to the ECB announcement. That was tipping us off that for the potential of a bull run. Since then, SSI has continued to drop to negative levels and has stabilized around -1.2 to -1.6.
If the SSI reading continues to drop lower (become more negative), then that could tip the hand that we may break 1.1090 sooner than later. Additionally, if we see price fall yet SSI remains stable in the range above that could also indicate the larger trend may be shifting towards higher levels.
So SSI is an important indicator if the trend shift is taking place. Use our live SSI feed to track the readings in real time.
Suggested Reading: Buy or Sell -> EUR/USD Stares Down a Big Week
On Balance Volume (OBV)
We noted last week how OBV has not been falling with price creating a non-confirmation which was bullish. Since the price jumped higher, we can see through volume how the larger volume days are occurring on up days. This provides a sense of some bullish under tones. Perhaps it is related to a short squeeze since SSI shows how traders are net sellers.
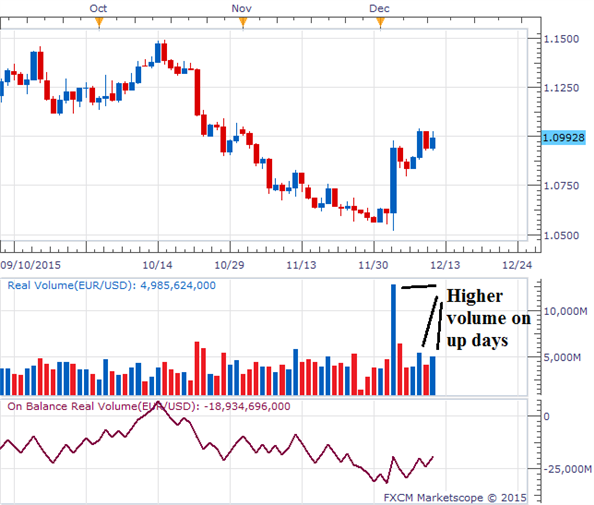
Created using Marketscope charts
Suggested Reading: Finding On Balance Volume Trading Signals
Conclusion
Based on the patterns, SSI, and OBV, it appears the higher probability move is break above 1.1090 in the coming days. Use real time SSI to provide early warning clues which direction price is likely shifting.
If prices drop down towards 1.06-1.07 in the meantime, it allows traders to improve their risk to reward ratio. That simple technique, when implemented, saw 53% of traders turn a profit; of those who didn’t only 17% turned a profit. Read more about implementing that simple technique on pages 7-9 of this 26 page guide on the Traits of Successful Traders . [Free registration required]
Suggested Reading:
Fed Rate Hike Cycle Doesn’t Necessarily Bode Well for US Dollar
Happy trading!
---Written by Jeremy Wagner, Head Trading Instructor, EDU
Follow me on Twitter at @JWagnerFXTrader .
See Jeremy’s recent articles at his Bio Page .
To receive additional articles from Jeremy via email, join Jeremy’s distribution list.