Talking Points
- USD/JPY Prices Breakout on BOJ News
- As Prices Retrace, Traders May Watch for a Resumption of Bearish Momentum
- Breakouts may be confirmed or rejected by tracking momentum with the Grid Sight Index
The USD / JPY has broken out lower this morning after the Bank of Japan left its monetary policy unchanged during Thursday’s meeting. As seen in the graph below, prices for the USD/JPY immediately dropped to new monthly lows, which now stand at 133.54. Prices for the pair are currently retracing off these lows, suggesting that temporary support may be found for the day. This bounce has left traders gauging short-term momentum to determine if this afternoons move is a just a retracement or a broader USD/JPY reversal.
Looking for additional trade ideas for the Yen? Check out our Trading Guide
USD/JPY Daily Breakout
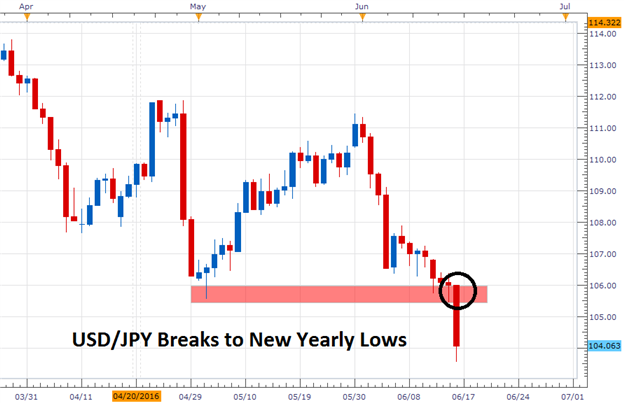
(Created using Grid Sight Index)
Monitor GSI in Real time! Get started HERE.
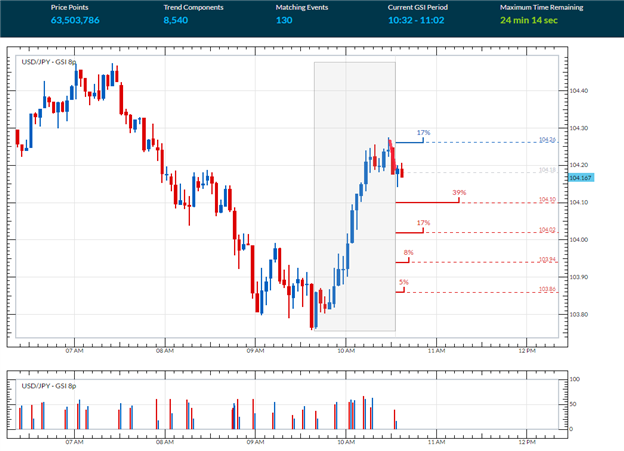
Displayed below, we can see the USD/JPY currently retracing from its most recent swing low at 103.75. Despite the pairs advance, GSI is picking up the development of a new short-term downtrend as the pair has printed a series of lower lows on the 3-minute graph. This shift in momentum has also been highlighted with a series of historical events pointing lower. After reviewing 63,503,786 pricing points, GSI has indicated that prices have declined by a minimum of 18 pips in 39% of the 130 historical matching events. If prices reach the first bearish distribution point at 104.10, it may suggest a turn in momentum back in the direction of the daily trend.
Traders looking for a reversal should continue to monitor the first bullish distribution point at 104.26. It should be noted that prices advanced a minimum of eight pips in 17% of the 130 matching historical events. A movement through this value would be significant, as it would open the USD/JPY up for a broader retracement. In this scenario, traders may look for bullish price momentum to continue, and potentially test the previous swing high near 104.27.
What is GSI?
Grid Sight Index is a powerful big data indicator that can help you determine whether short-term trends will continue or reverse. GSI takes a snapshot of current price action and uses that to find similar events by studying millions of historical data points. Then it studies those events to show you how often the trend continued or reversed in the past.
To Receive Walkers’ analysis directly via email, please SIGN UP HERE
See Walker’s most recent articles at his Bio Page .
Contact and Follow Walker on Twitter @WEnglandFX.
Looking for additional trade ideas for US Dollar Pairs? Check out our Trading Guide