Talking Points
- Crude Oil Prices are Channeling Higher
- WTI May Find Short Term Resistance Under $48.62
- Channel Support is Found Near $47.80
WTI Crude Oil (CFD: US OIL) prices are currently channeling higher, after bouncing from monthly lows at $41.84. Much of today’s advance in Crude Oil has been predicated on a tightening in oil supply, as well as a general rebound in international markets. As prices rise, traders should be mindful that Crude Oil has still not recovered completely from Friday’s decline. For this reason, it will remain important to monitor short-term momentum and key values of support and resistance.
If you are looking for more trading ideas for Oil and Commodities, check out our Trading Guides
US Oil, 30 Minute Chart & Price Channel
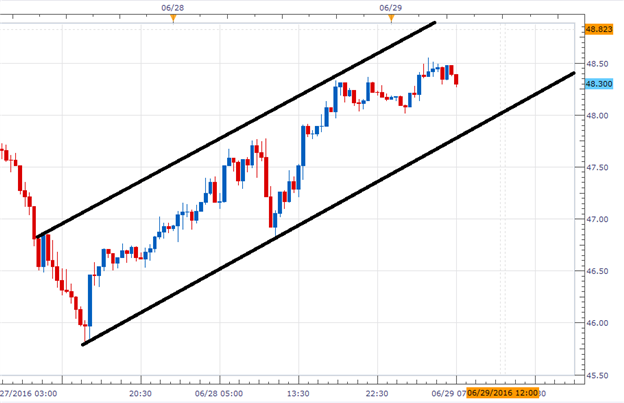
(Created using Marketscope 2.0)
Displayed in the 5-minute chart below, Crude Oil prices can be seen trading off the highs of the day. The GSI indicator has highlighted this short-term momentum as a series of lower lows have recently been created. After reviewing 3,870,878 pricing points, GSI has indicated that price action has declined a minimum of 14 cents in 57% of the 686 matching historical events. Traders looking for a retracement to channel support should monitor the first bearish distribution found at 48.16. A move through this value, may suggest a move lower for Crude Oil Prices. At which point traders may begin to monitor channel support to determine if markets will bounce or decline further.
Traders watching for a continuation in today’s bullish price action should look for prices to move to the first bullish distribution found at $48.62. Prices only advanced 32 cents in 14% of the previously noted historical events, making a move to this point significant. A move through this value would be considered a fresh daily breakout, and allow Crude Oil prices to test other values of resistance. This includes the channel line drawn above near $49.00.
USOil 3 Minute GSI Chart
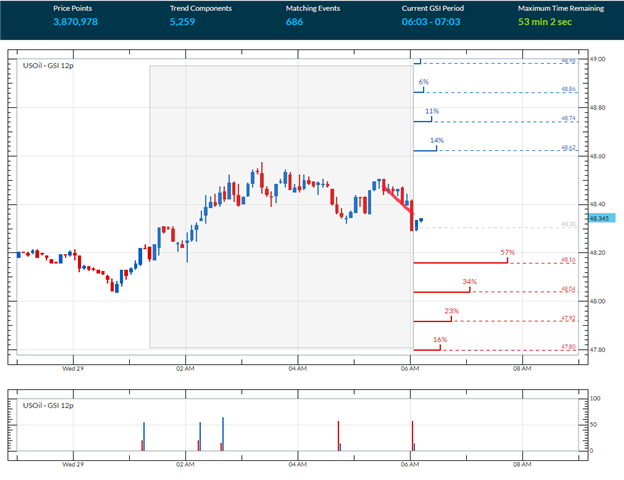
(Created using Grid Sight Index)
Monitor GSI in Real time! Get started HERE.
What is GSI?
Grid Sight Index is a powerful big data indicator that can help you determine whether short-term trends will continue or reverse. GSI takes a snapshot of current price action and uses that to find similar events by studying millions of historical data points. Then it studies those events to show you how often the trend continued or reversed in the past.
To Receive Walkers’ analysis directly via email, please SIGN UP HERE
See Walker’s most recent articles at his Bio Page .
Contact and Follow Walker on Twitter @WEnglandFX.