Talking Points
- Stronger than expected US Retail Sales and CPI strengthened USD
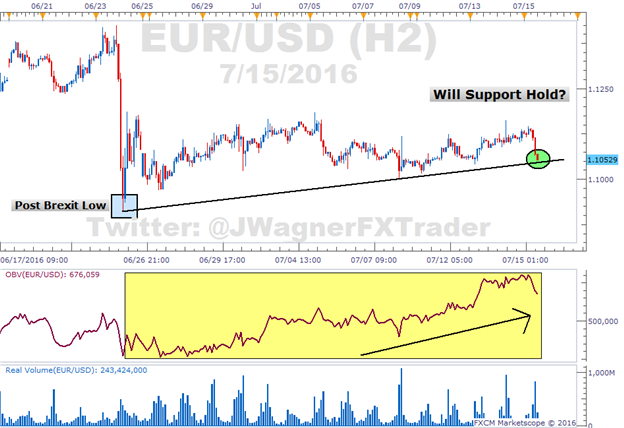
- EUR/USD presses into 1.1050 area which is a trend line from the post Brexit low
- Volume suggest bullish undertones; use the Grid Sight Indicator to pin point shifts in intraday momentum to provide clues if support will hold
US Retail Sales and CPI were released this morning and came in better than expected . This pushed EUR /USD down to new lows on the day. This push lower has the pair testing the lower bounds of its post Brexit lows and subsequent three week consolidation near 1.1050.
Will the range bound price action continue or will we finally see a break?
We don’t know for sure in advance, but there are some tools we can pull out of the garage to help us assess the situation. Today, we are going to use On Balance Volume and Grid Sight Index.
Volume
On Balance Volume (OBV) is sticking out like a sore thumb on EUR/USD (see yellow highlighted area on chart below). Ever since the low of 1.0910 was formed shortly after the Brexit results were published on June 23, OBV has been shifting higher. In fact, the current OBV reading is higher than the price high on July 5.
What this is saying is that volume on up bars is a lot stronger than volume on down bars. More participation is on moves to the upside than when prices move down. This is a bullish undertone and hints at support holding.

Chart prepared by Jeremy Wagner
Grid Sight Index (GSI)
The second tool we can use is GSI. As prices press into the support zone, pull up GSI on ‘m3 or ‘m5’ to see if it is providing bullish or bearish clues.
For those not familiar, GSI is a big data indicator that will analyze millions of price point and thousands of trend components in real time to see how many patterns are similar to the current price action. The resulting figures indicates how many of those historical patterns have moved higher and lower.
Keep in mind that GSI is not a forecasting tool. It is simply looking at past patterns to indicate how many times prices went higher and how many times prices went lower.
When you look at the sub-chart to GSI, if you see a high frequency of blue bars with a large differencial between the blue and red bars, then that suggests many previous patterns resolved higher.
This is a shorter term outlook on trading EUR/USD. Interested in a quarterly outlook for EUR of USD? Download the quarterly guides here .
Been losing at Euro trading? This may be why.
---Written by Jeremy Wagner, Education
Follow me on twitter at @JWagnerFXTrader .
See Jeremy’s recent articles at his Bio Page .
To receive additional articles from Jeremy via email, join Jeremy’s distribution list.
