Talking Points
- Gold Prices Trade Higher For the Fourth Session
- Bullish Gold Breakouts are Signaled Over $1,330.47
- If you are looking for trading ideas for Gold and other commodities, check out our Trading Guides .
The price of Gold is opening the week higher, with prices now advancing for the fourth consecutive session. Currently Gold is trading over short-term resistance at $1,330.47, which is represented in the graph below at the R4 pivot. Traders looking for potential bullish intraday targets may extrapolate a 1X extension of today’s pivot range. This places initial bullish breakout targets near $1,334.21.
Traders watching for a bearish reversal in today’s trading should continue to monitor the R4 pivot. If Gold prices drop below this value, it opens the commodity to trader towards values of support. For today, that includes the S3 pivot at $1,324.87 and the S4 pivot at $1,323.07. A move to either of these values should be considered significant as Gold would be trading lower on the day, and potentially concluding its current bullish momentum.
Losing Money Trading? This could be why !
Gold Prices 30 Minute
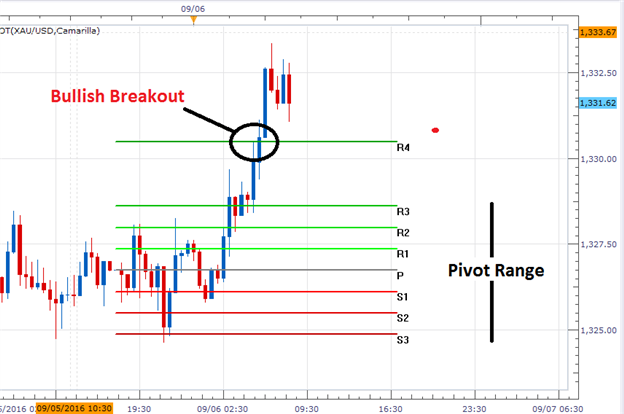
Chart prepared by Walker England
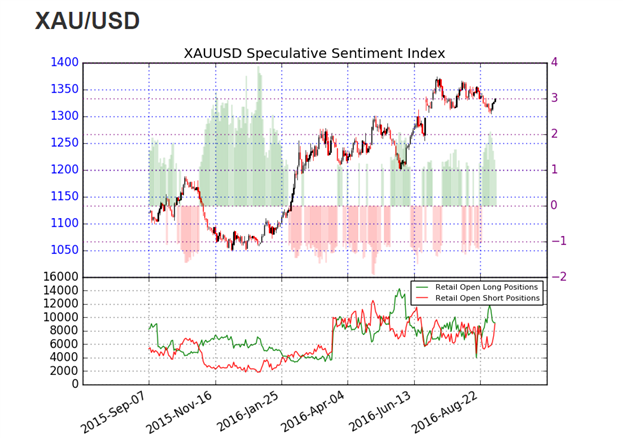
The ratio of long to short positions for Gold (Ticker: XAU/ USD ) stands at -1.02. This SSI (speculative sentiment index) reading shows that 51% of positioning is currently short Gold. Typically, when SSI reads flat this suggests that the market may be consolidating. In the event of continued bullish momentum, traders should look for SSI to move towards new negative extremes. Alternatively, if prices decline, SSI may flip to a positive reading.
Are traders long or short the market Find out here !
To Receive Walkers’ analysis directly via email, please SIGN UP HERE
See Walker’s most recent articles at his Bio Page .
Contact and Follow Walker on Twitter @WEnglandFX.