Talking Points:
- USD/JPY Remains in a Range as Other Yen Pairs Breakout Higher
- Short Term Resistance Is Found at 111.19
- Looking for additional trade ideas for Yen Pairs? Read our Price Forecast
USD /JPY 30 Minute Chart with Pivots
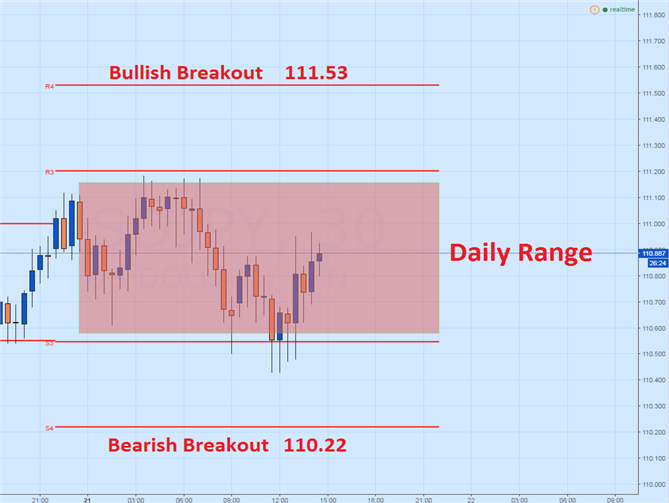
(Created Using TradingView Charts)
The USD/JPY has failed to breakout to higher highs this morning, as many other Yen crosses have done so already. At this point, the USD/JPY can be considered range bound as long as price remains trading between today’s R3 and S3 pivot. Currently, prices are bouncing from the S3 pivot which is displayed below at a price of 110.54. This bounce may reopen the USD/JPY to trade back towards range resistance found at the R3 pivot at 111.19. So far, the pair has traversed today’s 65 pip range once, and may continue to do so for the remainder of the session.
In the event that prices do breakout, traders may begin looking for continued bullish momentum above the R4 pivot at 111.53. A move beyond this point should be seen as significant as it would place the USD/JPY back in the direction of last week’s trend. Conversely a move through support and below the S4 pivot at 110.22, would signal a larger price reversal on the creation of a new lower low. A bearish move of this nature should catch trader’s attention, as the USD/JPY has not had a successful bearish breakout attempt since November 9th.
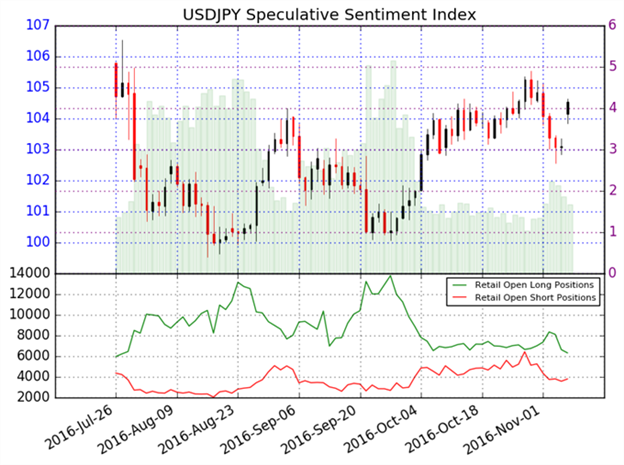
Traders tracking sentiment should note that SSI ( Speculative Sentiment Index ) for the USD/JPY stands at -1.54. This value shows that 61% of positioning is currently short the USD/JPY. Typically this ratio is taken as a contrarian signal which suggests that the USD/JPY may continue to trade higher. In a bullish scenario, it would be expected for SSI to continue to reach out towards negative extremes of -2.0 or greater. However, in the event of a price reversal, traders should look for SSI to decrease towards more neutral values.
To Receive Walkers’ analysis directly via email, please SIGN UP HERE
See Walker’s most recent articles at his Bio Page .
Contact and Follow Walker on Twitter @WEnglandFX.