Talking Points:
- Crude Oil Prices Slide Ahead of FOMC Minutes
- Intraday Support Found at $53.49
- Looking for additional trade ideas for Crude Oil & Commodities? Read Our Market Forecast
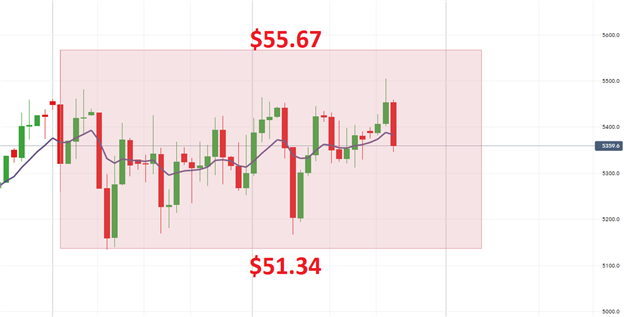
Crude Oil prices are turning lower off of weekly highs ahead of this afternoons FOMC meeting minutes release. Technically, crude oil prices may be considered in a short term downtrend, as the commodity has declined below its 10 day EMA (exponential moving average) at $53.83. If prices continue to decline, crude oil prices may be arguably seen as range bound on the daily chart. It should be noted that crude oil has not broken to a new since putting in the 2017 high at $55.67 on January 3rd. alternatively, the commodity has failed to put in a new daily low since trading to $51.34 on January 10th.
Crude Oil Price, Daily Trend with Average

(Created Using IG Charts)
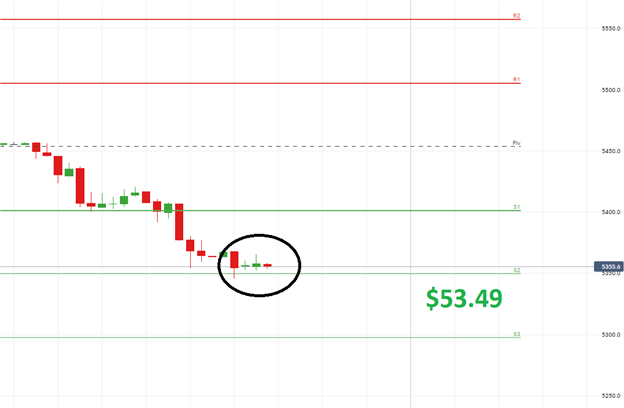
Currently crude oil prices are resting above a point of intraday resistance found at the S2 pivot at $53.49. If prices continue to slide, intraday analysis has the next point of support at $52.97. While a move to or past $52.97 should be seen as significant, crude oil prices will need to make significant lower lows to suggest an end to the previously mentioned ongoing consolidation.
In the event that crude oil remains supported, a bounce in price may take the commodity up towards the first value of intraday resistance found at $55.05. Other values of resistance include the R2 and R3 pivots found at $55.58 and $56.09 respectively. It should be noted here that a move above the R3 pivot would place crude oil prices at a new 2017 high, effectively breaking it from the previously mentioned range.
Crude Oil Price, 30 Minute with Support & Resistance.

(Created Using IG Charts)
To Receive Walkers’ analysis directly via email, please SIGN UP HERE
See Walker’s most recent articles at his Bio Page .
Contact and Follow Walker on Twitter @WEnglandFX.
