In this webinar, we delved into the trading process and a few favorite trade set-ups. We looked at several fairly recent examples of trades utilizing trend and market conditions, support & resistance, candlesticks, and chart patterns.
We understand the difficulties of trading, which is why we’ve put together a variety of guides designed to help traders of all experience levels.
To begin with, each trader must find what resonates with them when it comes to developing a trading methodology. While many traders utilize the same tools and perhaps similar combinations of analysis which make their approaches comparable, trading styles are like fingerprints – there are no two exactly alike.
The purpose of this session is to give you a peek into the type of things I look for when seeking out high-quality trade set-ups, in hopes of helping spark ideas as to how to create your own process. Below are a few important components which are at the foundation of my approach used to guide the decision-making process.
Top-down process
The process starts from looking at a basket of markets and currency pairs from afar, starting with longer-term time-frames and working lower, but mostly focusing on the daily time-frame and then dialing in on the 4-hr, and occasionally the 1-hr chart (depending on the market and volatility).
By taking this approach, you can see the broader path of least resistance before drilling down to time-frames where the trades are ultimately identified and executed on.
Identify trend & market conditions
One can label the market as trending higher, lower, or trading sideways. There are numerous ways in which traders identify the trend, but the approach I take is by simply looking at how swing-highs and swing-lows are situated to one another, that is – an uptrend is marked by a series of higher-highs and higher-lows, while a downtrend is marked by a series of lower-lows and lower-highs. A sideways market, of course, has no clear sequence, but if in a clean range will have highs and lows at relatively similar levels.
Trending up, down, sideways
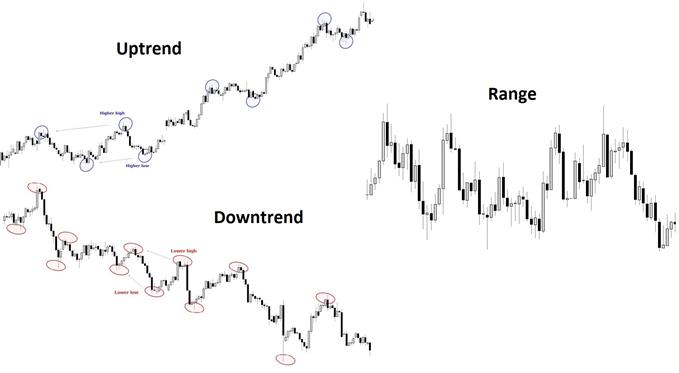
Also, volatility is taken into consideration. Typically, a high-vol environment will have more opportunities, and since the market is moving faster it will provide more 'good looks' on the faster time-frames (i.e. 4-hr, 1-hr). Low-vol environments are typically choppier and require more patience with trades. These are often best approached with a longer time horizon in mind as it takes more time to reach profit objectives.
Whether you are a new trader building a foundation or an experienced trader struggling (happens to the best), here are some ideas for Building Confidence in Trading
Utilizing support and resistance
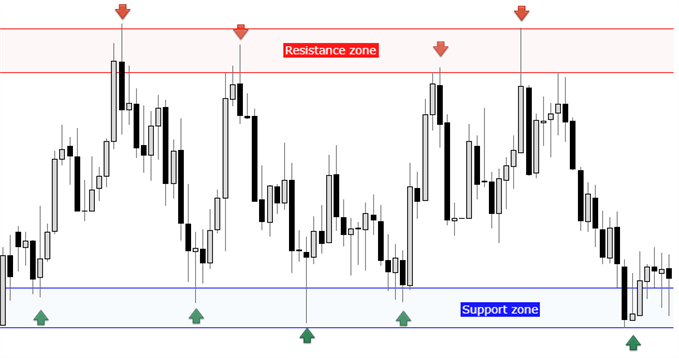
At the foundation of most technical approaches is support and resistance, it’s no different on this end; in fact it is utilized as the primary input for identifying high-quality set-ups. There are numerous ways to identify support and resistance, but the preferred method is simple price support and resistance along with trend-lines and light slope analysis.
Price rarely touches off at identical points each time, which is why zones are utilized. Ideally, there is confluence between support or resistance of varying angles: i.e. – horizontal price support coupled with a trend-line. See this past session for more on support, resistance, and price action trading .
Support and resistance zones
Candlestick analysis
One of the final pieces to a good set-up for myself, is a proper candlestick. This often times acts as the trigger for a trade and is also used for stop placement. Key reversal bars are primary, but in the event of a breakout from a chart pattern, a strong full candlestick can initiate entry.
As far as stops are concerned using candlesticks, placement should be sufficiently beyond the low or high of the candle (depending on whether long or short). If the market trades beyond the swing-low/high then the reversal off a key level of support or resistance is likely invalidated and the trade idea proven wrong.
When trading a breakout scenario, the stop is set below the low for a strong bullish candle and above the high of a strong bearish candle. For more, check out this past webinar on trading candlesticks .
Examples of Candlesticks
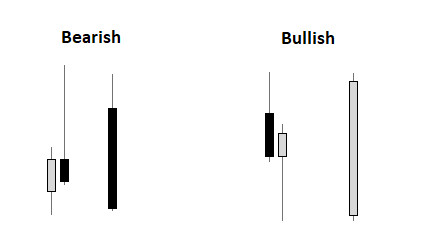
Chart patterns
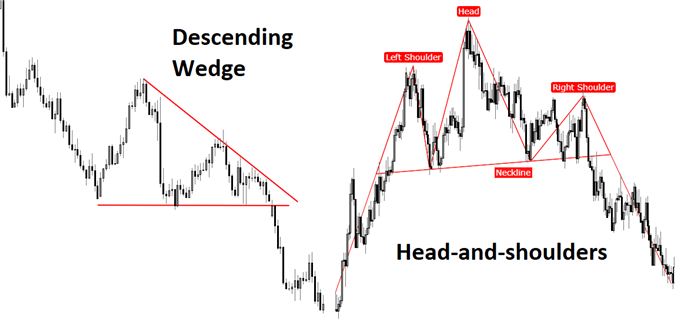
Chart patterns are also a major source for trade set-ups. There are a couple of patterns which I find to have the highest probability of working when triggered – ascending and descending wedges and head-and-shoulders.
The ascending wedge is marked by higher lows and a flat top, and typically work best when within the context of an uptrend. Conversely, a descending wedge is one which is marked by lower highs and a flat bottom, and in reverse of its bullish counterpart, work best within the context of a downtrend.
Head-and-shoulders patterns, whether it is of the traditional (bearish) variety or inverse (bullish), are the second go-to pattern. For the full run-down on these formations, check out the webinar discussing classic chart patterns.
Examples of Two Preferred Chart Patterns
Bringing it all together
All the aforementioned are the components, but it’s the mixing and matching of these components (confluence) which brings conviction to a high-quality trade set-up. For example, a bullishly trending market which pulls back to confluent price and trend-line support, followed by a bullish key-reversal bar, offers, in my world, an ideal set-up for a long-trade.
However, it’s not often that you get a ‘perfect’ set-up; more often than not there are only a small handful of factors which align, but still provide you with an edge, or advantage. And even then, when you have an edge, many of those trades won’t work. This is why, while a good strategy and trading plan are important to successful trading, having a strong understanding of proper risk management and trading psychology are extremely important. Even more important than the analysis and strategy(s).
For the full conversation and examples , please see the video above…
Enjoy the video? Join Paul or any of the team’s analysts live each week for webinars covering analysis, fundamental events, and education.
Past recordings you might be interested in : Creating a Trading Plan ; Handling Drawdowns ; Risk Management ; Analysis, keeping it simple ; 6 Mistakes Traders Make ; Focusing on the Process ; Building Consistency ; Classic Chart Patterns, Part I ; Classic Chart Patterns, Part II
---Written by Paul Robinson, Market Analyst
You can follow Paul on Twitter at @PaulRobinsonFX