Student's Question: From the chart posted below i was able to identify what i believe to be a clear resistance line (the red line) @ 1.6085 and a clear support line (the green line) @ 1.5670. would these line be accurate??I often see other areas of 'congestion' and they seem to be other areas of support and or resistance between these two lines... would the lines coloured in blue also count towards support in this 4HR historical chart of the GBP/USD .
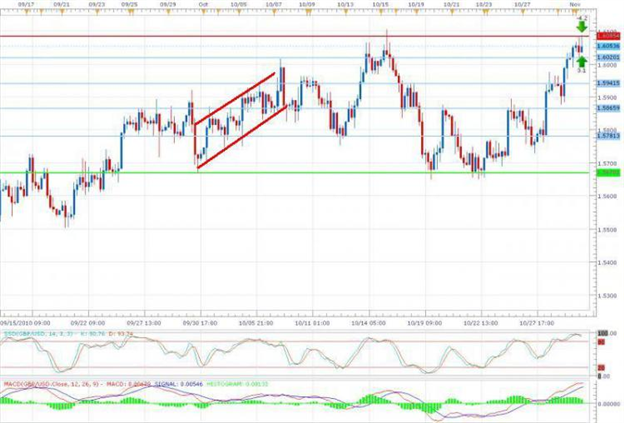
Instructor's Response: Nicely done...You definitely have a good understanding of support and resistance levels on a chart. Yes…the blue lines would represent intermediate support and resistance levelsAlso keep in mind that support and resistance lines do not always have to be horizontal. There can also be ascending and descending trading channels as price action moves up or down. (An ascending trading channel is noted on the chart in red.) Even though these channels are on an angle, the rules for trading them would be the same as trading horizontal support and resistance: go long at support and go short at resistance. As always, trading in the direction of the Daily trend will result in a higher probability trade.As a general rule of thumb when we discuss support and resistance, think of a room with a floor and a ceiling.The FLOOR is SUPPORT and the CEILING is RESISTANCE. A large ball bouncing between the FLOOR and the CEILING represents PRICE.When PRICE (BALL) hits the FLOOR (SUPPORT) it bounces UP. When PRICE (BALL) hit the CEILING (RESISTANCE) it bounces DOWN.When the PRICE (BALL) breaks through the CEILING (RESISTANCE); the old CEILING (RESISTANCE) becomes the new FLOOR.