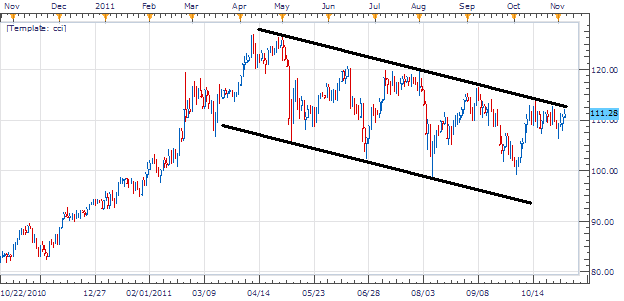
UKOIL (Brent) has continued printing lower lows Since UKOIL printed its May 20th high at $126.51 As we move down the graph a price channel becomes apparent with firm lines of support and resistance. Price is currently testing resistance near 112.50. Support currently resides at lower lows near 93.60.
Traditionally oil markets will follow basic fundamental analysis. When economies are booming and industry is doing well, oil comes into high demand driving up prices . Conversely, as economies and business slows oil prices tend to decline. Next week on the economic calendar events such as German production numbers and the BOE rate decision will give us more insight into the state of world economy.

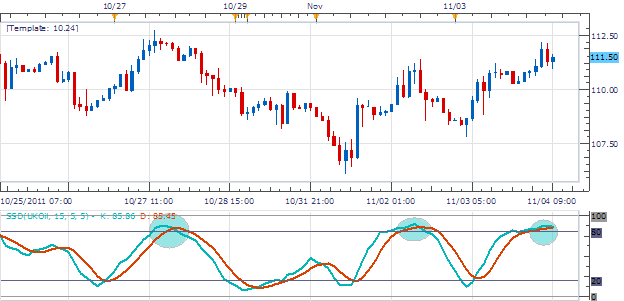
Taking Price in to a 2Hour chart we can utilize the Stochastics indicator to find entry signals. We are looking for the %S line to cross over our %D line signaling an opportunity to trade with the trend. Our signal is optimal as currently both lines ( %S & %D ) are residing above the overbought level of 80. A break below this point also can be used as a signal of bearish momentum.

My preference is to sell UKOIL on a stochastic crossover above our overbought line , near a price of 110.50. Limits should look to first target 106.50, then an extension at 95.50. Stops should be placed at 112.50 for a clear 1:2 Risk/Reward setting.
Alternative scenarios include price breaking through resistance for a new bull run in UKOIL.
Additional Resources
---Written by Walker England, Trading Instructor
To contact Walker, email [email protected] . Follow me on Twitter at @WEnglandFX.
To be added to Walker’s e-mail distribution list, send an email with the subject line “Distribution List” to [email protected].
provides forex news on the economic reports and political events that influence the currency market. Learn currency trading with a free practice account and charts from FXCM.
