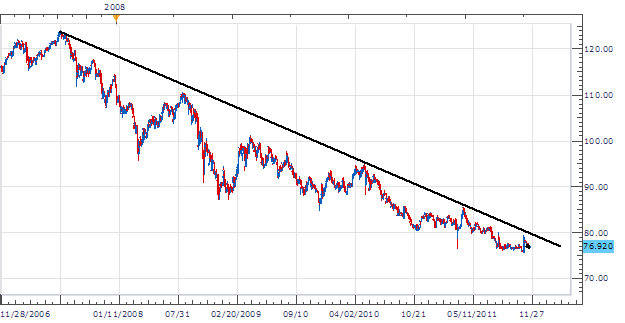
The USD/JPY continues its descent by printing lower lows and highs from its 2011 peak, on April 6th at 85.56. The pair has moved a total of 1001 pips down to create its current low at 75.55 on October 31st. Trend traders will look for this move to continue, selling on retracements towards support.
Fundamentally, both the USD and the JPY remain safe haven currencies that perform best in a “ Risk off ” environment. The JPY however, appears to be maintaining its strength against the buck due to continued economic uncertainty out of the US. Traders will need to continue to monitor the economic calendar for continued insight into this ongoing down trend.
Once we have found our long term trend, we can move in and look at our 2Hour chart. Below you will find the creation of a price channel. This channel is created by drawing a trend line through as many connection points as possible. Resistance can be found by linking the November 13th at 17.25 with today’s price action. This line may be copied in marketscope 2.0, and extrapolated to form support connecting our November 14th-18th lows.
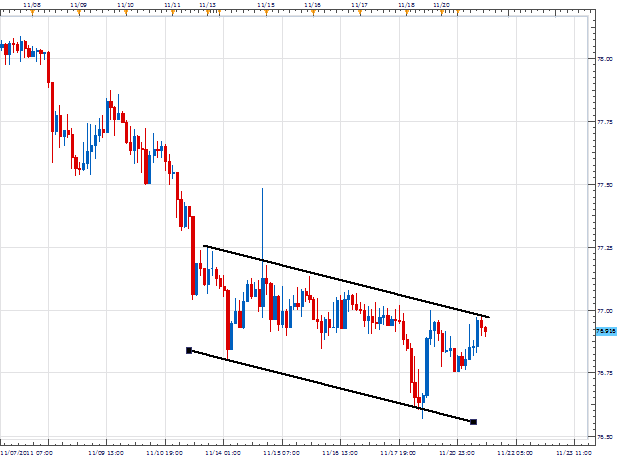
My preference is to sell the USD/JPY against the test of resistance on our price channel. Entrys should be placed near 76.95. Stops should be placed over resistance near 77.15. Limits should look for the bottom of our channel near 76.55 for a clear 1:2 Risk/Reward scenario.
Alternatives include price breaking resistance and move to higher highs.
Additional Resources
---Written by Walker England, Trading Instructor
To contact Walker, email [email protected] . Follow me on Twitter at @WEnglandFX.
To be added to Walker’s e-mail distribution list, send an email with the subject line “Distribution List” to [email protected].
provides forex news on the economic reports and political events that influence the currency market. Learn currency trading with a free practice account and charts from FXCM.