Trading patterns can be difficult to recognize for beginning traders. These patterns may appear in a variety of shapes and sizes in various positions and time frames on our charts. Spotting these patterns can be just as important as understanding a technical indicator. Knowing how to pinpoint them on our graph can give clues and signals on the future direction of price action.
One of the most recognizable is the head and shoulders pattern. This is considered a topping pattern in an uptrend where price fails to yield new highs. Fewer traders though are familiarized with the inverse trading pattern. It is exactly the same as the traditional formation, just upside down!
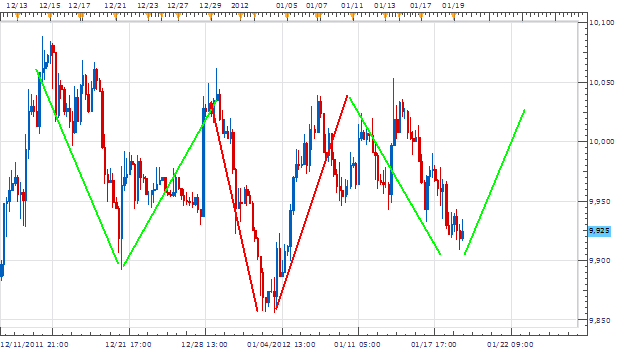
Below, we can find an example of a developing inverse head and shoulders on the Dow Jones -FXCM Dollar Index (Ticker: USDollar ) 4Hour chart. This distinct pattern is primarily recognized by its series of lows formed on our graph. The December 21st low of 9,892 creates our first inverted shoulder. From the left shoulder price must again advance, but fail at resistance to create a new high. Next price is seen to decline again! Forming a lower low on January 3rd at 9,856, the head of our pattern is created. Our last shoulder is the most critical piece of the pattern. Price must fail to create a lower low at this juncture, while testing the low created by our primary move lower.
If all of the analysis holds together, and USDollar Support holds over 9,900, we have successfully identified an Inverse head and shoulders pattern!
Once the inverse head and shoulders is identified we can then begin to look for trading opportunities. First, a trader should extrapolate the neckline as seen in the USDollar graph below. This line, forms a barrier price must break in order to create a higher high. Breakout traders will place entrys above the neckline of an inverse head and shoulders waiting for this event to occur.
This resistance line may also be useful in extrapolating potential profit targets. Next, traders may measure the distance from the lowest low to the neckline. Once we have this value, it can be added back above resistance for our profit target. These targets should be primary targets only. If a trend resumes / begins price may run even further than these levels.
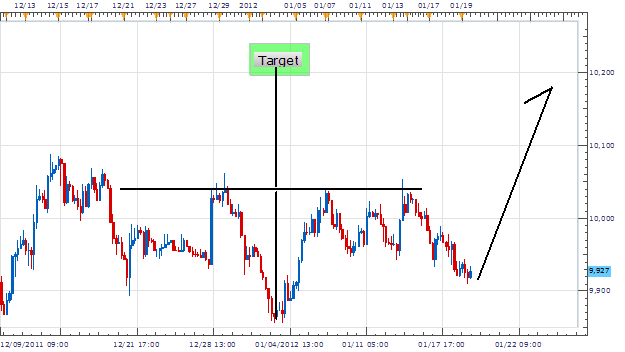
My preference is to trade a neckline breakout on the USDollar over 10,050. Stops should be placed under support near 10,000. Our limits should be set at 10,200 or better for a clear 1:4 Risk/Reward ratio.
Alternative scenarios include price breaking lower under 9,850.
---Written by Walker England, Trading Instructor
To contact Walker, email [email protected] . Follow me on Twitter at @WEnglandFX.
To be added to Walker’s e-mail distribution list, send an email with the subject line “Distribution List” to [email protected].
provides forex news on the economic reports and political events that influence the currency market. Learn currency trading with a free practice account and charts from FXCM.