Article Summary: It’s easy to see a big move and want to jump in so that you don’t miss the next trend. However, there is a specific candlestick pattern that you can keep an eye on to make sure that you’re not entering on an exhausted move.
“The first principle is that you must not fool yourself and you are the easiest person to fool.”
Richard P. Feynman
Once you’ve been in the markets for a long enough period, you see that what goes up, can just as quickly also go down. However, there are a few things you can keep an eye on to make sure that you’re not chasing a big move or entering as price enters near resistance or selling right upon support.
Using Candlesticks & Trendlines to Spot False Breakouts
As the quote above warns, when trading, the easiest person to fool is often yourself. The reason for this seems to be that when chasing a specific return, traders can end up forcing set-ups that aren’t really there. Naturally, this can be fatal to the survival of your account but there is a form of market analysis that can help you see whether a pending set-up still has room to run or is likely to fade away.
If you don’t feel like you have a comfortable grasp on trading with candlestick, we’ve created a FREE 20-Minute course here to about the basics of price action and how to use the clues the market is providing to place trades.
When the Market Is Giving You a Yellow Light
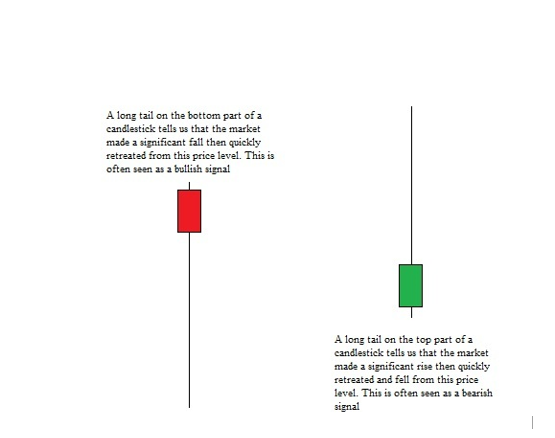
Candlesticks can be used at key technical levels to ensure you’re not running into the trade with your fist full of cash just as everyone else is leaving the trade or flipping their position. The easy way to see if the trade or set-up doesn’t have the conviction necessary to put your money at risk is through the wick. A long wick shows us that the close took placa good distance away from the high or low and shows a lack conviction on that price extension.
Confirming a Technical Pattern Extreme with Candlestick Wicks
LEARN FOREX: XAUUSD Showed a Large Upside Wick or Shooting Star at Resistance
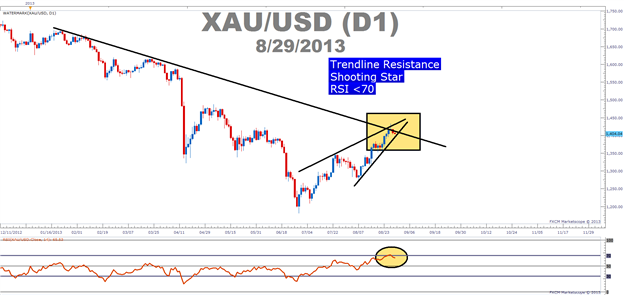
When price comes up to a level of support or resistance, a lot of traders are eager to enter the breakout. However, false breakouts occur and it’s helpful to see false breakouts in real time. Below are a few examples of when traders were not able to hold price past an extreme such as a trendline or the Relative Strength Index and then you will see a long wick against the extreme.
LEARN FOREX: Multiple Levels of Resistance on EURAUD Confirmed With A Long Upside Wick
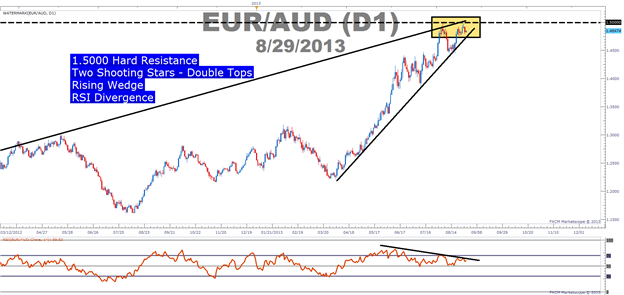
Another example of a long wick against a few extremes is taking place with RSI. As you can see above there is declining RSI into higher price highs which shows bearish divergence along with the horizontal line at a significant price level on 1.5000 and finally large rising wedge. These three forms of resistance are met with a large upside wick which means the conviction wasn’t there as a whole and we could see a move down.
When a Breakout Is Truly a Breakout
There are a handful of ways to tell when a clean break of resistance could have some follow through. Instead of seeing a wick through a level of resistance followed by a move back down, a strong candle through resistance with a close above it strong signal that the move could continue. By looking for a Strong candle body through a key level, you can see that conviction may very well carry though.
Learn Forex: Resistance Became Support on GBPUSD As a Large Candle Broke Through
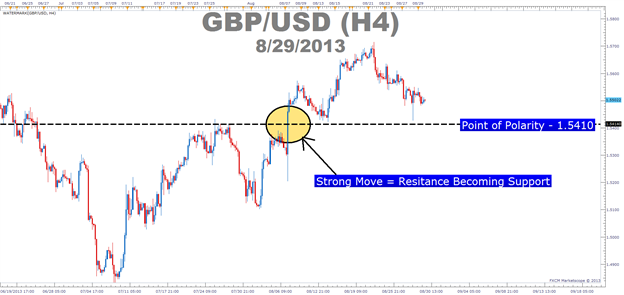
The price action on GBPUSD is very convincing. In other words the heavy level of resistance at 1.5410 was broken through on a news break with a strong candle which shifted GBPUSD into a position of strength. After that clean break, the 1.5410 level of resistance turned into a floor as price pushed higher.
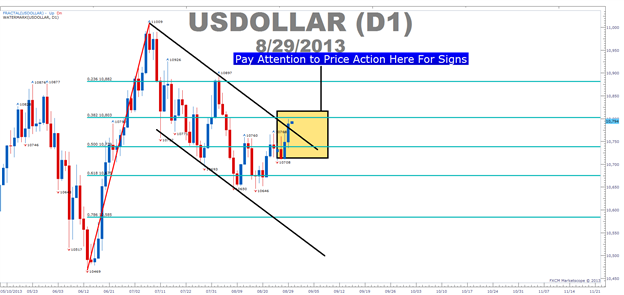
LEARN Forex: Strong Candle Break Shows USDOLLAR Correction Could Be Finished
Closing Thoughts
The body of a candle is a great way to see if a breakout has conviction or not. If key technical support or resistance only has a candle wick through it and the close of the candle is relatively far away from the resistance or support, you can see that as a market that has likely exhausted itself upon the move and may turn lower. However, a big candle body through that key level shows you that there may be room to run and that you can look to that broken level as a place to look for entries or to set your stops around in the future.
Happy Trading!
---Written by Tyler Yell, Trading Instructor
To be added to Tyler’s e-mail distribution list, please click here .
As a dedicated FX Trader, would you like the following?
- Faster access to fundamental releases that is likely to move the markets
- Feedback on market movements in real time
- Real time Speculative Sentiment Index readings
Our Real Time Analyst on Demand is a fee based service that gives you access to our professional trading staff from 6am – 2pm ET every trading day so you can get feedback on your trade setups and ideas.