Talking Points:
- UKOil chart has recently broken outside a triangle
- Geopolitical tensions may disrupt oil supplies
- A global economic recovery could continue to put upward pressure on oil prices
When traders can combine a strong fundamental picture with solid technicals, solid trading setups can be found. Such a case exists for UKOil as the bullish fundamental backdrop aligns itself with triangle price pattern technical setup.
After 6 years of economic malaise, the global recovery seems to be gaining traction. With recovery comes the demand for energy resources. Most notably, rising oil demand is putting upward pressure on price. However, this increased demand comes at a time when global oil production has been down. At the same time, renewed hostilities in Libya combined with heightened tensions between Russia and the Ukraine threaten to disrupt supply applying further upward pressure on oil price.
Since hitting a high of 112.37 on 3/3 2014, UKOil has dropped 7.5%. Since that low of 103.94 that was hit on 4/2, UK Oil has been battling back. While still under the shadow of a daily downtrend line, UKOil had been consolidating within a triangle price pattern in the 107.00 area. The convergence of a downtrend line with an uptrend line forms the borders of triangle consolidation pattern similar to the one that was formed on GBPUSD
Learn Forex – UK Oil Daily Chart
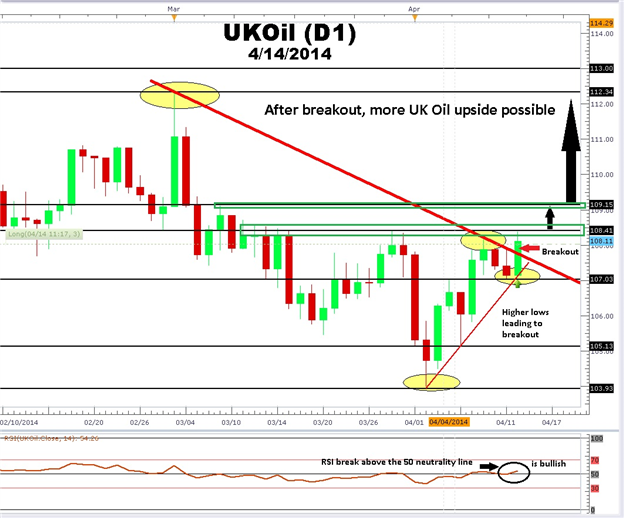
(Created using FXCM’s Marketscope 2.0 charts)
In the daily UKOil chart above, notice how initially price was turned back from the red downtrend line on the first attempt. On the other hand, higher consecutive swing lows continue to demonstrate the strength of the bulls. Later, UKOil’s second attempt successfully took out the trend line and we have the makings of a powerful breakout.
Using the Relative Strength Index (RSI), an oscillator that tracks momentum, traders can see that a reading above the 50 supports further UKOil upside. In addition, levels of resistance and support can be drawn on the daily chart using recent swing highs and swing lows. The black horizontal lines can be used to place trades near support as well as profit taking levels like in the example below. You can read about the basics of trading support and resistance here .
Learn Forex – UKOil Hourly Chart with daily Support and Resistance
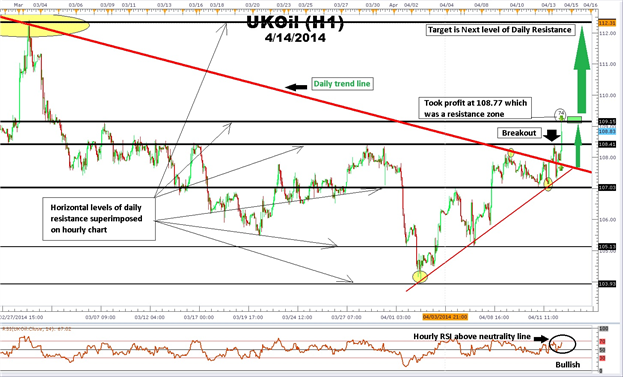
(Created using FXCM’s Marketscope 2.0 charts)
A Real Time Example: UKOil Hourly Chart
Moving down from the UKOil daily time frame to the hourly we can see price structure in more detail. By carrying upper time frame support and resistance levels down to the hourly, we can pinpoint entries and exits. In the example above, I entered long at 108.03 just above the red downtrend line and the psychological 108.00 area. Price move to the 3/28 daily high of 108.36 then moved to the 3/7 high of 109.07 before pulling back. I took profits just shy of that level at 108.77 for a quick 74-cent move.
So what’s left?
The gusher in UKOil may not be finished. A break above the 3/7 resistance high could open a fast path to the 112.34 3/3 resistance high. This would be a $3.00 move in UKOil. A move back below the 107.00 area could lead to a retest of 104.00 area and invalidate this bullish scenario. With strong demand, warmer weather, and low supplies, this may be a ‘perfect storm‘ for oil bulls.
---Written by Gregory McLeod Trading Instructor
This article showed you how to identify potential areas of strong support and resistance in the form of yearly pivots. To extend your knowledge take this free interactive video tutorial on the RSI indicator . RSI can be used with pivots to pinpoint entry levels. You will be asked to sign the Guestbook which will give you a Universal Access Pass to other free Forex lessons.
Watch Greg McLeod at 9:30 ET in the + Live Classroom