Talking Points:
- Traders can use price action to diagnose market conditions, grade trends, and identify support and resistance levels.
- In this article series, we teach how to perform the entirety of an approach with price action.
In our last article , we looked at how traders can begin to line up trade opportunities using price action as the primary form of technical analysis.
In this article, we’re going to move the topic forward by investigating entry setups and the triggering of positions.
Entering positions
All of the analysis in the world is worthless without a cogent manner of entering a trade. You’ll find traders around-the-world struggling with this premise, as they try to find the ‘perfect’ entry into a position.
Well, save yourself some time: There is no such thing as a ‘perfect’ entry into a trade. Why? Well the future is unpredictable, regardless of how you look at it… and the shorter the term, the more unpredictable things become.
So the more effort you waste on trying to get that picture-perfect entry to the 1/10th of a pip means that there is less effort you can steer towards trade and risk management.
Rather than trying to find that ideal point-of-entry, instead look at the potential cost of the position. As we shared in our last article, traders can analyze the potential cost (stop distance) of a position by investigating where the stop should be placed based on that specific market condition. So, if we’re seeing a trend, traders would likely want to put their stop below a previous swing-low (so that if the trend reverses, the loss can be mitigated).
Or if a range is being traded, the stop goes below the low of the range so that, once again, if support gets broken and a breakout goes in the opposite direction of your position, you can exit the trade before the loss becomes unbearable.
Once this analysis has been performed, and once the trader has identified where they’ll need to place the stop to properly approach that particular setup – they can then begin looking at the entry to the position on the shorter-time frame (entry chart), as outlined in the multiple time frame portion of our last article.
To trigger the position, traders can move down to the lower time frame and look for a formation that shows that the setup may be coming to fruition.
Trading formations
Let’s look at an example in the effort of simplification:
Let’s say that a screaming up-trend is taking place in USDJPY , and you’ve identified that you want to get long in the pair. But from the daily chart that you’re using for trend analysis, price is very close to a high, and it’s difficult to determine when or how to enter.
Rather than look at the chart until your eyes go crossed, you can simply go down to the 4-hour chart, and wait for price to show the potential for support coming into the market after a pullback (so that you can attempt to buy this uptrend ‘cheaply’).
But even better, if you can notice that a price action formation such as a bull flag is taking place, you have even more conviction that the up-trend you had observed on the daily chart is coming back to order.
Bull Flag setup in USDJPY
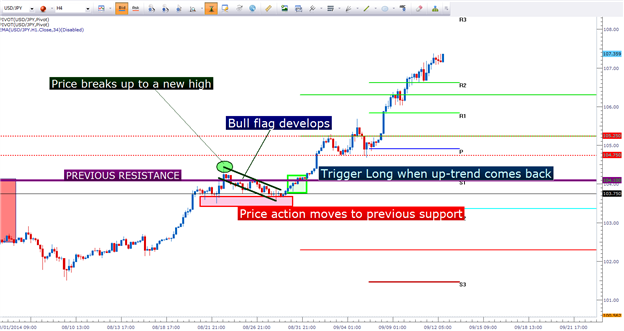
Image created with Marketscope/Trading Station II; prepared by James Stanley
But the bull flag isn’t the only formation that can be used in this situation.
Traders can also look for a formation such as a morning star , or a bullish harami setup on the shorter-term chart, under the premise that the longer-term setup may be coming to fruition on this short-term setup.
Bullish Harami in the S&P 500
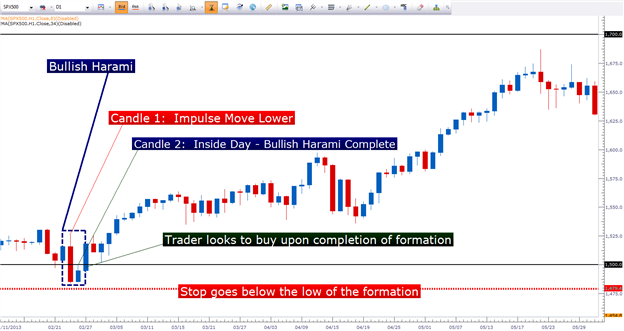
Taken from Trading Reversals with the Harami
These shorter-term formations can bring multiple points of value to the trader: Not only can they help get probabilities moving towards the trader’s favor, but they can also help in offering multiple points of risk management.
If trading a morning star formation on the shorter-term chart, rather than using the stop that was investigated on the longer-term setup, traders can look to trade more aggressively by placing the stop under the low of the morning star setup.
But this isn’t the only way that traders can look for to trade the longer-term in scope of the shorter-term: Traders can also look for congestion formations on the shorter-term chart with the idea that the shorter-term congestion may be the ‘early stage’ of the longer-term trend or setup coming back into the market.
We discuss this premise in the article, The Price Action Trigger , in which we show traders how they can use a combination of multiple time frame analysis along with price action in an effort to trade congestion or consolidation patterns in terms of ‘the bigger picture.’
Before employing any of the mentioned methods, traders should first test on a demo account. The demo account is free; features live prices , and can be a phenomenal testing ground for new strategies and methods. Click here to sign up for a free demo account through FXCM.
James is available on Twitter @JStanleyFX
Are you looking to take your trading to the next level? The 360° Course offers a full curriculum, along with private, weekly webinars in which we walk traders through dynamic market conditions using the education taught in the course.
If you’d like a customized curriculum based on your current experience level, our Trader IQ course via Brainshark can offer assistance. Please click on the link below to complete our Trader IQ questionnaire.
Would you like to trade alongside seasoned professionals throughout the trading day? On Demand gives you access to Analysts during the most active periods of the trading day.
Would you like to enhance your FX Education? has recently launched University ; which is completely free to any and all traders!