-
View Larger Image
Welcome to the Artificial Intelligence Outlook for Forex trading.
VIDEO TRANSCRIPT
Okay, hello everyone, and welcome back. My name is Greg Firman, and this is the Vantage Point AI Market Outlook for the week of June 17, 2024.
U.S. Dollar Index
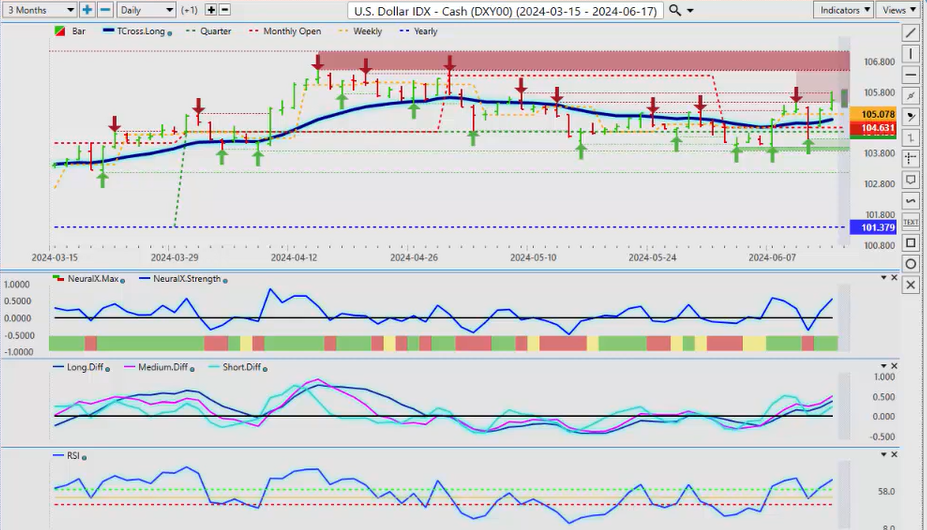
To get started this week, we’ll begin with the Dollar Index , where we usually do, which is very, very important for Forex traders, equity traders, and commodity traders. We’ve come off a volatile week, the data again failing to support any kind of real aggressive moves from the FED . But let’s take a different approach to this this week. Now again, heated debates on Bloomberg, CNBC, and a number of different financial channels. But let’s look at this realistically from the FED fund futures perspective because this directly affects whether we’re buying or selling US dollars .
As you can see, I’m on the CME Group; all the heavy lifting is done here. This is not my opinion or somebody else’s opinion; this is what the interest rate traders are betting on. For July, you can see this column here: we have a mere 10% probability that the FED will cut, and 80% probability (89.7%) that there will be no change. But the important one to also look at, as I’ve repeated in most of these outlooks, is that there is no pathway to rate hikes. It’s off the table, the FED has now said. When we look out to September on the FED fund futures , we can see now there’s a 67.7% probability that interest rates will change; they will be cut. Only a 32.3% chance that there’ll be no change. Again, no hikes.
When we look at November, once again very interesting. When we start looking at it by the betting odds, right? 80% probability of easing, only a 19.5% probability that there’ll be no change. Again, zero probability of a rate hike. That is the most key point that I need to make. When we look at December, this increases to 96.2% with a probability of no change at 3.8%. Again, zero pathways to rate hikes.
So when we look at this, this updates in real-time every week and gives us a perspective that there is no pathway to rate hikes. That’s the main point there. The probability is the interest rate traders, as am I, are still betting on three cuts this year. The FED is saying it’s only going to cut once, but it also threw in that commonality of data dependency. So once we look at this, we are not just technical traders or intermarket analysis traders; we can’t ignore fundamentals of interest rates here, guys.
So when we look at this right now, the Dollar immediately has responded and has moved higher, but the data points again I’ll leave it alone, they’re not supportive of rates even higher for longer. So for next week, our T cross long will come in at 104.89. We have significant resistance, as I discussed last week, up into this 105.74 area. Again, we’ve come down with our predicted RSI hit this.
Now, once again, as I’ve said many, many times in these outlooks, this is a weekly outlook, guys, so I’m using the T cross long without the other short-term indicators because that’s what they are: short. The T cross short is a short-term indicator. Now what you can do, if you’re so inclined, you can go down to your triple EMA cross, and you can see that I removed the medium and the short. Now I could add the short if I wanted to, but again, that’s a very short-term indicator. You can use that for day trading, absolutely. But remember, whenever you go to short-term indicators, that probability increases of a false signal.
So when we have a hard anchor point using that T cross long, again, you can change it any way you like, but when you see right here there were multiple crossovers and it was a false signal. So the T cross long, the standard that I’ve talked about at the seminars and I’ve talked about in the VP live room. Now if you’re looking for short-term strategies, then please do feel free to sign up for the Vantage Point live training room Monday, Wednesdays, and Fridays where we do all these short-term using some of the short, medium, and long-term tools. But for a weekly outlook, we need to look at hard anchor points. And again, there are many different combinations that you can come up with here. I could take the TR cross long off altogether and just use the short term, but you can see it’s very, very choppy, extremely choppy, and it’s more difficult to find your stop-loss placement. So when I use the T cross long, because I’m going out for five days, guys, this is an outlook, not a recap of something that’s already happened. So I need to get a longer-term area to identify the retracement points and the stop-loss.
So 104.89, I believe this level will be tested again next week. The market will digest all of the data, will digest FED fund futures , what they think; they’re not in agreement with the FED any more than I am, and those numbers I’ve shown you. Then we look at the additional short, medium, and longer-term indicators on a day-to-day basis. But for now, the Dollar still has some life in it. But the point that I will gently make here is there is no pathway to rate hikes. That alone ultimately will be bearish for the Dollar . Now, that may not resonate for a few weeks, maybe a few months, but again, we’re looking forward, not backward, and the main thing is to identify that.
Gold
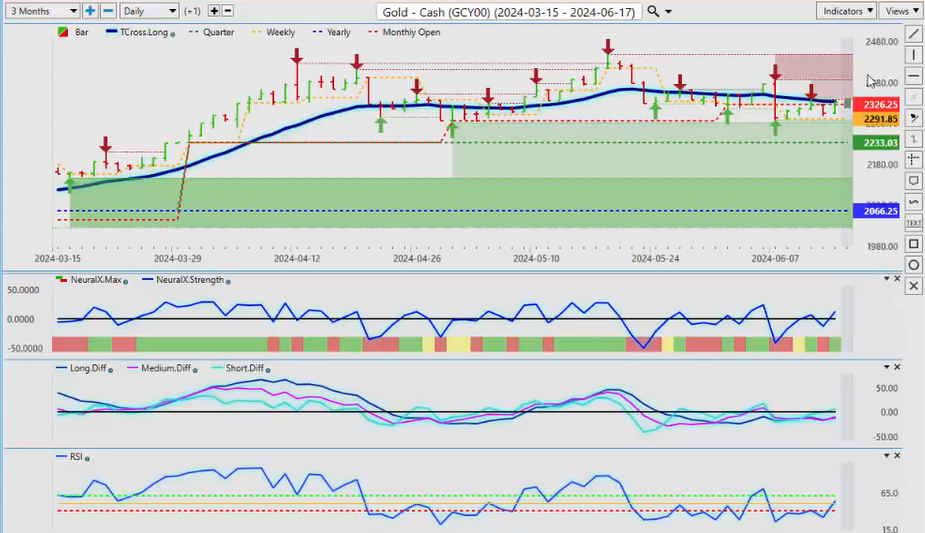
So when we look at Gold from the same standpoint, Gold is hanging tight, running right along our quarterly opening price at 2291. I would anticipate again that Gold traders will be gearing up for longs. Now, personally, I always buy Bitcoin in October and I always buy Gold in November. Can Gold rally before then? Yes, I believe it can because I believe that the incoming data will force the FED’s hand, which should push Gold higher ultimately. But for now, we are at a very, very interesting close here. You can see using the proper anchor points of the monthly opening price, based on price action, 2326 is the monthly opening price. And once again on Friday, we closed above that despite a strong Dollar .
The point that I’ll make is one of these two prices is not accurate, and either the Dollar is right or Gold is right. Now they both can move up and down together, but my view is the Dollar is the one that’s wrong, and ultimately it’s the one that moves lower and Gold moves higher with Bitcoin and equities. So for now, we just need to push through that T cross long, and again, this is one of the main reasons that the T cross long is used in a weekly presentation because we can identify our critical area. I don’t want to get caught up with short-term indicators here, guys. I could put a buy limit order at because I know that the T cross long, as you can see there, has been excellent shorts using that line. I don’t need a shorter-term indicator; that is my line in the sand. But in my respectful opinion, the strategy I’ve given is I want to close above the T cross long for two or three days in a row, and that will confirm I’ve got a shift in sentiment. And you can see it occurred right here: closed above it, closed above it, came back and retraced to it, and we buy. Boom. Again, very straightforward, not complex in any way, shape, or form, and that longer-term T cross long, again, is a line in the sand.
So I could put a buy limit order on here and say as soon as I clear this thing, a day trading strategy would be putting a buy limit order above 23, say 2335, right? Or I can wait and say, you know what, the Dollar does still have some life left in it. The direct inverse correlation between the two would have me on the sidelines until I get confirmation. But the indicators in VP are turning higher. The T cross, or excuse me, the neural index, the neural index strength, the predicted RSI is rising. I’ve got some action here on the MA diff cross. Once again, it does not point to Dollar strength; it points to Gold strength and potentially equities.
S&P 500 Index
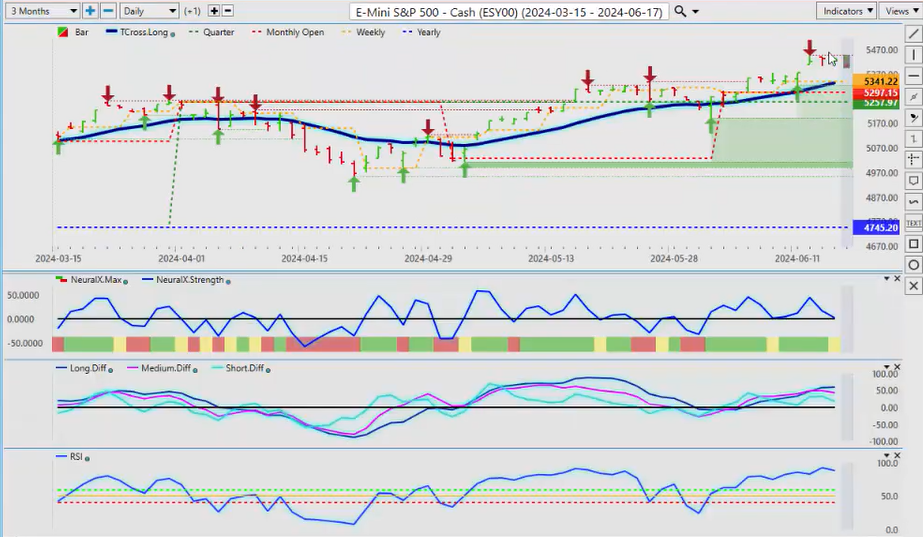
So when we cross-reference this to the Stock Market , again, we’re stalling out up here, which is perfectly normal. We’ve got some indecision because of the FED. So the way we would look at this is we have multiple anchor points. We can use the critical T cross long at 5335. So what I’ve shown you guys in the past is that you can click on your F8, and that will bring up your long predicted. Those are the two core predicted moving averages I use, and you can see that it brings the predicted moving average right up here. But this is a long-term predicted moving average. Again, guys, getting caught up with short-term indicators is fine if you’re a day trader and you’re a scalper, but remember the probability of a false signal is greater when you go down to the shorter time frames.
If this was a one-day outlook, then that’s fine. I could use multiple short-term indicators I could bring in here, but it’s not; it’s a weekly. So again, remember I have discussed this multiple, multiple times, but just to clarify, that’s why they’re being used, because they’re relevant. It’s for one full week, not one day, not one hour, right?
So right now, yes, there are some signs of weakness, but the immediate level is 5395. Then we use our T cross long. If we break down below that, now I do expect some form of retracement, but I also believe, as I’ve shown you from a neutral standpoint, not my opinion or this guy’s opinion or that guy’s opinion—I’m not interested in debating this nonsense—the FED fund futures are betting against the FED. I also am betting against the FED because why would I bet for them given their track record, right? So if that’s the case, then yes, we get a pullback on equities, but ultimately the stock market would respond positively to the FED cutting. And again, it’s still pointing to three cuts this year, and I’m on board with that.
So right now, you can see our MA diff has broken away, and it’s showing weakness. So the additional price levels that we use, 5341, which is very close to the Vantage Point T cross long, 5297, these are core levels. We’re still above our monthly but our yearly opening price, 4745. This is still a bullish sentiment. Yes, we’re at all-time highs, and do I buy high and sell low? Yes, I do at times, absolutely. But I need a technical in-market reason and a fundamental reason to do so, and I believe those conditions are met here. Yes, the data could cause more distortion, but ultimately the outcome is there are not going to be any cuts. That’s positive for equities, guys.
So again, we’ll monitor the same levels. The VP indicators are slightly overextended, suggesting a minor retracement, and then we’ll reassess. But I would anticipate 5341 is a potential retracement.
Bitcoin
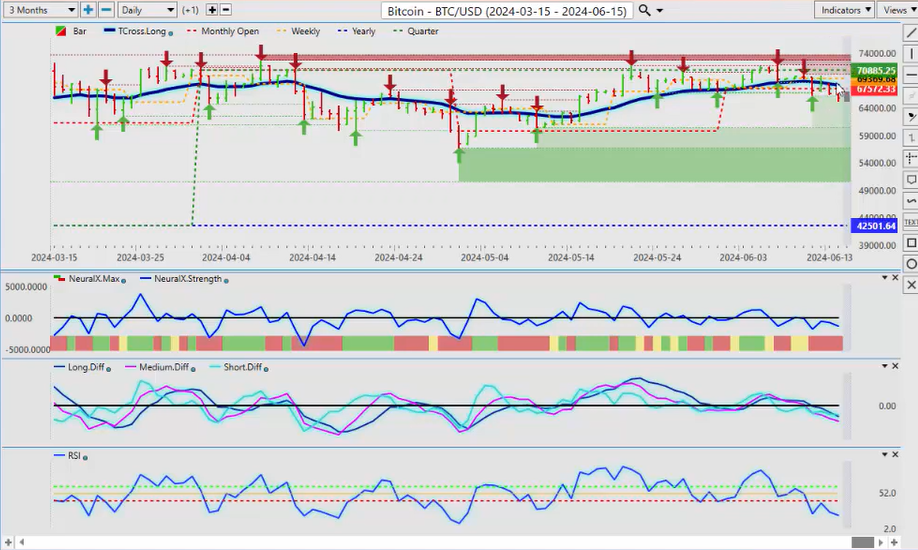
Now Bitcoin , again having a pretty good week, a lot of up and down, but we’re still not getting above that quarterly opening, and that’s my biggest concern right now: 70,885. I’d like to close above this and stay above it. But again, the next big push in Bitcoin , in my respectful opinion, only based on what I’ve seen over the last 10 years or so, October is a hot month for Bitcoin . So could we kind of trade sideways a little bit here? Yeah, we could, but I believe longs are building, and there’s nothing that the FED has said that has spooked me otherwise.
And the question here too is, can Bitcoin — Bitcoin has already grossly outperformed Gold . That doesn’t mean we don’t buy Gold ; it just means we keep a closer eye on Bitcoin . So usually, when I get a top forming like this, it’s actually not a top; it’s a top that’s about to be challenged. That key high that we’ve had most recently, 71,924, and then we’ve pulled back. So I would anticipate that sooner rather than later.
Uh, we should see Bitcoin extend. All I’m looking for is an MA diff cross, the line over the blue line, that classic contrarian signal to tell me that, look, here we go because the next move up on Bitcoin is likely to be substantial. There’s a lot of debate on this one too, guys, but the main number that consensus is around is $250,000 for Bitcoin potentially by the end of the year or next year. I certainly wouldn’t disagree with that because, again, it’s coming off a very, very strong year of last year, up over 150%, and we’re well up again over 60-70% this year, approximately. Don’t quote me on that, but there is strong buying here. Bitcoin again is a very funny asset class now because it correlates to what it feels like correlating to. It’s not a specific, ‘Oh, gold down, Bitcoin up,’ or vice versa. No, it can correlate; it can run on its own. It is not the same as these other asset classes.
So for now, minor a little bit more of a retracement potentially, but as soon as the market, I think, looks a little closer at the economic data, I think that they would prefer Bitcoin versus the US dollar .
Light Sweet Crude
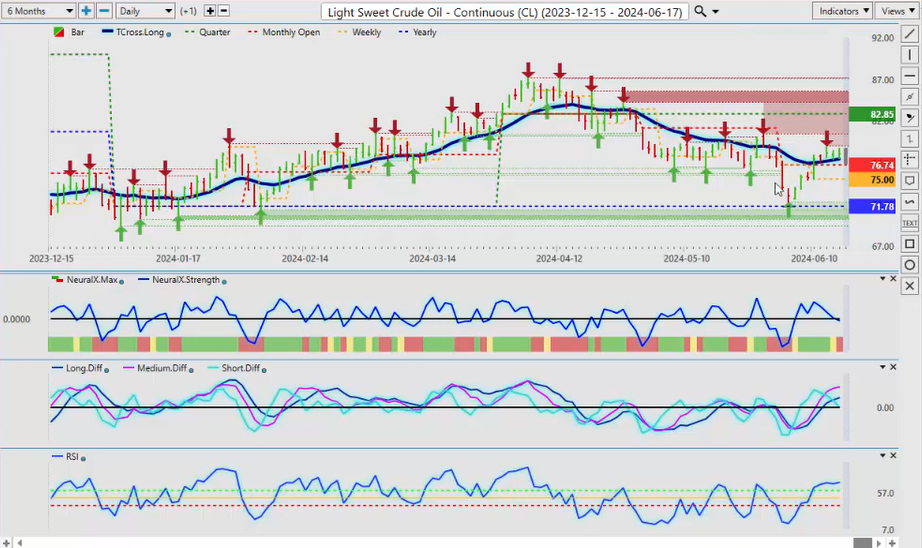
Now, when we look at light sweet crude going into next week, another key market that we would monitor here is, again, we’re coming directly off the yearly opening price, guys. We did, and again, short-term traders, we did this in the Vantage Point live training room using the shorter-term indicators and then combined it with the current yearly opening price. That yearly opening price at 71.78, I also discussed it here on this weekly outlook because, again, it’s a weekly outlook, guys, not a daily, not a monthly, a weekly.
So as soon as we approach the yearly opening price, which we’ve already done this year, which I talked about back in February, is another excellent buying opportunity off of that yearly opening price. Then we look for the shorter to medium-term indicators to confirm that we’ve got a reversal. As you can see right here, well, guys, we have the exact same signal that mirrors what happened back in February. This is absolutely one of my favorite trade setups, also in the Forex market, but the oil is correlated to a number of different Forex pairs or Forex currencies. Excuse me, the Canadian dollar , the British pound , very interesting stuff that the pound has a high correlation to oil contracts like the cash. But you can see the exact same contrarian signal combined with the exact same level, and it repeats itself.
So again, it’s a tough call to make because we broke that 76 level, but ultimately I’ve got that backup level of the yearly open, the current yearly open. Again, guys, if we go back 30, 60, 90 days, you’re moving the goalposts with a rolling performance model. I used them 15, 18, 20 years ago and I just gave up. I need the current; I’m not concerned with what went on last year. I need to know where am I in the current calendar year. Am I bullish or bearish on this? I am bullish on oil absolutely as long as I’m above the yearly opening price at 71.78. So that’s a critical level sitting there, and we’re coming off that.
Now again, why we use the T cross long is you can see that every three days in a row, good long trades off of that T cross long, right? So, and again, it’s impossible to script something like this because this trade setup is discussed each week using the T cross long. So we go up, we break through it, we come back to it three days in a row, 77.30, right? So let’s say I took this off, I went down here to the triple EMA cross, and I bring in the short-term crossover. I can add that in there if I so choose, but when I bring that in, that may cause some confusion, right? So right there, it’s coming back up, but that signal is confirmed over in this area where actually we’re buying it over here on the MA diff cross. Then I’m going to take profit going into the T cross long, and then I’m going to reset longs as long as I’m holding above my line in the sand, which is the T cross long. If I remove the T cross long, what would you get? Well, you may get a distorted signal. So if I took that off and I only use the short term, then, well, you could try and use that for day trading. I wouldn’t be opposed to it, but I absolutely want that T cross long as my backup. It’s been demonstrated over and over again how effective it is.
Because again, if you took the Warren Buffett approach versus a day trader’s approach, which one’s more profitable? Buffett’s more profitable. He looks for value in his stocks. He doesn’t necessarily buy high and sell low. He looks for value and buys where that value is. So there’s value three days or three—well, I would argue four days in a row of last week. You’re buying every single day off that T cross long. So we’re using a longer-term tool for shorter-term trading. That’s the way you want to look at it, guys.
DAX
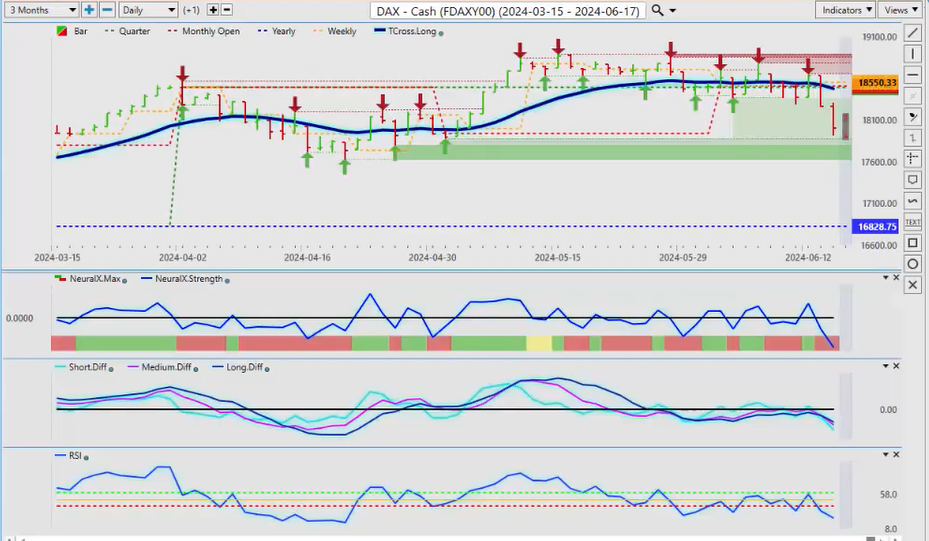
So on the European side, how do things look over with the DAX ? Well, guys, the Euro is going to struggle a little bit, as will the DAX , and that’s because of the European elections. So again, we can’t just look at levels and technicals and intermarket technicals; we also have to apply fundamentals to our trading. So the answer is that this is probably a buying opportunity. I anticipate in the weeks ahead, the global equity markets will turn again, and the DAX I think could be a good spot to look for longs. But again, 16,828, I believe we can come down further because the elections are going to be volatile. We’ll see what outcome—I think I know the outcome of that, but we’ll see. But for now, they’re in trouble, and that’s largely because of that fundamental, right?
And also, what’s very interesting here, guys, is that it’s also affecting the Euro , and they assume things will be negative because of a change in government, where I think it may actually be positive, to be perfectly blunt. But we’ll let the people in Europe decide and France decide these elections. But the Euro is going to be volatile because of this. In most cases, you’ve got either the DAX going down and the Euro going up, but they’re both going down. And that, again, is a fundamental causing that. That will separate, and then you will have either stocks up or the Euro up; usually it’s not both. But again, when we look at the VIX , we can make a better assessment.
Volatility Index ($VIX)
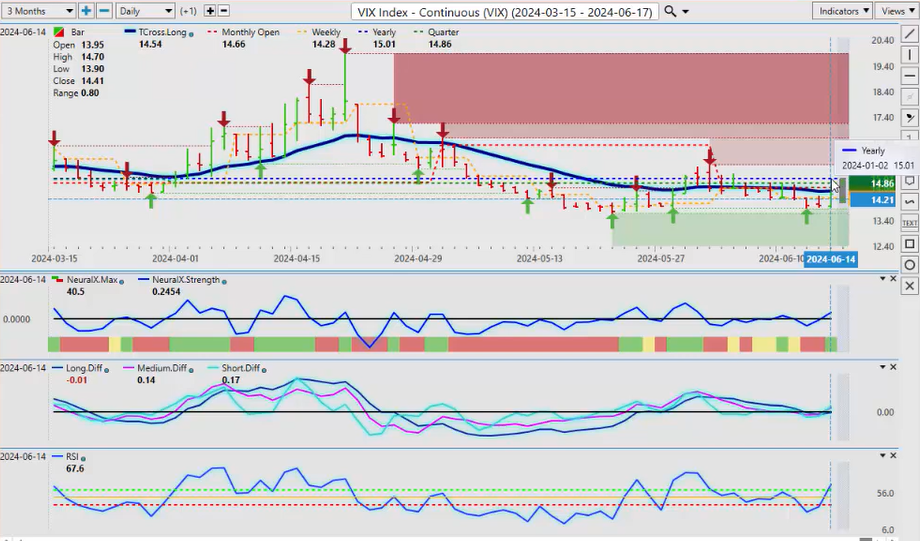
The VIX is back challenging that T cross long. This tells us, okay, I’m not ready to buy the VIX yet because my line in the sand again is this T cross long. So there’s a short there every single day, over and over and over again. So I don’t need to put the T cross short on here and cause any confusion. All I need to do is say, okay, my yearly opening price is at this level. I’m hitting into this T cross long, and yes, I will buy this when I hold above the T cross long and I break through the yearly opening price. I would respectfully submit that that is unlikely but possible. And what’s going on in Europe right now would technically fuel that.
But there’s been a war in Europe, there’s a war in the Middle East, there’s war, war, war, and it’s not really putting much of a dent in any of these global equity markets. But it took an election to send the DAX lower. So again, I don’t think that it’s going to stay down for too, too long. But once again, the VIX —keep a very close eye on it, and there is a buy signal on the VIX , potentially a stronger one. We see our neural index strength, predicted differences, and we’ve got momentum building with a predicted RSI, the 60/40 split, and a nine-period predicted RSI, not a 14, guys. So that’s saying, look, we’ve got momentum on this VIX that’s building. So keep a very, very close eye on that.
Euro versus U.S. Dollar
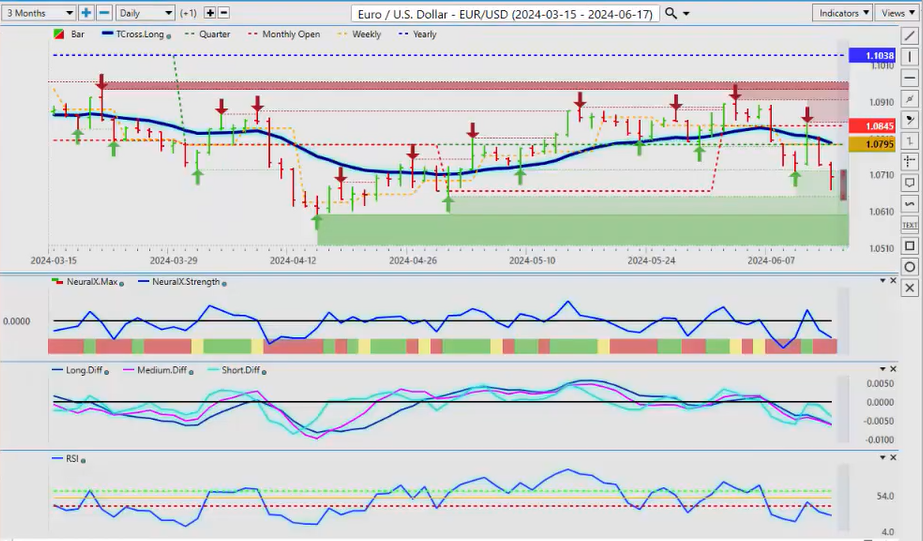
Now, with the Euro going into looking at some of the Forex pairs this week, the Euro is probably going to come under still a little bit of pressure. But you can see that it mirrors the DAX chart. They’re not wanting DAX —European equities, they’re not wanting the Euro . Whenever you have political unrest like this, this is very often the outcome. But again, in my respectful opinion only, we could see a buying opportunity. Our recent low, the verified resistance low, is 1.0602. I believe we will hit that next week. Be careful around this area and watch your MA diff, the pink line over the blue line, very, very closely. Okay? And what we can also do is click on our F8 and bring our support level or our resistance level now. A break of 1.0761 will confirm a reversal. But again, the bar—the Euro is still very bearish on the year at 1.1038. So looking for matching your predicted high of the day to either your T cross long or your long predicted is a very, very effective tool. Because again, if we have a big gap between our predicted high and either one of the two predicted moving averages that are used in this weekly outlook, then you want to wait and let it rise higher because chances are they’ve got to fill a gap here.
U.S. Dollar versus Swiss Franc
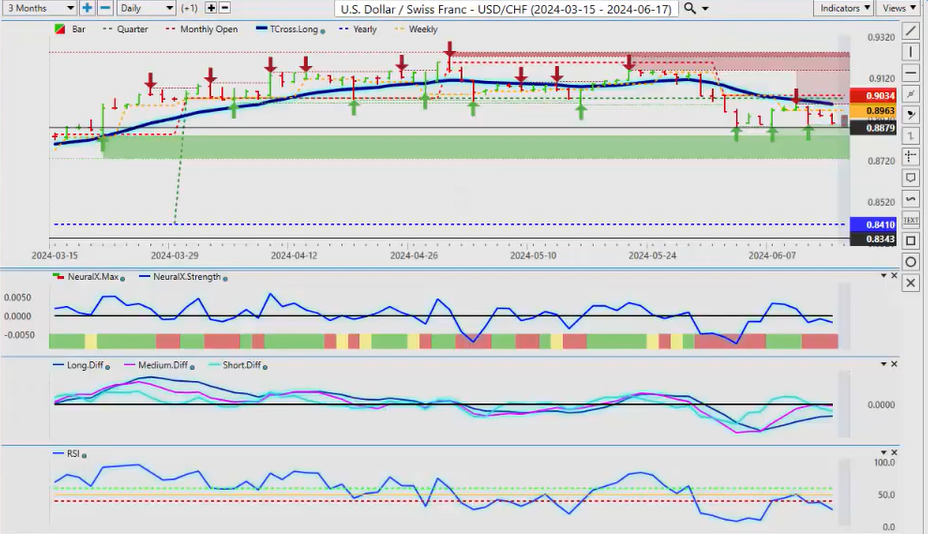
The US Swiss Franc , again, we could see some buyers come in here, but the line that I drew in here from last week remains in play. Multiple verified—you have three verified support lows building here, so a long trade is not unreasonable. But the indicators in VP, number one, again, we’re below our T cross long, that’s coming in at 0.8993. The indicators are negative. We’ve got our medium-term crossover that’s coming up to the zero line, but it’s not breaking through it. We need to get through it. We’ve also got the yearly opening price now coming in at 0.8410. Is that in play this week or this month? Probably not. We do have the Swiss National Bank that’s going to cause some more volatility. We’ll see if they carry that dovish tone like they did last month. But even with that dovish tone last month, the currency still strengthened, guys. Once it sold off, it immediately started gaining strength again. So, again, watch your T cross long. In order to buy this thing, we need a reason to, right? So if we click on our F7, right now we can’t get a clean signal on the crossover, so it requires a bit of patience. But again, if we look at the F8, then we can say, okay, you can see that, excuse me, we broke down on Wednesday below it, we came back, closed right on it on Thursday, and then Friday we sold off again. So this is F8 on your control panel. So again, you can use short, medium, long terms, whatever you want, but these are two that have performed very well in the AI testing with the neural networks. That’s why I use them, to clarify. But again, I have discussed this many, many times in many presentations. But just a reminder, that is the importance of those two predicted moving averages, with multiple examples of showing that over the years of doing this.
British Pound versus U.S. Dollar
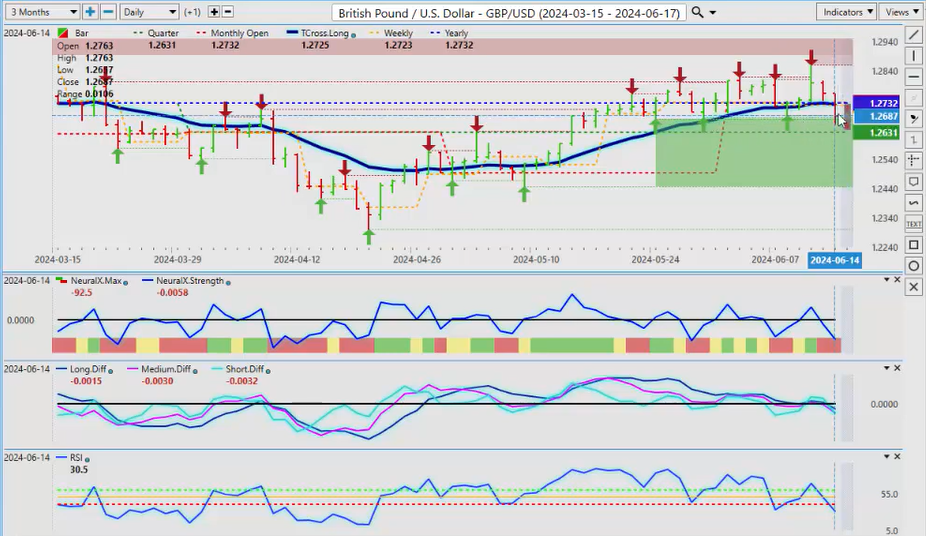
Now, the Pound Dollar for next week, once again, this yearly opening price is a tough nut to crack here. We had a good couple of—well, we’ve had more than a—we’ve had a couple of weeks above it, but it’s just struggling here. And you can see that we had a big push-up on Wednesday, but then on Thursday, we’re in trouble. Now the 1.2631, once again, that was coming in at the quarterly opening. Keep a very close eye on this level next week. We need a breakdown. We’ve got our breakdown below our T cross long, but I believe the market is going to start to continue to digest the FED’s comments. The FED is being challenged all over the place here, right? So again, we’ve got the Bank of England next week. It’s going to be choppy. We know that they’re going to be prepping for rate cuts. So if the FED is the only one that’s not cutting, it’ll be interesting. So I anticipate some bearishness again in the British Pound based on whatever the Bank of England is going to do next week, which I believe they’re going to talk up a cut for August. That’s my view. Maybe I’m wrong, we’ll see. But either way, it’ll carry a bearish tone. The indicators on VP are suggesting momentum is building, but watch 1.2631 very closely. But the immediate pressure on Monday and Tuesday on this pair will likely be to the downside.
U.S. Dollar versus Japanese Yen
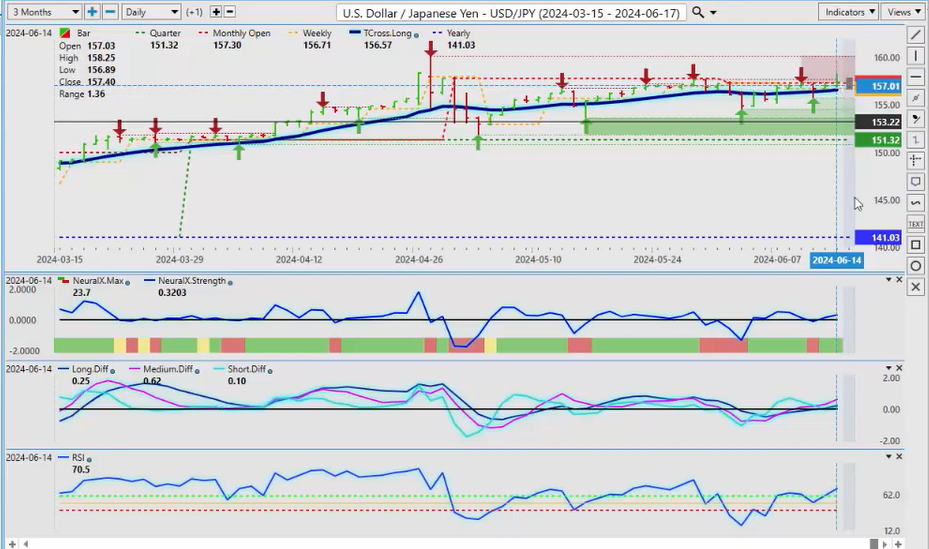
Now, the Dollar Yen , once again, just simply nobody willing to buy the Yen here. And the Bank of Japan did nothing to strengthen the Yen either. So right now, hard to believe that this is still up at the 157 level, but the carry traders are a stubborn group. They’re not letting go of this, and I don’t blame them. There’s a big interest rate differential between the FED and the Bank of Japan, and that, by definition, is the carry trade. Long the Dollar , short borrow money and short the Yen . So probably some more upside. The only thing, again, I’ll warn everybody: if the Bank of Japan pulls a stunt, it will be Sunday night. They are notorious for squeezing as much as they can out of any verbal intervention. So right now, still carries a bearish tone. The VP indicators are very bullish here. But again, you can see that T cross long, and that’s because it’s a week out, guys. I like to give you that this level so you’re not chopped out in Monday, Tuesday, or Thursday trade because you’ve got a Monday, Tuesday reversal, profit-taking on Thursday, and that’s where people are getting stopped out with these short-term indicators. So it’s simply for your benefit. Use it, don’t use it, your call on that. But I’ve got to give you the proper levels. So the T cross long, 156.57, if you’re a buyer of this pair, that’s where you’re buying, guys. And the indicators do support it, but it’s a very high-risk long up here in my respectful opinion only.
U.S. Dollar versus Canadian Dollar
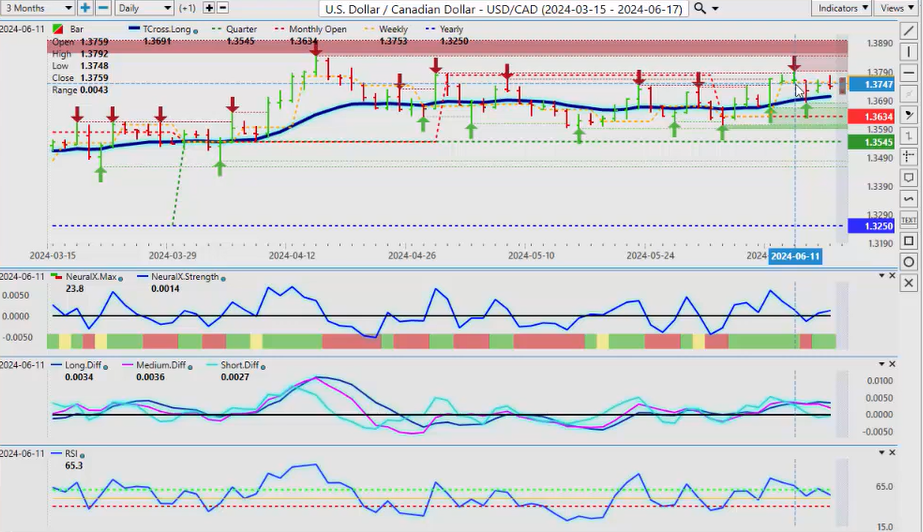
Now, the US Canadian pair , once again, stalling out at the level discussed last week. We’ve got these verified resistance highs up here. Once again, quick note from the fundamental side: there was no confusion from the Bank of Canada or no mincing words from Tiff Macklem. There are going to be many more cuts coming. So if we think back in time to when the FED said he’s not hiking, ‘inflation is transitory,’ which I agree with that statement. It was transitory; it still is transitory as far as I’m concerned. But that’s neither here nor there. The Bank of Canada was way out in front of the FED, and then the FED conceded that the inflation is stronger than he thought. So if the Bank of Canada is cutting and they’re talking about multiple cuts, then that tells me that the FED is behind the curve again. So again, that’s just my opinion, but that’s why I wanted to show the FED fund rates. So you decide from that, guys. That’s not my opinion; that’s the FED funds. They’re pricing in. Are you staying at the same rate? Are you hiking or are you cutting? The only thing on the horizon, guys, is either higher for longer or cutting, where the Bank of Canada is, again, way out in front of the FED. So from that standpoint, I believe we could see some Canadian Dollar strength. We need equities moving higher, and we’ve already confirmed that oil is doing well. It just needs to continue to advance towards or over $80 a barrel. Regardless of all these interest rates, guys, that intermarket correlation of oil and equities will help the Canadian Dollar .
And maybe, just maybe, the market views that the FED is wrong and the Bank of Canada has got this right, and they’re going to move the economy in the right direction. That’s possible. So right now, I wouldn’t rule out shorts up here, but we need a reason to short this. If we are right here, we’ve got one: the MA diff cross, the pink line over the blue. This tells me the medium-term strength or the medium-term trend is weakening against the longer-term trend, right? So if that’s the case, then we’ve got our sell points probably just above 1.38. If we can get back up to 1.38, our most recent high this year, 1.3846, I believe you’ll have sellers camped out between these two verified zones. So keep a very close eye on that.
Australian Dollar versus U.S. Dollar
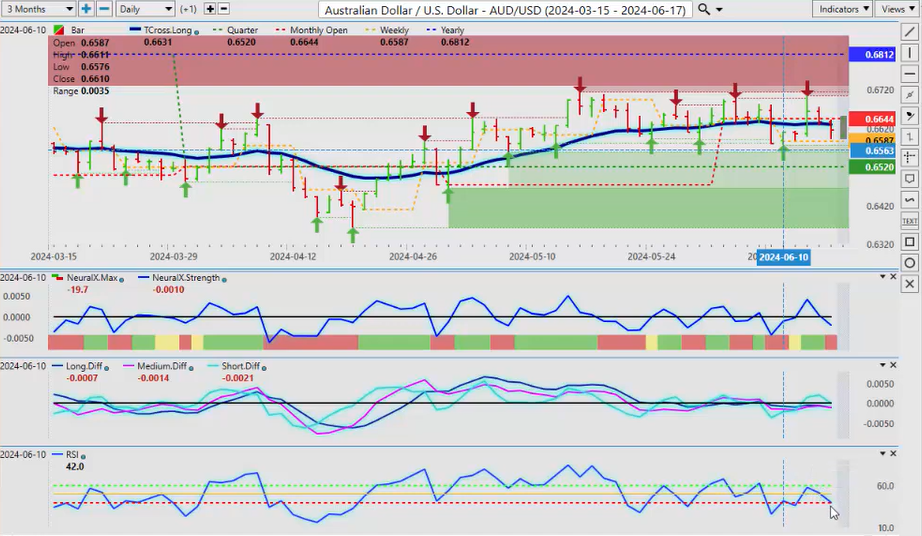
The Aussie and the Kiwi once again, they’re putting up a good battle here, but they’re still firmly below their yearly opening price. We need a sustained break of the T cross long, and I believe ultimately that will be to the upside. So watch your downside levels. The quarterly opening price next week is still bearish indicators, but you’ll notice we’re at 40.3 on the predicted RSI. We don’t have a lot of momentum building to the downside. Any turn in the equity markets to the upside will benefit the Aussie and the Aussie cross pairs. The same thing would be applicable to the Kiwi , and again, when we look at that New Zealand currency right now, it’s putting up a little bit better of a fight than the Aussie is. But they’re both struggling, both indicators are weak. Neither one is showing excessive momentum to the downside.
New Zealand Dollar versus U.S. Dollar
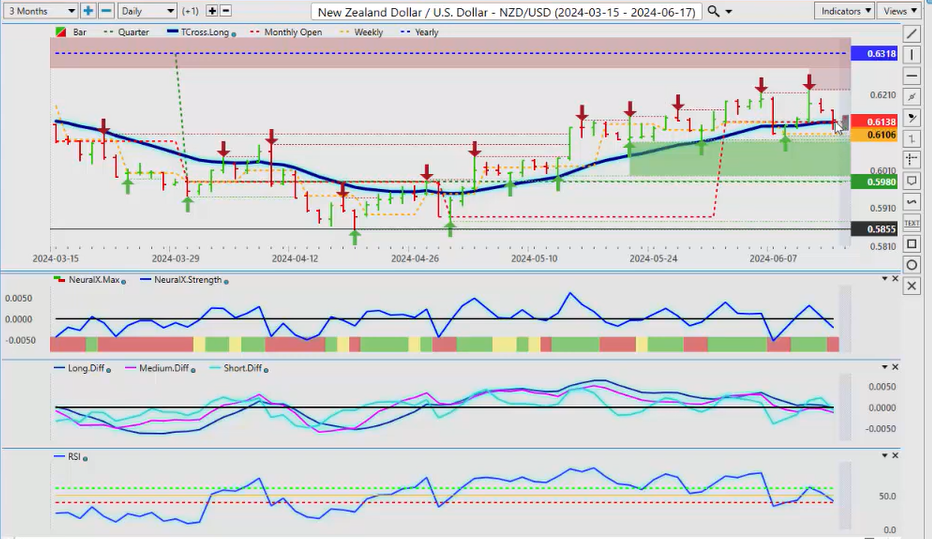
So for the Aussie , the CAD , the New Zealand to really sell off next week, you would have to have a significant crash in the equity markets, in my view. And I don’t think we’re there yet. Again, be very careful next week. We’ve got retail sales, we’ve got some bank announcements— Swiss National Bank , I believe, the Bank of England —so there’s going to be volatility there. But keep an eye on your global stock markets because if they recover, as a Forex trader, then that’s your cue to start buying the Aussie , the Kiwi , and selling dollars.
So with that said, this is the Vantage Point AI Market Outlook for the week of July 17, 2024.