-
View Larger Image
Welcome to the Artificial Intelligence Outlook for Forex trading.
VIDEO TRANSCRIPT
Okay, hello everyone, and welcome back. My name is Greg Firman, and this is the Vantage Point AI Market Outlook for the week of June 3rd, 2024.
U.S. Dollar Index
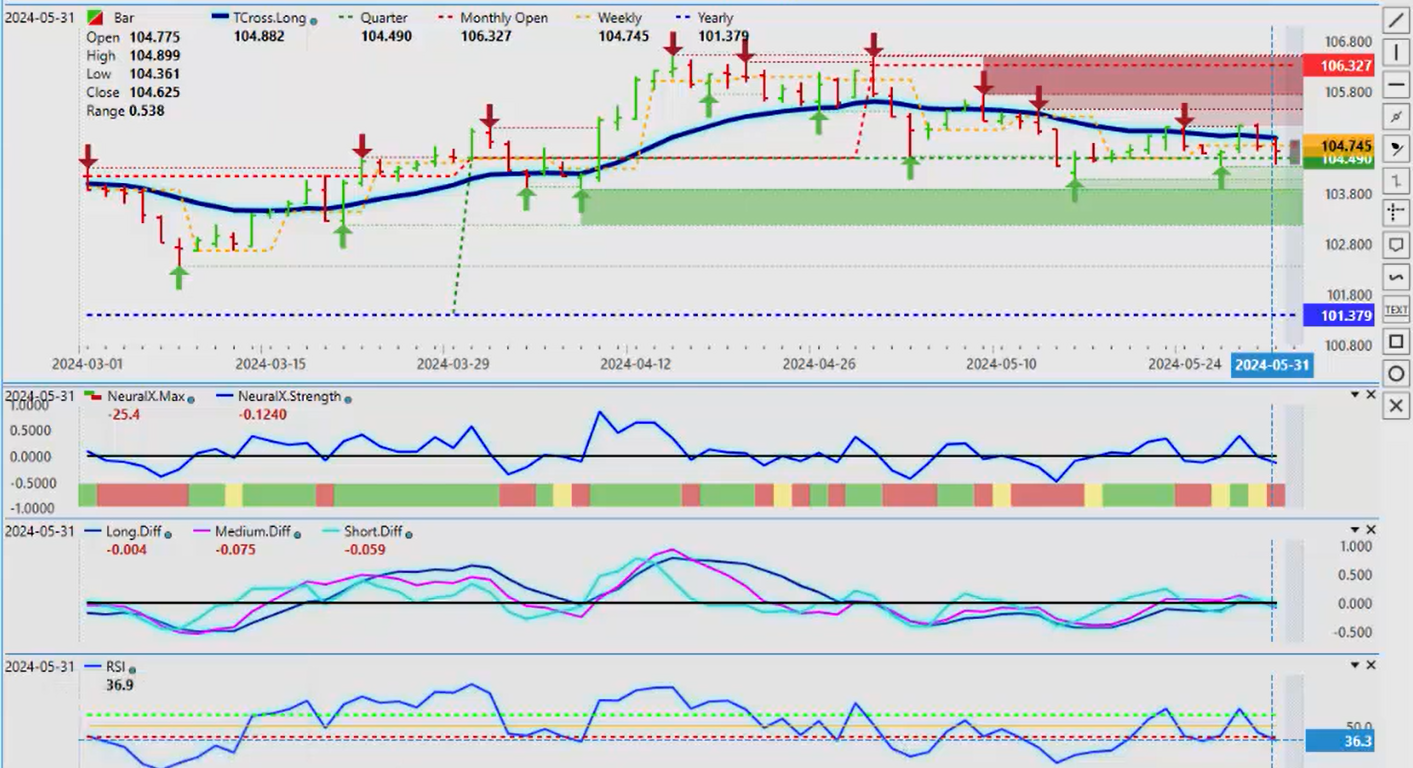
Now, to get started this week, we will again begin with the US Dollar Index where, again, we find ourselves in a very similar area. The market is trapped between the Vantage Point T cross long at 104.88 and our quarterly opening price at 104.49. Now, in most weeks—or in most months, excuse me—the dollar is strong at the very end of the month and then briefly into the first week of the new month prior to the non-farm payroll number, but the Fed’s data is catching up to them. I believe that we are getting closer and closer now to a potential rate cut here. The ECB has signaled that they plan on cutting next month, or this month in June actually. So, when we look closer at this, we can see that the Vantage Point indicators are turning negative on the dollar. A breakdown below our current quarterly opening price at 104.49 appears to be imminent, but I would still respectfully submit that would likely be after we get our payroll number on Friday—a very important number. But my argument there too is that the US payroll numbers , the jobs, have not been good for months. The U6 has continued to climb—7.2, 7.3. So, the U6, the Broad unemployment number, has not been good, and I believe now, with the PCE data , the CPI data , all of this is catching up to the Fed, which will lead to ultimately lead to dollar weakness. So again, we see the predicted RSI at 36.9, which again suggests momentum is building, but our T cross long, we would need to hold below this level in order to confirm that the dollar is getting ready to move lower, probably for the next several weeks if not months because, again, the data is starting to catch up to this Fed. In my respectful opinion, he should have cut long ago and he should have never have hiked to the level of what he did based on the pandemic and all those other outside issues. So again, the indicators, the predicted differences here, are still very neutral. So again, some pending dollar strength—watch for strength on Monday, only to reverse on Tuesday, but again, keep a very close eye on 104.88.
Gold
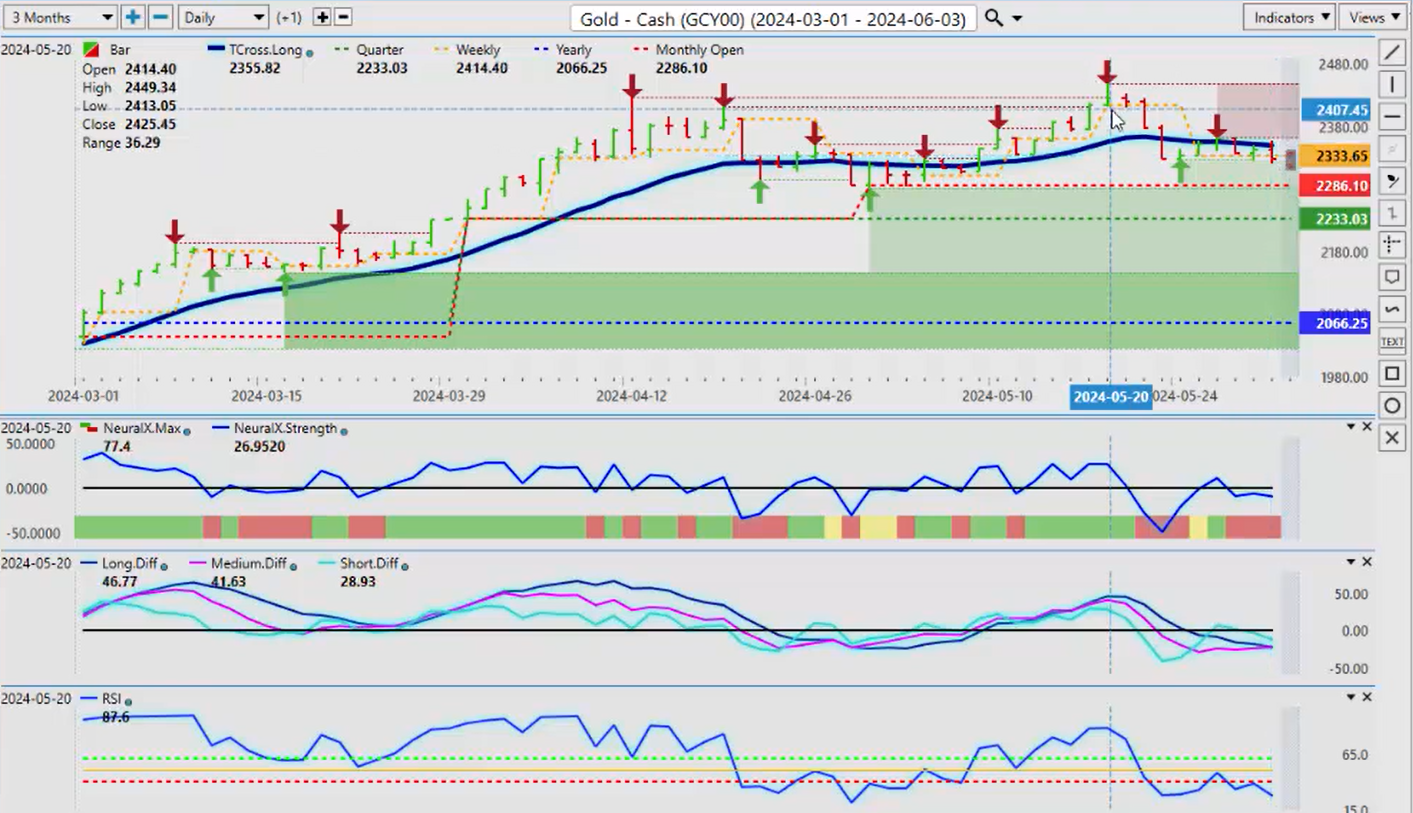
Now, gold contracts again—I gave everybody that wrong warning that in most cases, gold buying dries up mid-end of April into mid-May. So, we’ve got a top in place for now, but again, if the Fed does start to cut, the US moves towards a recession, that should actually favor gold. So when we look at the structural bias of this, our current yearly opening price—very, very important, guys, that we avoid the rolling performance model. We want to know exactly where we are in the calendar year, the quarter, the month, and even the weekly—very, very important levels. So right now, looking at that quarterly opening, we still are holding firmly above 2233. Now, I’ve talked about this level for the last several weeks—that I’m not going to get super bearish on gold until such time we break down below that on the quarter—excuse me—and of course, that has not happened. So again, combining accurate anchor points in our trading is critically important, guys. So right now, we are going to get a new monthly opening price, the VP point and time indicator will update on Monday night with a new monthly opening price, so that will shift the sentiment. So, next week’s Outlook should be very interesting to see because we’ll have the payroll number; we’ll see if gold can recover and break back up. But right now, we do have a—you can see there’s a very big difference in how these indicators are setting up. This pink line, which I’ll talk more about in a minute, is getting ready, in my respectful opinion, to cross back to the upside. So I don’t think we’re going to see a huge selloff here in Gold, but I don’t think we’re going to see a huge upside rally either. I think we’ll we’re going to go sideways for a bit here. Uh, so again, the monthly opening price for June will be very, very important, and I suspect that that’s going to come in right around 2327. So, if we’re holding above that, we’re long; holding below that, we’re short, but the VPT cross long—that’s a big level, guys—2350.
S&P 500 Index
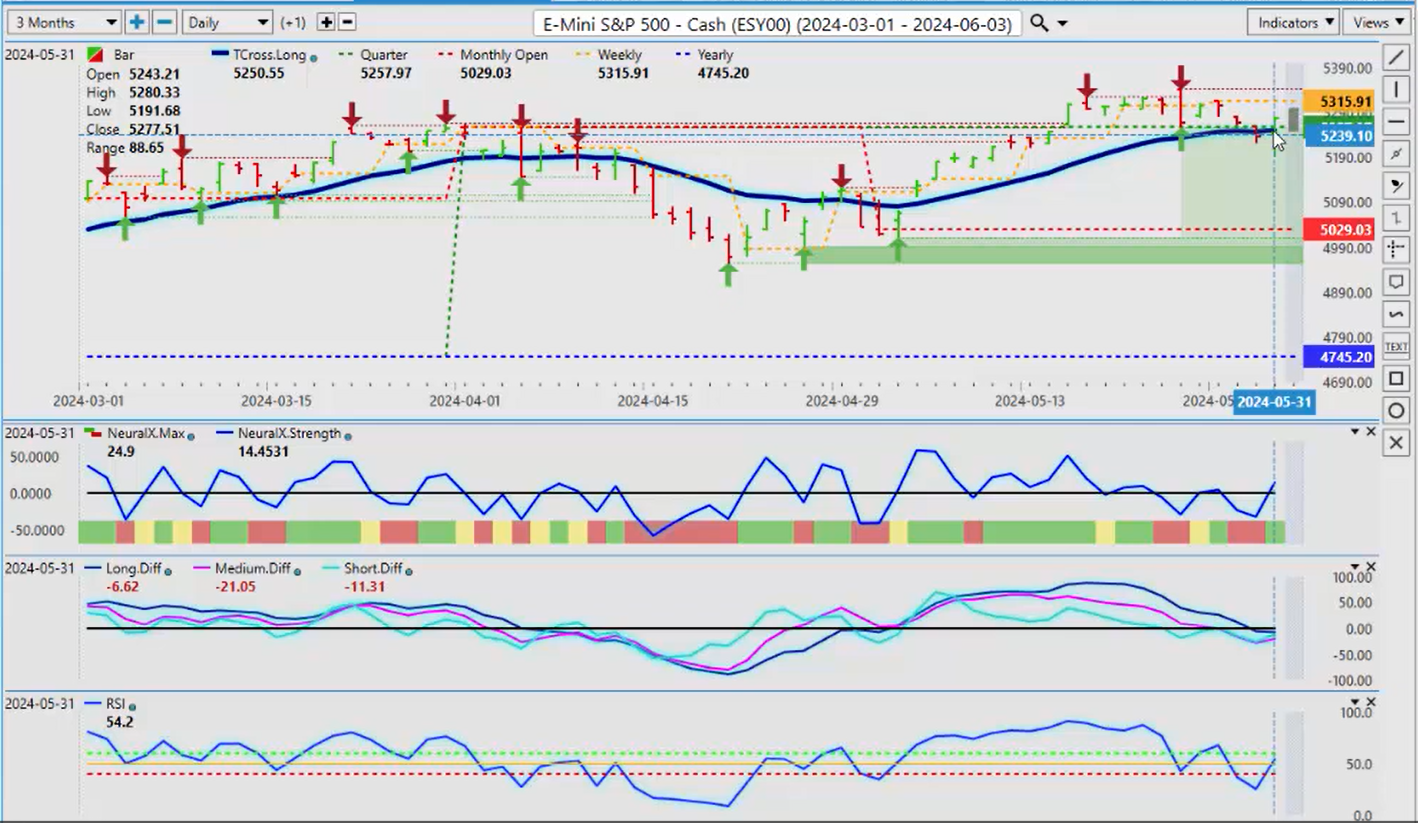
Now, the S&P 500 for next week—it’s been under a little bit of pressure this past week, but it’s also very important that we’re measuring accurate performance. We did not close the week below the T cross long. The dollar is softening. The inverse correlation between the equity markets and the US dollar is still very strong, and I believe that that’s our needle in a haystack to tell us that the dollar is getting ready to move lower. Our indicators are starting to reverse here, but you’ll see a lot of sideways chop ahead of the payroll number next week, but just keep an eye on 5250. As long as we can hold above that, then stock buying still looks pretty good here on the index side.
Light Sweet Crude Oil
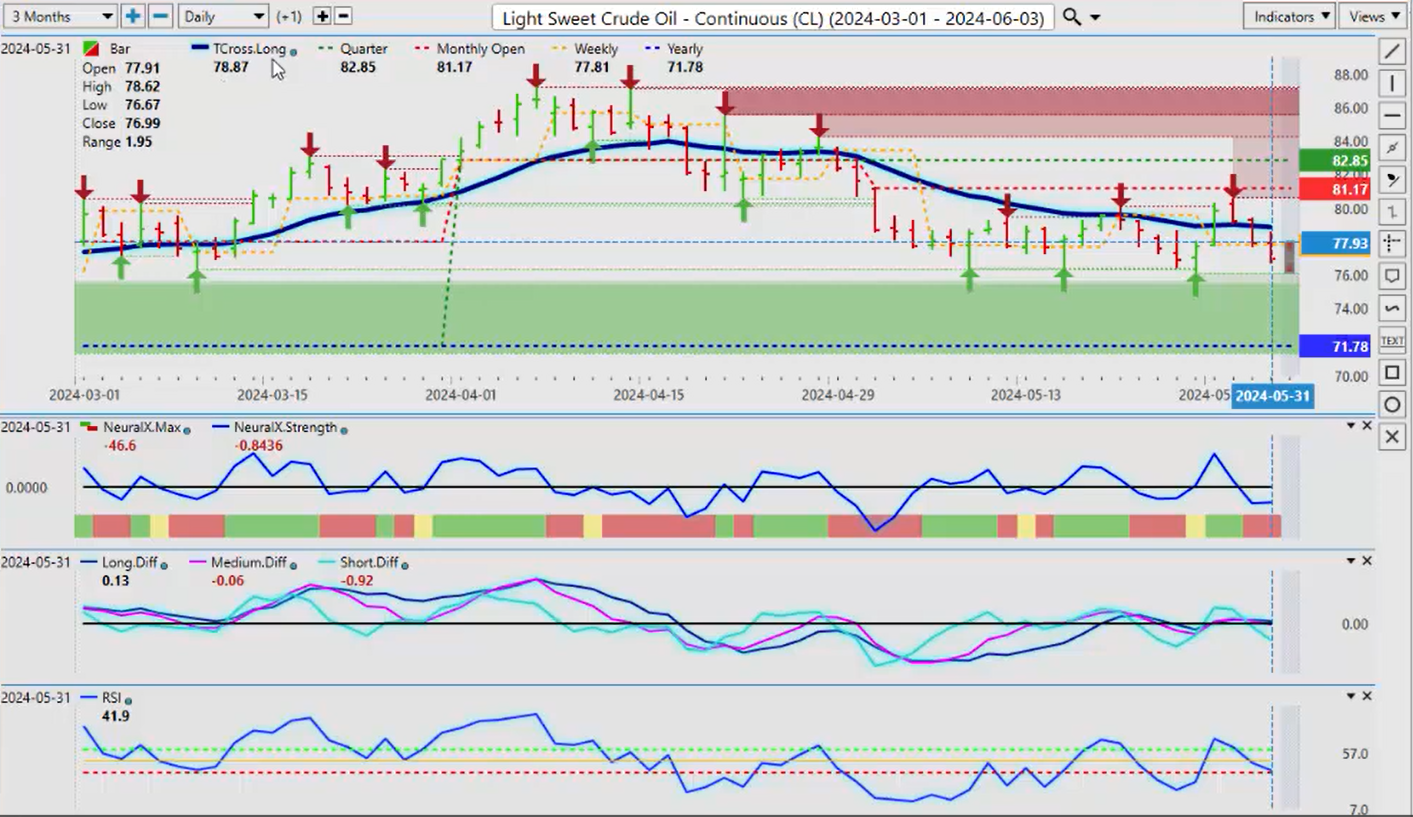
Now, Light Sweet Crude Oil , once again, we’re just struggling to hold above our T cross long, that level is 78.87, but very strong support down in this lower 76 level where I personally have been a buyer. Uh, for what appears to be months, but of course, it hasn’t; it’s been weeks. But we want to make sure we’re looking at that not just as support but also resistance, and you can see that the resistance is building up here. Our quarterly opening at 82.85—I would like to see us get above that by mid to late June as we move into the summer driving season because that’s usually when oil gasoline prices rise. I can’t remember a summer on record where they’ve lowered gas prices for us, uh, so I anticipate this will turn higher. We’ve got some indication of that, but a very mixed bag here ahead of the payroll number and the Fed. You can see that the predicted RSI is pointing down, but we’re not breaking down below 40. The predicted differences are sideways but they’re still positive above the zero line. Longs, in my respectful opinion, are still in play while we remain above the current yearly opening price. It’s very very important that I point that out, guys, because again, sometimes with this rolling performance model, we get confused. Analysts will say, several have said, well, oil is bearish on the year, but that’s just not factual, guys. Oil has been basically positive the entire calendar year—almost. There’s where we started the current calendar year, and you can see we’re still firmly above that 71.78, so as long as that’s holding, then longs still remain in play.
DAX
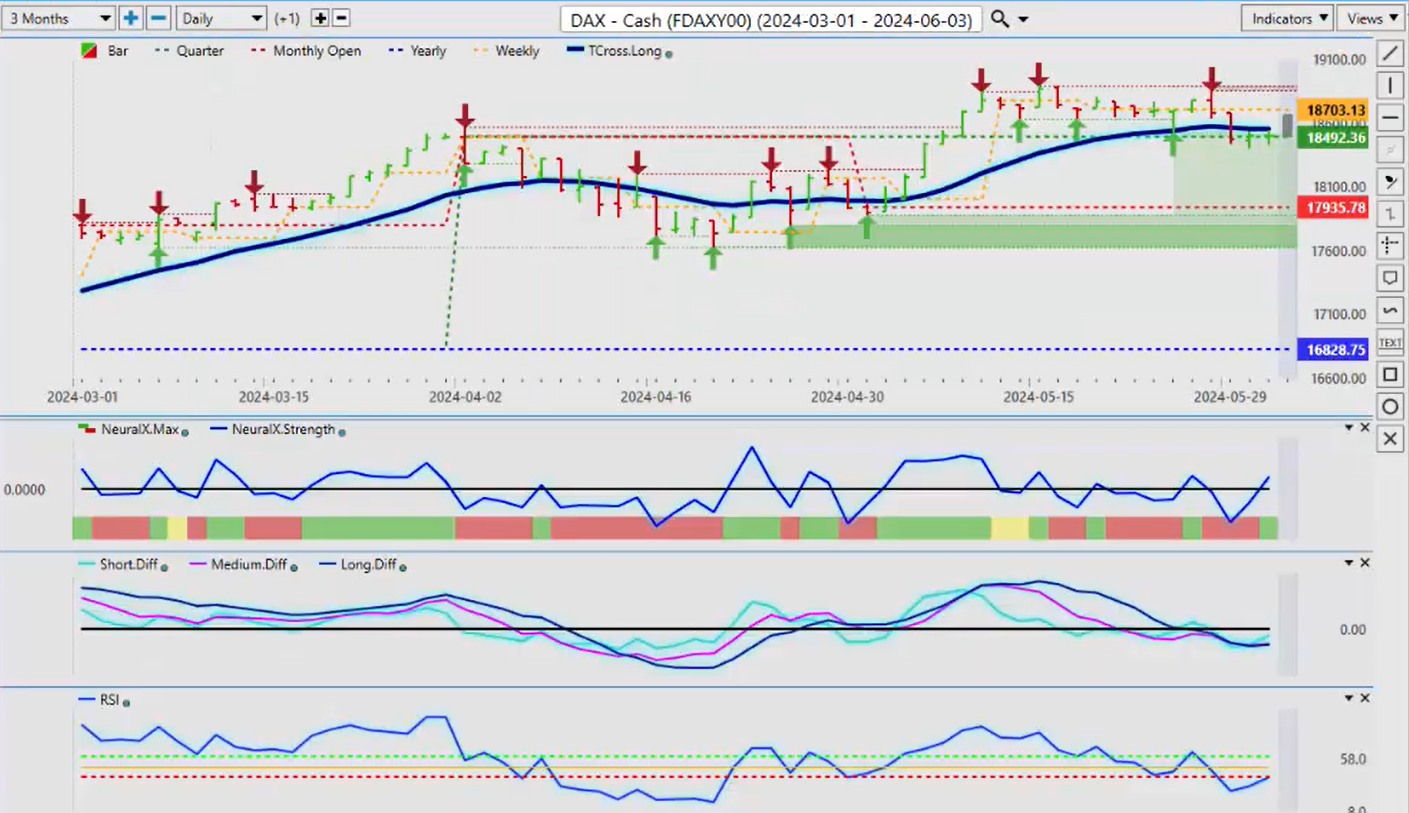
Now, when we look at the European equity markets, now that’s definitely worth a look here, as I talked about last week. The correlation, you can see, is slipping, but I believe now that the ECB has signaled that they intend to cut in June, July, then that should boost the DAX . So, if the Euro currency softens up a bit, then that should help the European equity markets. But the other thing we want to make sure of is that we’re checking that VIX , but for the DAX, we want to get back up above 18,553 to confirm that we are moving higher. The indicators are looking pretty good here; a lot of them are pointing towards a turn. I really like the neural index strength, the position of it, and again, that fundamental of the ECB cutting should put money into the European equity markets, but they could go into the Euro also on dollar weakness. But for now, we just need to clear that level.
Volatility Index ($VIX)
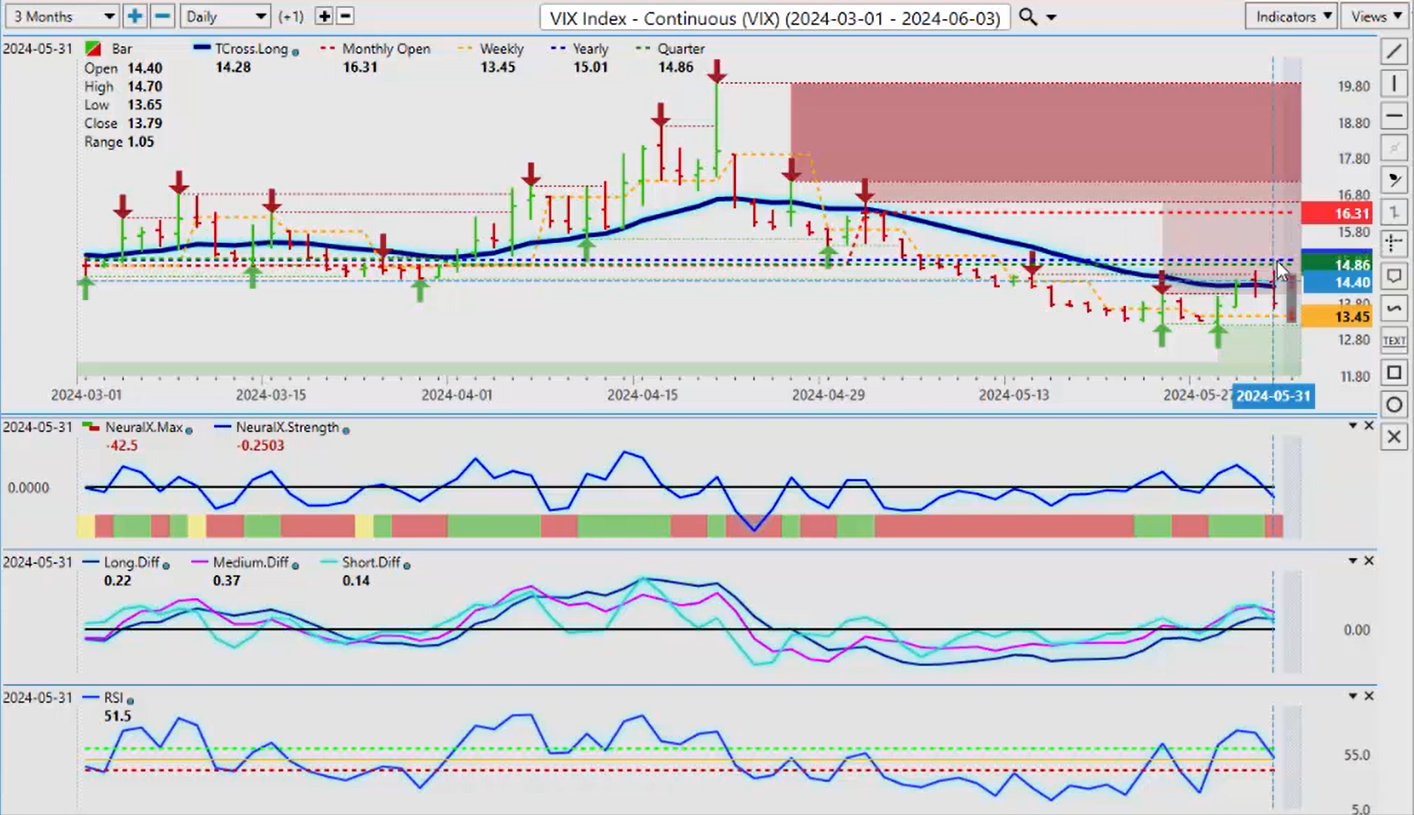
So, when we look at something like the VIX , then you can see that the VIX is again—we want to make sure we’re using the current yearly opening price in our stock commodity futures trading. I’ll talk about a stock next here, but when we look at the VIX, you can see that we’re still struggling, and it appears that we’ve got another sell signal forming. We are unable to get back above the current yearly opening price, that price is coming in at 15.01. You can see that we broke down below it right there on May the 6th, and we haven’t recovered since. So again, if we can hold below the current yearly opening price, then that tells us, okay, I think we’ve got the green light to buy the DAX, the S&P 500 , and some individual stocks also. But the key thing here is looking at the core indicators, and we don’t have a lot of momentum building to the downside, but there is a trade there.
First Solar
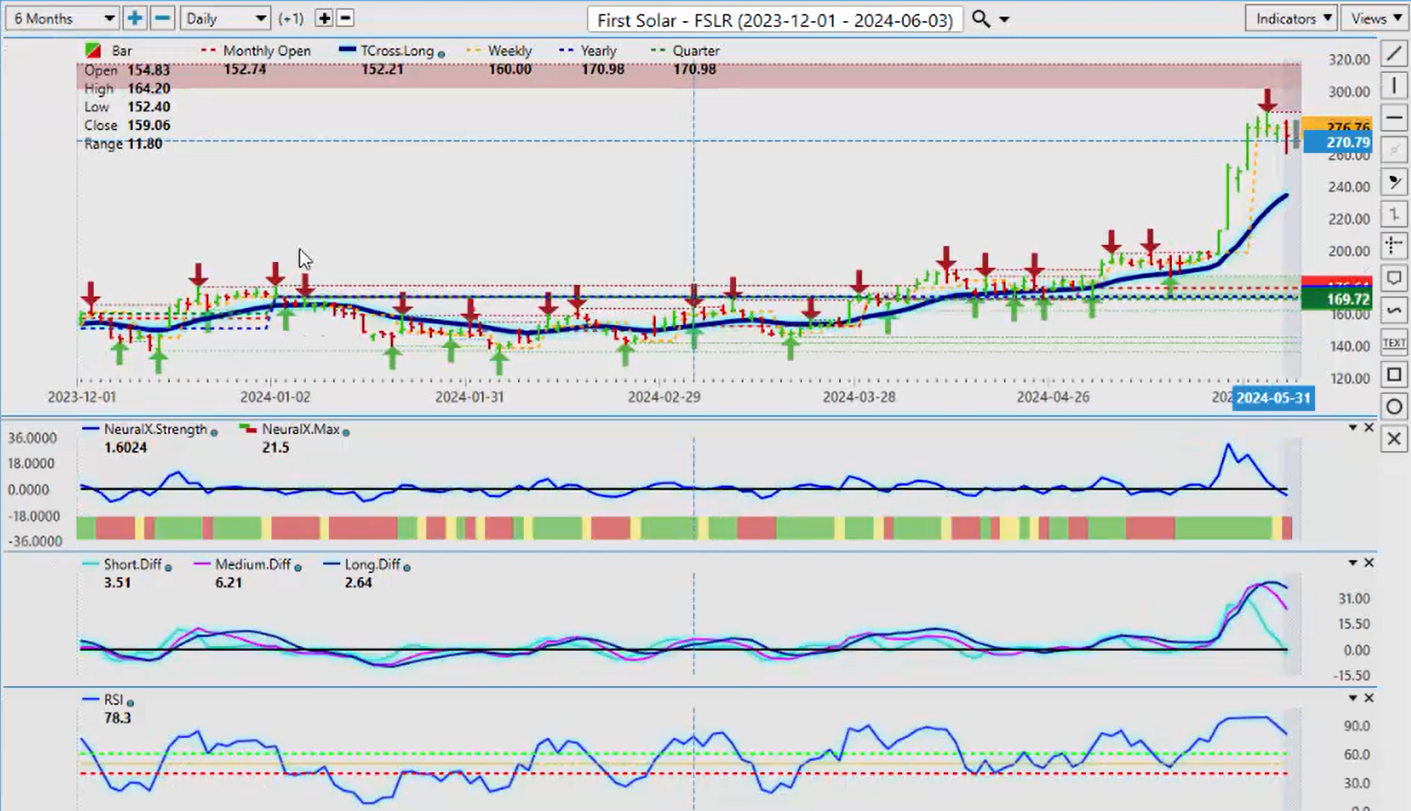
So, if we take the same methodology of the current yearly opening prices, and it’s very important, and we use a single predicted moving average, something like First Solar , we can assess here that this stock has actually been negative, uh, the entire most of the calendar year. However, when it crossed above the yearly opening price right around mid-April, April the 5th, we closed above the current yearly opening price, but you can see that we had multiple retracements back to the current yearly opening price, and we accelerated from that level. So if you moved your levels to a random 5 days, a random 30 days, a random 365 days, then you wouldn’t see this level, and that’s exactly basically that is the exact level on multiple occasions we came off.
So again, when we look at it with the medium-term crossover, you can see we’ve got a crossover to the downside, back to the upside, back to the downside, back to—there’s a lot of chop in here, but if you use proper anchor points with the current yearly opening price, it basically unmuddies up the waters here. So, you have a clear anchor point to get into your positions or confirm that, okay, look, the other Vantage Point indicators are, you can see the predicted RSI running along the 40 level, we don’t have any strong downward momentum, but we have a lot of chop in the crossovers. But again, if you’re using that single predicted moving average of the TR cross long or the F9, then we can use that level as a strong pivot level for this move up. But when we look at it now, we can make the argument that, look, we’ve got a considerable distance between where the market is now and the T cross long, and we have a classic contrarian signal. This is what most retail traders do, guys—they buy high, and they sell low, and they get caught after the move. I would suspect this is likely earnings cause this because there have been strong earnings out of First Solar, but now we’re starting to flip, and you can see so they’ll try and jump in long up here, and they immediately get into trouble here. So, we let this retrace a bit here. So, if we click on our F8, you can see that the first retracement area is our long predicted at 266, but we still have further downside to go to reach the Vantage Point T cross long, and the indicators are warning that we are going to have a mean revision or a natural retracement that has absolutely nothing to do with Fibonacci or any of this stuff. The further we move away from these predicted moving averages, the less attractive the trade is to us.
Euro versus U.S. Dollar
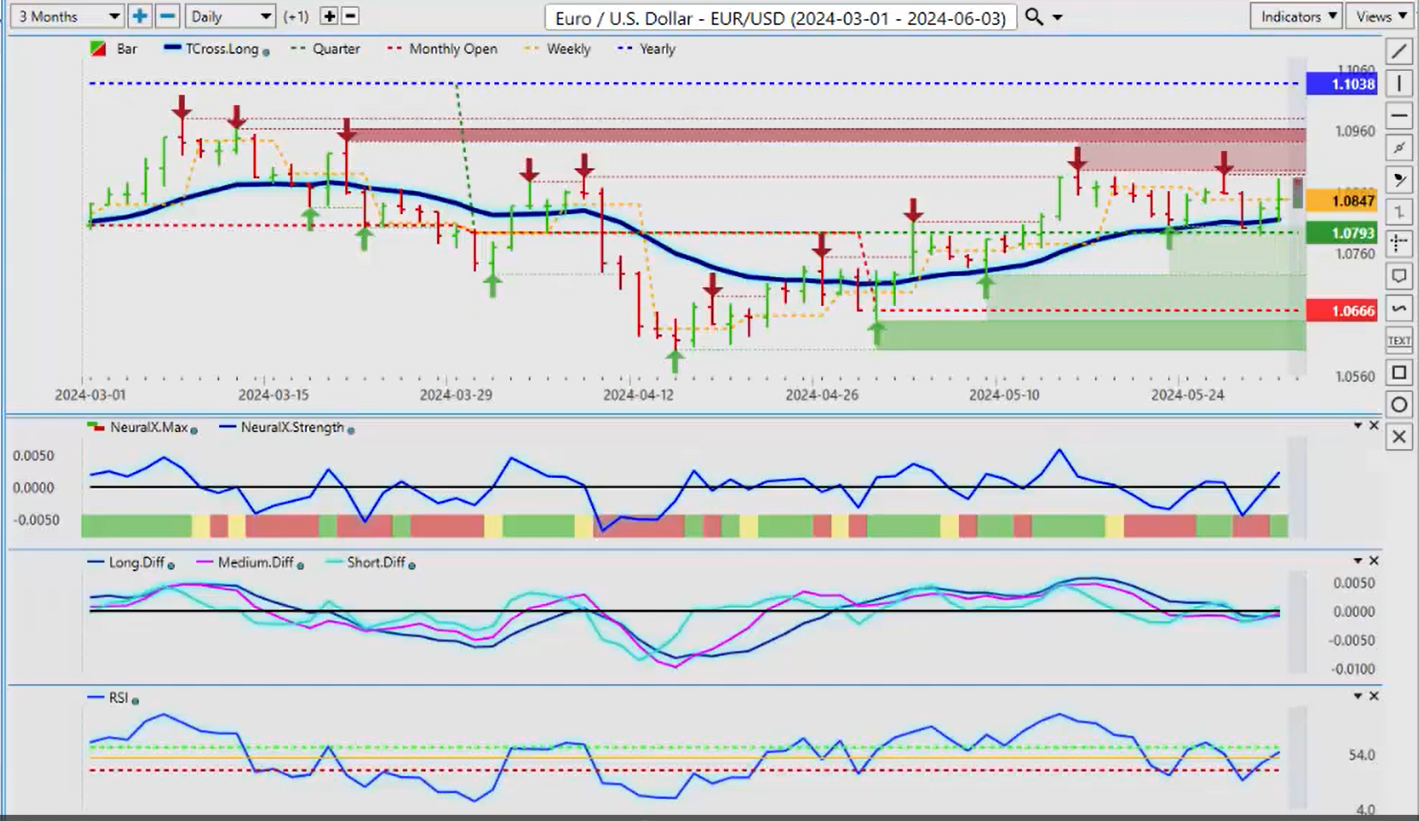
Now looking at the main markets, we’ll move over into our Forex. Now again, with the Euro, the Euro is really struggling along to get any kind of upward momentum, but this past week, you can see that we’re running right along that T cross long, but this is not a favorable structure for longs or shorts in my respectful opinion. We’re both below the yearly opening price, and we’ve been negative on the Euro the entire calendar year. Now, they’ve announced they are going to cut, that should put a little bit of pressure on the Euro, but I question how much because I believe the Fed will also have to do this; he can’t hide from these numbers for much longer. Uh, they’ve spun his little web for many, many months now with the hikes, and he originally said there was going to be five cuts this year, now he doesn’t know how many.
I’ve seen this movie before, guys, but I know how it’s going to end. It’s going to end with cuts. So, yes, the Euro could lose some ground initially, but I believe they’ll also be able to make it back. So right now, for next week, the Euro will be very choppy with that payroll number. Our T cross long, 1.0816, that is our key level. We will also have a reset on our monthly opening price, and that’s going to be coming in at about 1.0882 for the new June monthly opening price. So again, that is going to be a fairly big level here for us, guys. We’ll look closer at it next week, but for now, keep a close eye on that T cross long.
U.S. Dollar versus Swiss Franc
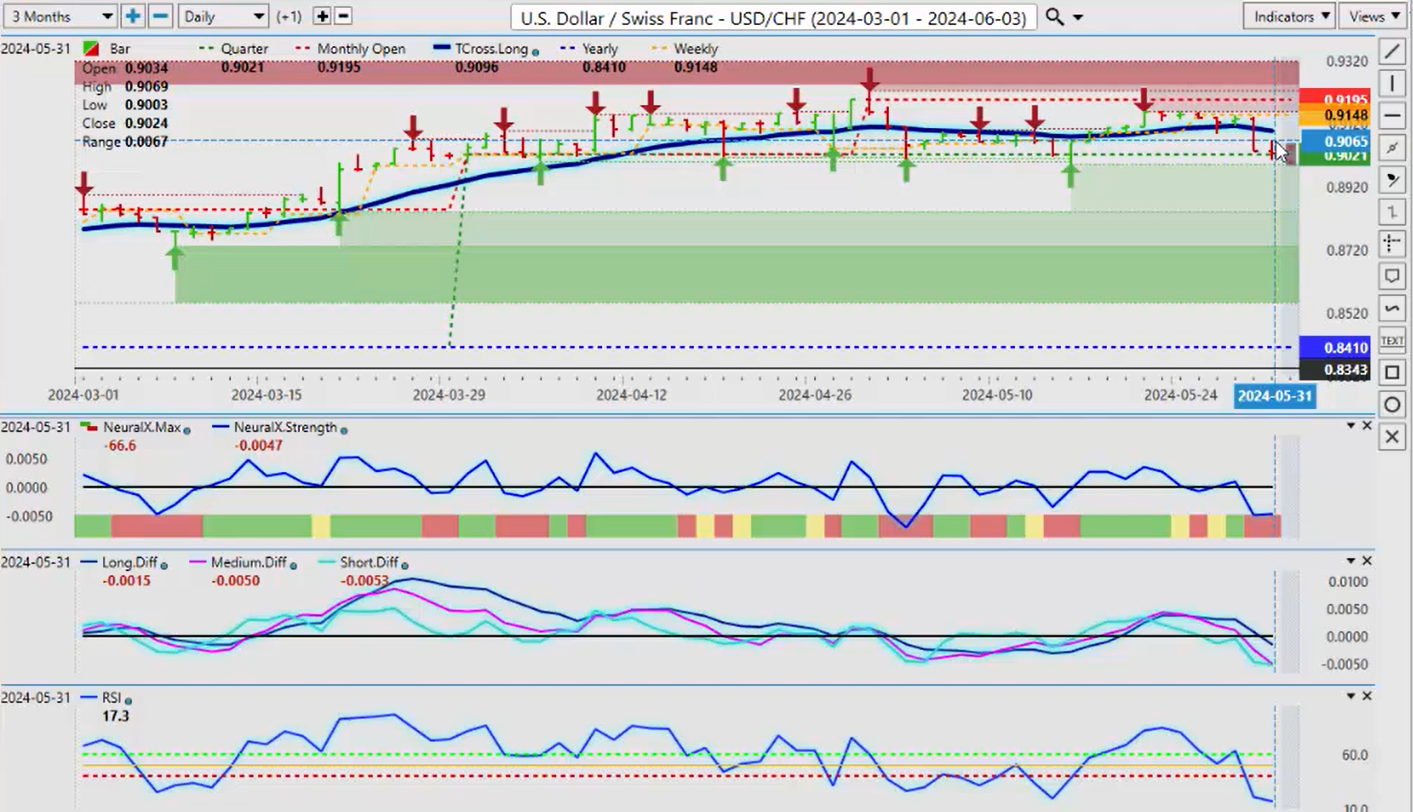
Now, the Swiss Franc—GDP surprisingly came out much stronger, so the GDP in Switzerland, that is, not the US. That immediately triggered the Swiss Franc strength right across the board—the cross pairs, everything. So we’re just kind of hanging here, right around this quarterly opening price at 0.9021. I don’t think we’re just going to break down below this. I think we’re going to have to wait until after the payroll number. We’ll see where we’re at; the yearly opening price is 0.8410. So, pending dollar weakness, I think, is a high probability trade coming up, and this pair has a considerable amount of room to move. Always remember, on a full contract, a 1 cent move is $1,000 plus or minus. So if we’re up at 0.9025 and we have a downside potential target of 0.8410, that’s a substantial trade. But even on a smaller trade, that’s still some money to be made here, but we need to get down and break down and hold below 0.9021. The Vantage Point T cross long, 0.9096, firmly below that—that is our retracement area. You can see that the weekly levels, the monthly levels are stacking up, but this one will be very interesting when we get our new monthly opening price from VP on Monday night. That’s going to be right around 0.9024, and that’s sitting right on this level right here. So, it’ll be quite interesting to see which way this pair goes, but again, the predicted differences are all pointing down, so I think a retracement back towards the 0.9096 area is a reasonable area to look at resetting those shorts.
British Pound versus U.S. Dollar
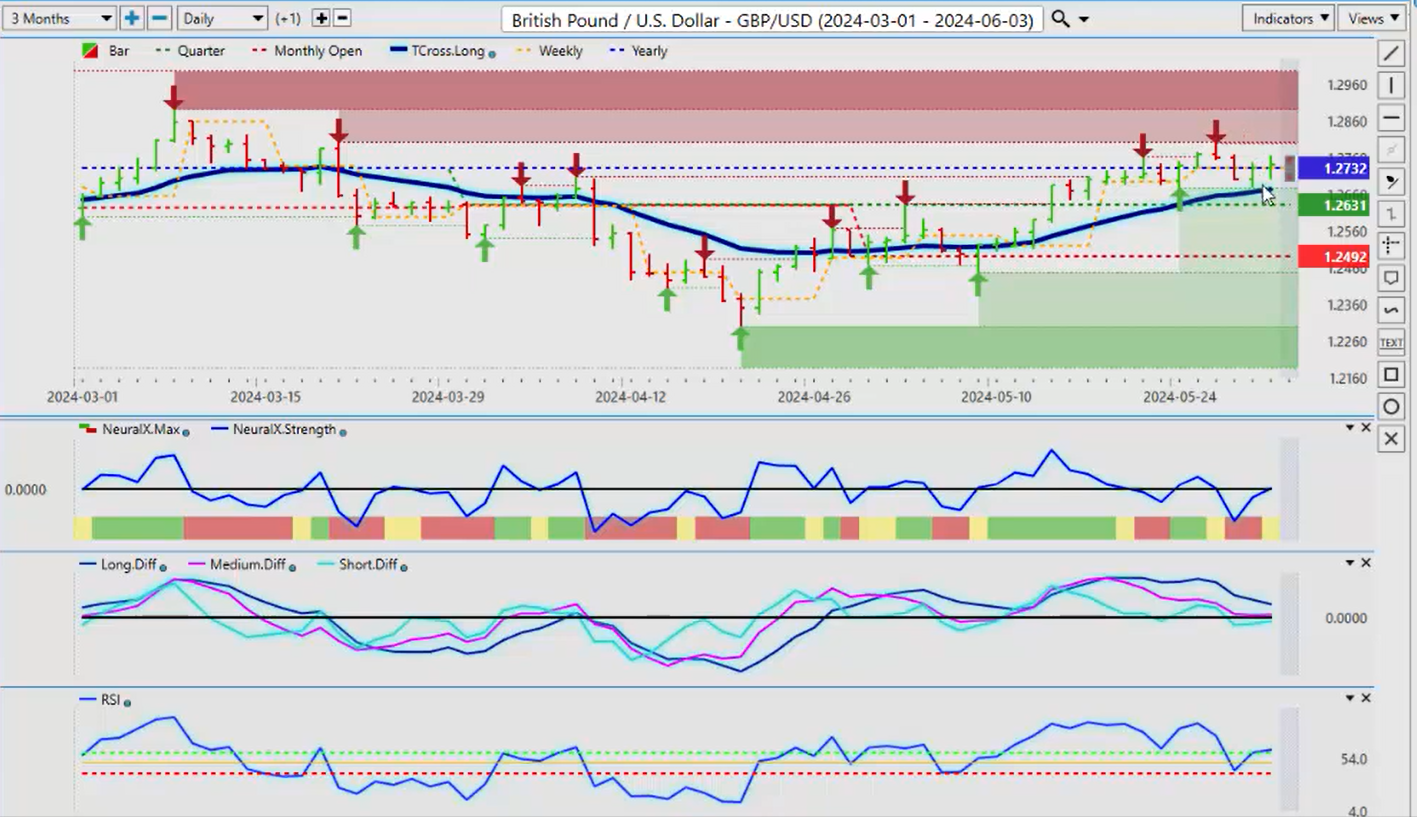
The Pound-Dollar, a pretty good winner last week. Again, we’re using that T cross long, but once again, guys, just like First Solar, like what I showed you, we need proper anchor points, not a rolling performance model of what it did in the last 5 days, or 30, or 90, or 365. Where are we in the calendar year, 2024? The Pound-Dollar continues to struggle with 1.2732. We’ve closed the week just above it, again at 1.2742, but we’ve got to break free out of this area. Right now, our T cross long, 1.2674—that’s a good area for potential longs, but just be careful of this area, 1.2732. I believe the only thing that can push this lower is either the Bank of England or the Fed—Fed saying that he’s not cutting, he’s going to hike again. I don’t know where he’ll get the data from that. I don’t believe he will say that. I believe that the Bank of England also will cut, probably towards August, September. So again, it’s kind of a standoff with these central banks, but just the main thing is know your levels.
So if we look at the 60/40 split on the predicted RSI, you can see we came down, hit the 40 level at 42.6, and that, when it bounced out of there, told us that look, we don’t have any momentum. The very next day, we hit the T cross long to the number, and then rebound substantially off of that. So again, we’ve just got to push through 1.2732, and we’ve got the green light to start buying, but that probably won’t be for about another 7 to 10 days.
U.S. Dollar versus Japanese Yen
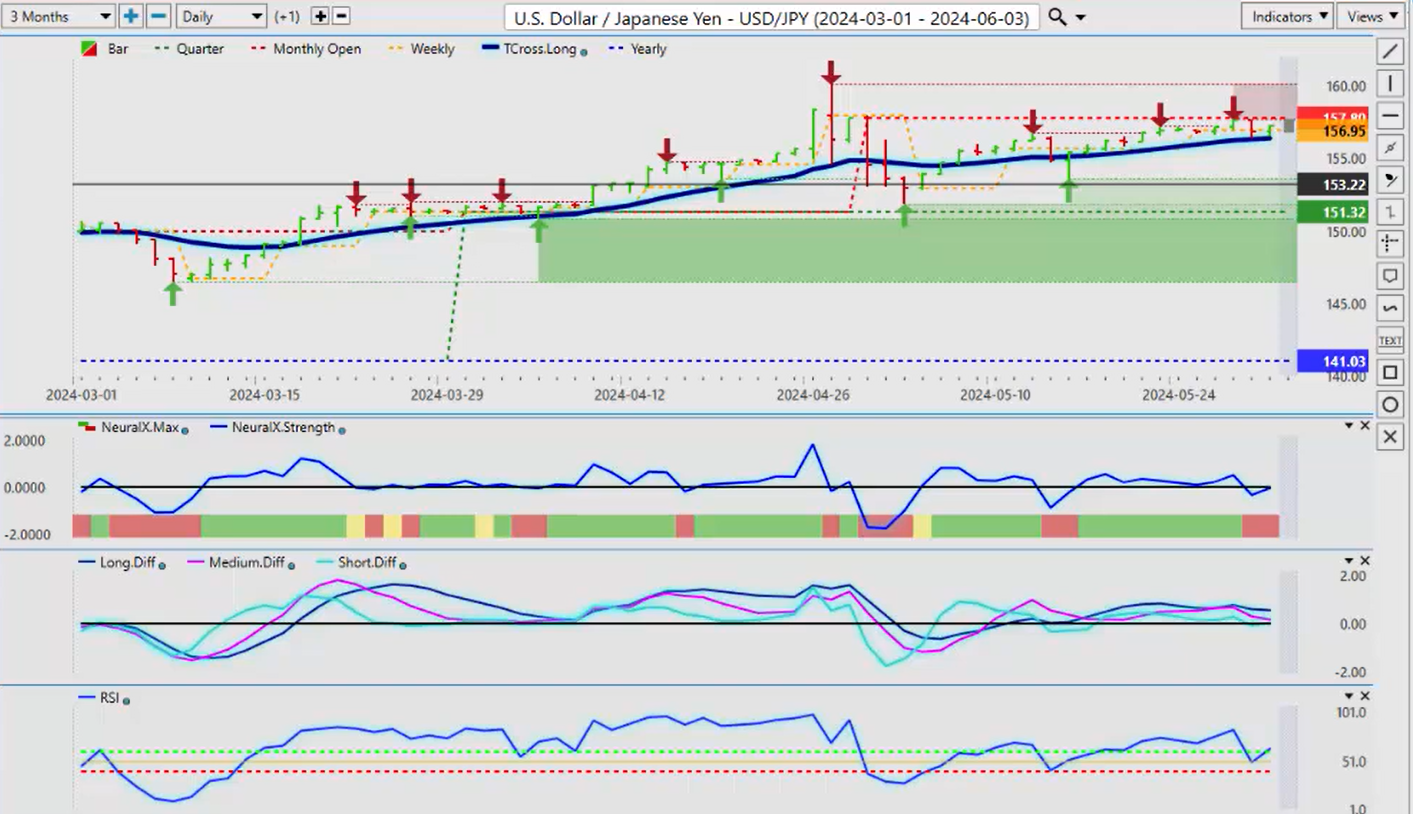
Now, the Dollar-Yen—once again, I strongly advise to limit trade on this pair. The interest rate differential is going to change between the Bank of Japan and the Federal Reserves. So if that’s the case, I think the only rabbit the Bank of Japan can pull out of their particular hat here is maybe another rate hike, and the Fed talks about cutting. So you can see, for the entire month, using the current monthly opening price of May, we simply we’ve been negative the entire month. So all I’m looking for here is a breakdown below the Tcross long at 156.40, and that should give us the green light for shorts, but it’s still a carry trade, guys. So we need a more aggressive Fed cutting more than just a quarter basis point, once or twice. We need him to pick that up a little bit, and that should bring some sellers out for this particular pair. Our predicted differences are pointing down, but we have no downside momentum here. In actual fact, the upside momentum is starting to build on this, and I believe that that’s normal for this time of the month at the beginning of the month, where people are required to buy dollars. They’re not necessarily want to; they have to buy dollars to fund the governments, the pensions, the unfunded liabilities—a lot of different reasons for it. But again, once I think that’s passed, you do have a short trade here.
U.S. Dollar versus Canadian Dollar
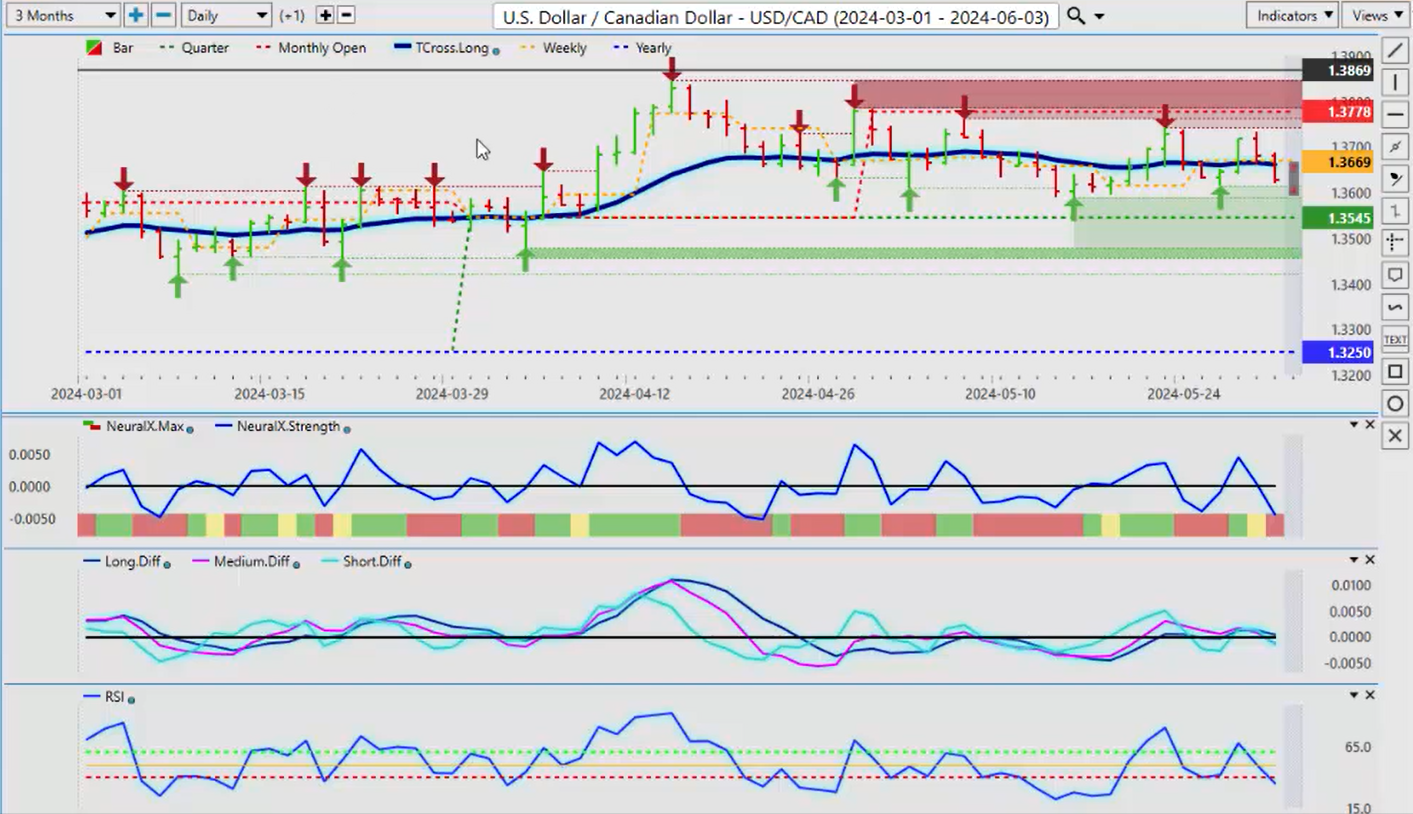
Now, the US-Canadian pair—I expect some Canadian dollar strength next week. I’m looking for equities to rebound, oil to rebound, as long as those two things happen, the main intermarket correlations, then we’re going to get a push lower down on this pair. The yearly opening price, 1.3250, I can say with a degree of certainty that this calendar year we are going to hit that level at some point, but again, I believe the Bank of Canada is going to cut, and as early as next week, I believe the Bank of Canada is out, so that would initially hurt the Canadian dollar, but that would be short-term. Okay, so we’ll monitor things, but right now, our T cross long—that is our critical level, guys—1.3663, but there is significant resistance above 1.37 also. Our current most recent high here, our most recent verified high, 1.3744. I would play the short side of this pair until such time that level breaks, if it breaks at all. But we’re going to need more than the Bank of Canada cutting here, guys. We’re going to need oil contracts way down, and we’re going to have to have a sell-off in the equity markets to weaken the Canadian dollar.
Australian Dollar versus U.S. Dollar
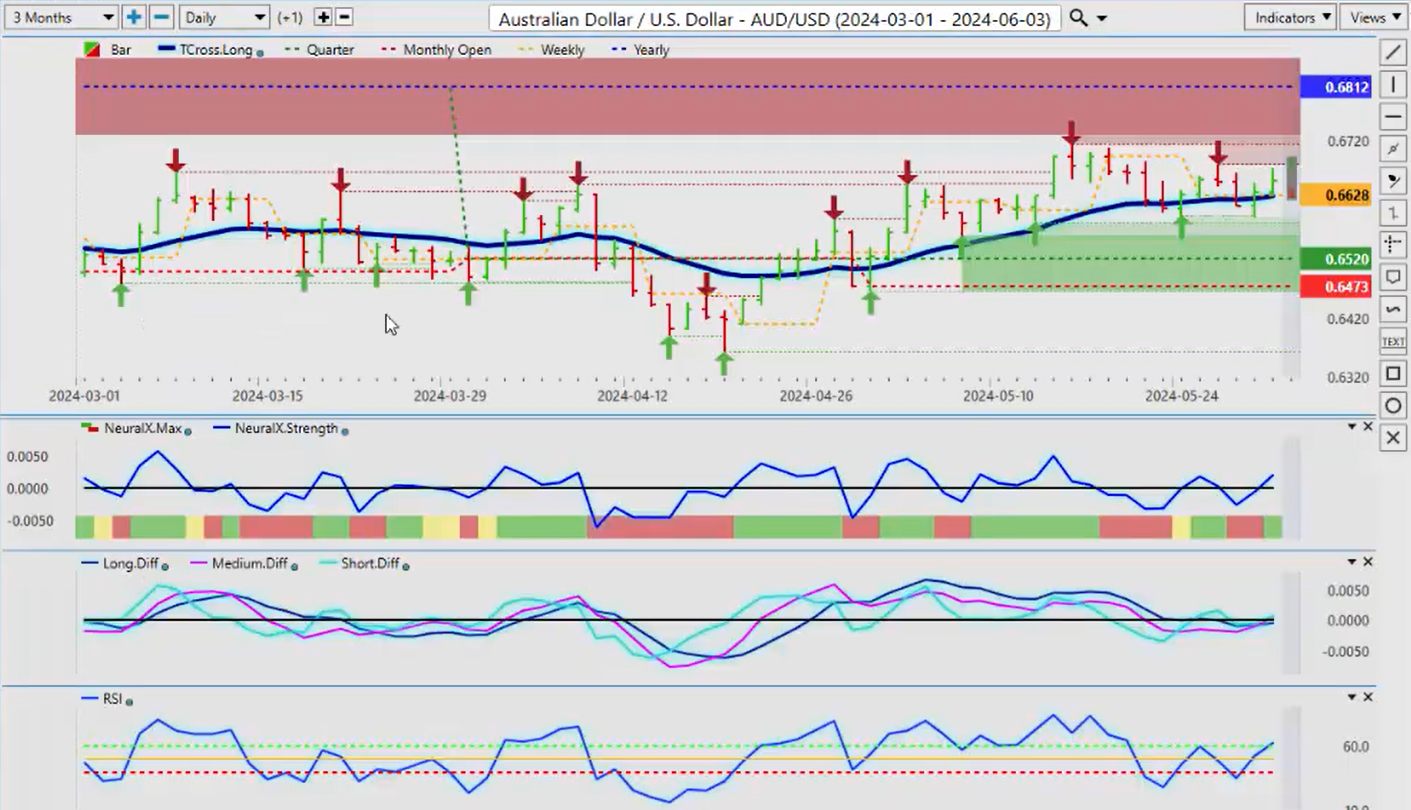
The same thing will apply to the Aussie and the Kiwi. Right now, they’re sitting right on their T cross long—the Aussie, 0.6626. Uh, it needs to hold, is all I can tell you. If this holds, then we go higher. Ultimately, I believe this pair goes higher into year-end, once we start getting into cuts. And I don’t think there is basically the Kiwi is almost the ex-Aussie. Uh, the New Zealand-US is virtually the same trade. Uh, we wouldn’t buy one and sell the other; we would either buy them both or sell them both or just do one or the other, right? Uh, I would slightly favor the Aussie over the Kiwi, and that is because of this pair—the Aussie-New Zealand. It’s on the rebound, another strong illustration of why we need proper anchor points, not random, what did it do the last five days. Well, guys, how relevant is the last five days? But the current calendar year opening price, that tells us whether we’re positive or negative on the year, and there is no other support here, guys. Why this thing rebounded? Because it’s getting dangerously close to the current yearly opening price.
New Zealand Dollar versus U.S. Dollar
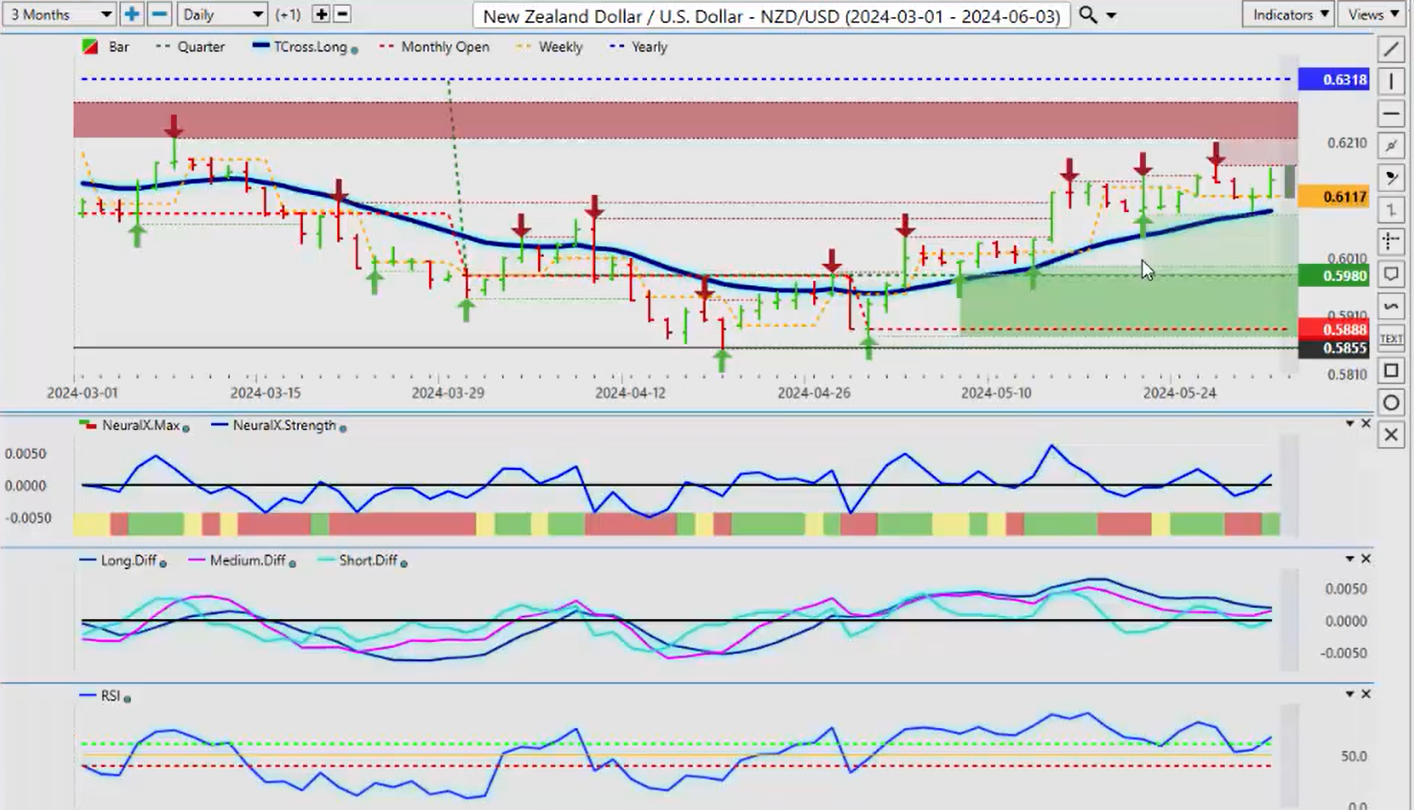
You can see that we hit a low of 1.0108, and the buyers like me stepped in and started to buy this. So if this continues, this pair continues to advance to the upside, that will favor the Aussie against the Kiwi. Now, the New Zealand-US can go up also, but there would be a stronger push from Aussie-US versus New Zealand-US. So, with that said, this is the Vantage Point AI Market Outlook for the week of June the 3, 2024.