-
View Larger Image
Welcome to the Artificial Intelligence Outlook for Forex trading.
VIDEO TRANSCRIPT
Okay, hello everyone, and welcome back. My name is Greg Firman, and this is the VantagePoint AI Market Outlook for the week of May 27, 2024.
U.S. Dollar Index
Now, to get started this week, again we will begin where we usually do with the US dollar Index. Now, a very interesting trade setup here: we basically find ourselves exactly where we were last week. Again, using these critical levels of support and resistance from Vantage Point, we’ve got our quarterly opening price, which was discussed last week at about 104.49 , and we have our T cross long that’s moved down slightly to 104.99 from about 105.15 last week. But again, this area is being challenged here. We’ve failed multiple times, and again, when we’re using the T cross long by itself, we get a very, very clear picture of where our breakout point is.
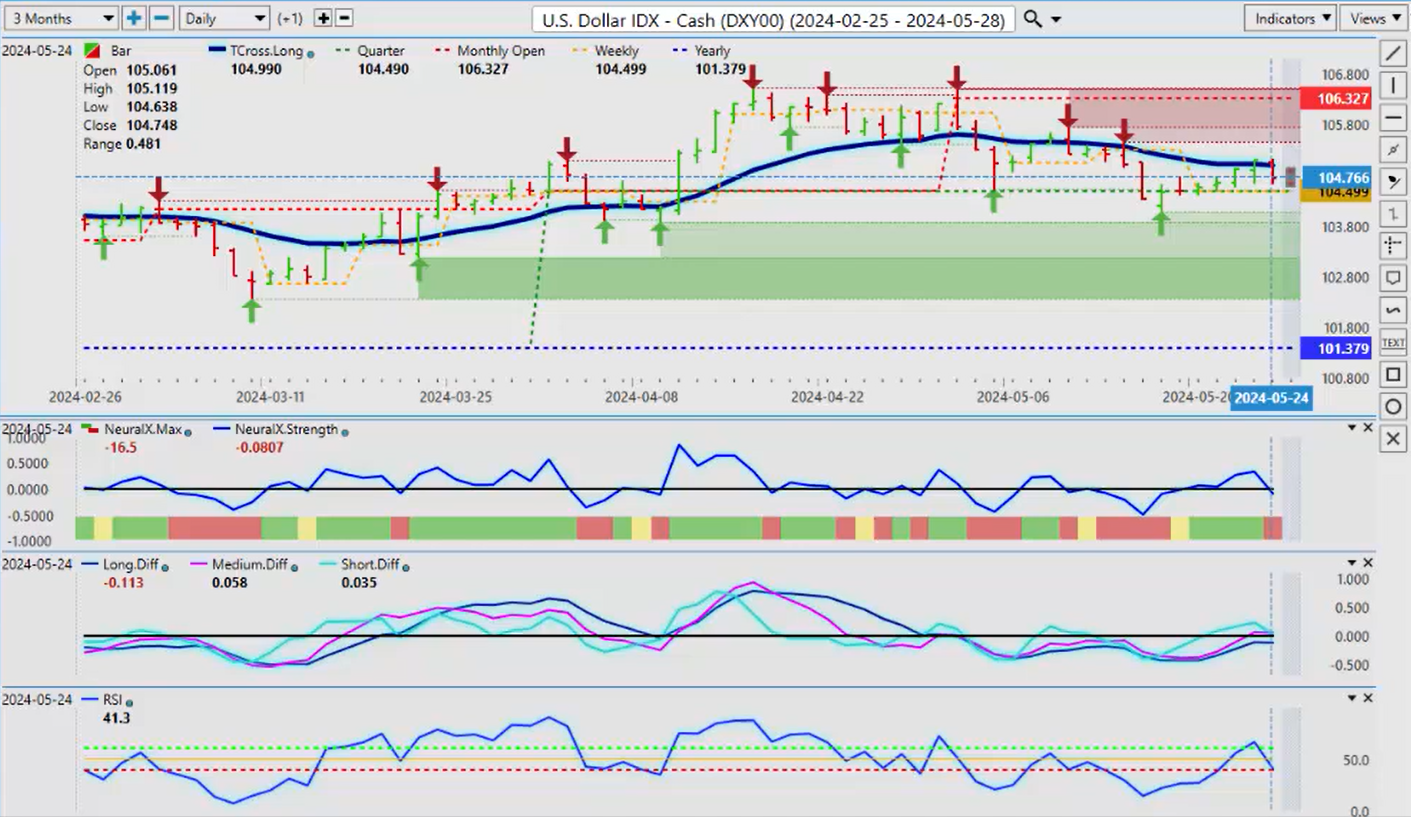
I always try to give something to the bulls and the bears. Your bear argument here is the Fed is going to have to cut in 2024, in my view. But you’ve got other Fed panel members that are saying the opposite, again causing the volatility in the markets. But we are firmly below our monthly opening price at 106.32 , and yes, we could break through this particular area. But remember, we have that period of dollar strength at the very end of the month into the first week of the new month, which is actually next week. So the probability of this T cross long breaking is higher because of the time of month we’re in. This cyclical pattern occurs almost every single month here. I’ve talked about it; I’ve coined it the dollar cycle. When real money must buy dollars, they don’t have an option. This could be US governments funding unfunded liabilities; they need to, you know, pensioners, government employees, but they require dollars. Even locally here where I’m domiciled, in Canada, we tend to run out of US dollars at our banks at the beginning of each month. So I would be prepared for some type of dollar strength next week. That is entirely possible.
Our indicators are indirectly confirming that. We have a medium-term crossover because our predicted medium-term predicted difference has actually crossed the zero line. So when we click on our F7 in our software, we can see that a crossover is trying to form here, but it’s really struggling. So keep an eye on the two aforementioned levels because that’s your breakout point, guys. Either a breakdown below 104.49 or a breakout above 105 will signal the next move in the dollar, with a slight bias to the upside.
Gold
Now, when we do a comparative analysis to gold, again, I gave everybody a fair warning here. I made the argument for the bull side and the bear side, but I have been on the bear side, and I have clearly stated last week I am not a gold buyer anywhere above 2450 . Because, again, my upside monthly target is 2472 . We approached that area and failed. Now, one could make the bear argument here that that’s it, gold’s done. I am not going to make that argument here. We are still firmly above 2286 , which is, again, our monthly opening price. Guys, this is price action-based. While gold is down, we are still positive on the month here.
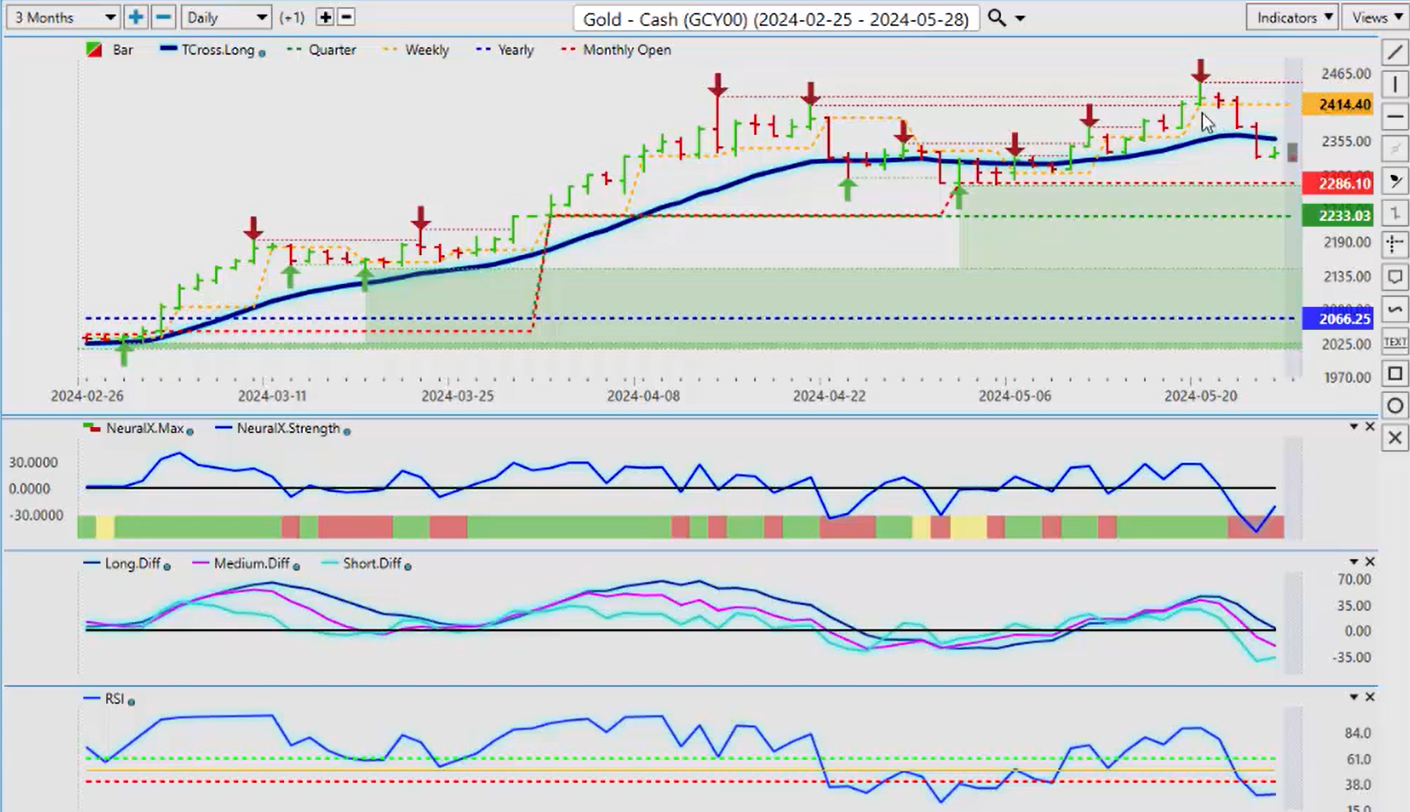
Now, what I’m seeing is that your more senior traders like buying gold, and the young traders coming in prefer to buy Bitcoin. So again, in my respectful opinion, gold, where historically the US dollar has been the biggest challenge to gold, I would argue gold also has competition from not just the US dollar but Bitcoin. So for now, we have broken down below our T cross long . That level is 2358 for next week. If we stay below that level, gold will likely push down below 2286 , but if we can get back up above 2358 , then gold longs are still in play.
So again, I always try to give something to both sides because, again, we are speculators in the financial markets. We just need precise levels. It’s not about being right or wrong or bulls are right, bears are right, or vice versa. That’s irrelevant, guys. It’s just knowing your levels, and if we break down below some of these levels, then we’ve got a problem. I will further point out, which I’ve already done this month, 2233 . That’s our quarterly opening price. So again, if gold can hold above, you can see very clearly how I’ve staggered my support here: the yearly opening price 2066 , 2233 for our quarterly, and 2286 for our monthly.
This is a very clear price action-based approach, and then I overlay the Vantage Point indicators onto this to help guide me through that. So, the medium-term crossover again and the short-term crossover are completed, but you’ll notice that the long-term crossover has not. This area here, with that long-term crossover, we need to be careful. The reason I am issuing caution about shorts down here is because I’ve got a reverse check mark on the neural index strength.
So, again, a very, very interesting indicator from Vantage Point because the neural index is red, but in actual fact, the neural index strength is showing the potential for a reversal back up to the upside. I’ve often discussed and coined this one as a reverse check mark. When I see that reverse check mark, it’s very seldomly wrong. So, if nothing else, guys, I anticipate we will get back up to 2358 , and that’s our line in the sand. If we get above that one, I could argue here two ways. The bears can set up their shorts just below that, and the bulls can put buy limit orders just above 2358 for a trend continuation.
But again, what I’ve also discussed with gold, going back as early as late March, is that gold’s seasonal patterns usually dry up at the end of April into mid-May. We’ve got that top that is put into place. Silver has failed also. Silver is following gold on the exact same day gold sold off, which was on May 20th, so that coincides with a seasonal pattern that’s been discussed. But be careful; these indicators are not actually 100% behind shorts here.
Bitcoin
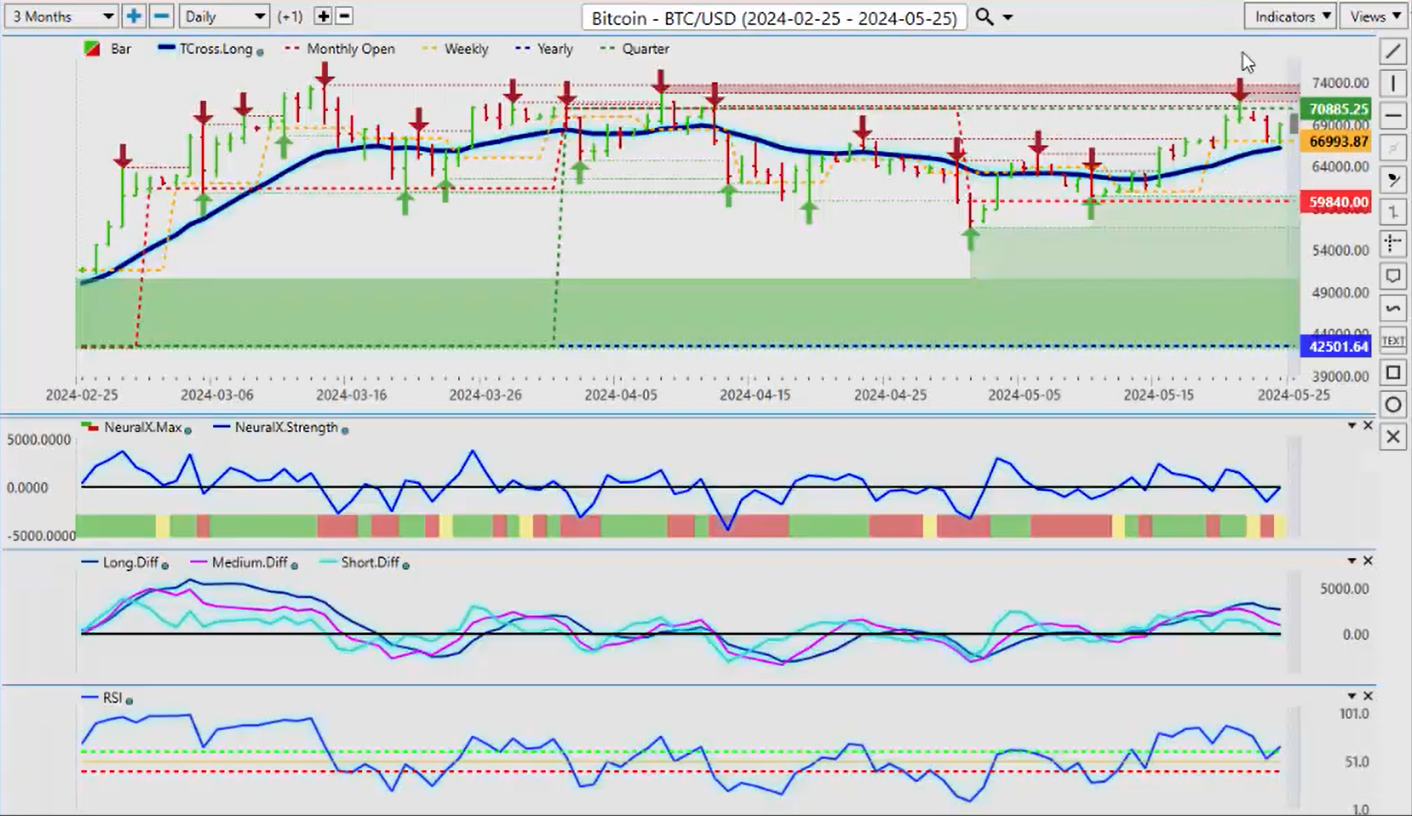
So, when we look at gold’s main competitor, Bitcoin, having another very good week, what I find particularly interesting here is how Bitcoin can pick what it wants to correlate itself to. I would argue it correlated to gold, guys, because shortly after gold failed, Bitcoin followed it. Bitcoin is holding stronger than gold because we’re above our T cross long . That area is at 66174 . If you’re a Bitcoin bear, then you would sell below the T cross long and then target the monthly opening price, but I would not be selling near that monthly opening because I believe that area will hold.
But for now, Bitcoin is slightly stronger than gold because, again, gold has broken down below our T cross long , and Bitcoin hasn’t. But what most miss is they both fell together. That’s what I want to point out. With these two heavy competitors, from an intermarket analysis standpoint, being very heavy competitors, this points towards dollar strength. If you know that the dollar is likely to show some kind of strength at the beginning of the month, that would explain what’s happening with Bitcoin and gold. Ultimately, I believe Bitcoin and gold will win over any kind of US dollar strength.
S&P 500 Index
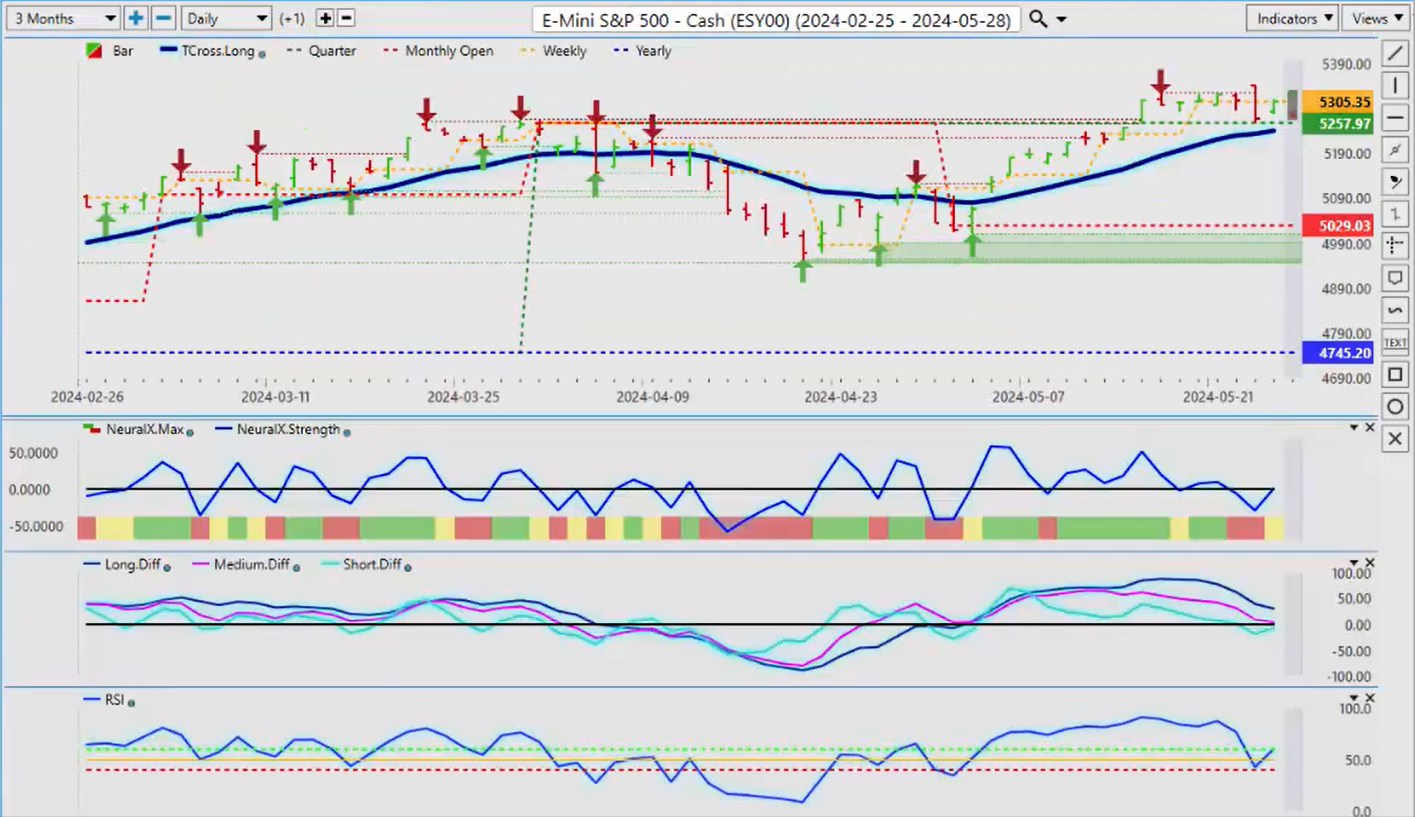
Now, where do the equities fit into this? That’s the million-dollar question here, guys. The equities are again warning of dollar strength here because the inverse correlation between the dollar and basically everything else—Bitcoin, gold, S&P 500, NASDAQ—we can rope them all in together, guys. That’s the whole basis of intermarket analysis. Equities are stalling at the all-time high of 5325 . We’ve come back up to that area and failed again, but stocks are still strong while above 5240 . We don’t have any crossovers other than the short-term crossover right here, but the medium-term and long-term crossovers have not occurred.
That same reverse check mark that I showed you on the neural index strength is also occurring on the predicted RSI at the breakout level of 40. With a 60/40 split on the predicted RSI, we can assess here that we don’t have a lot of downward momentum as of yet. We need that predicted RSI breaking down below 40 to signal a deeper correction is coming on the equities. But right now, we haven’t got it yet. It is likely to break at least come down over the next week, week and a half, and test this T cross long at 5240 , and we can reassess that once we come down to that particular level.
Crude Oil
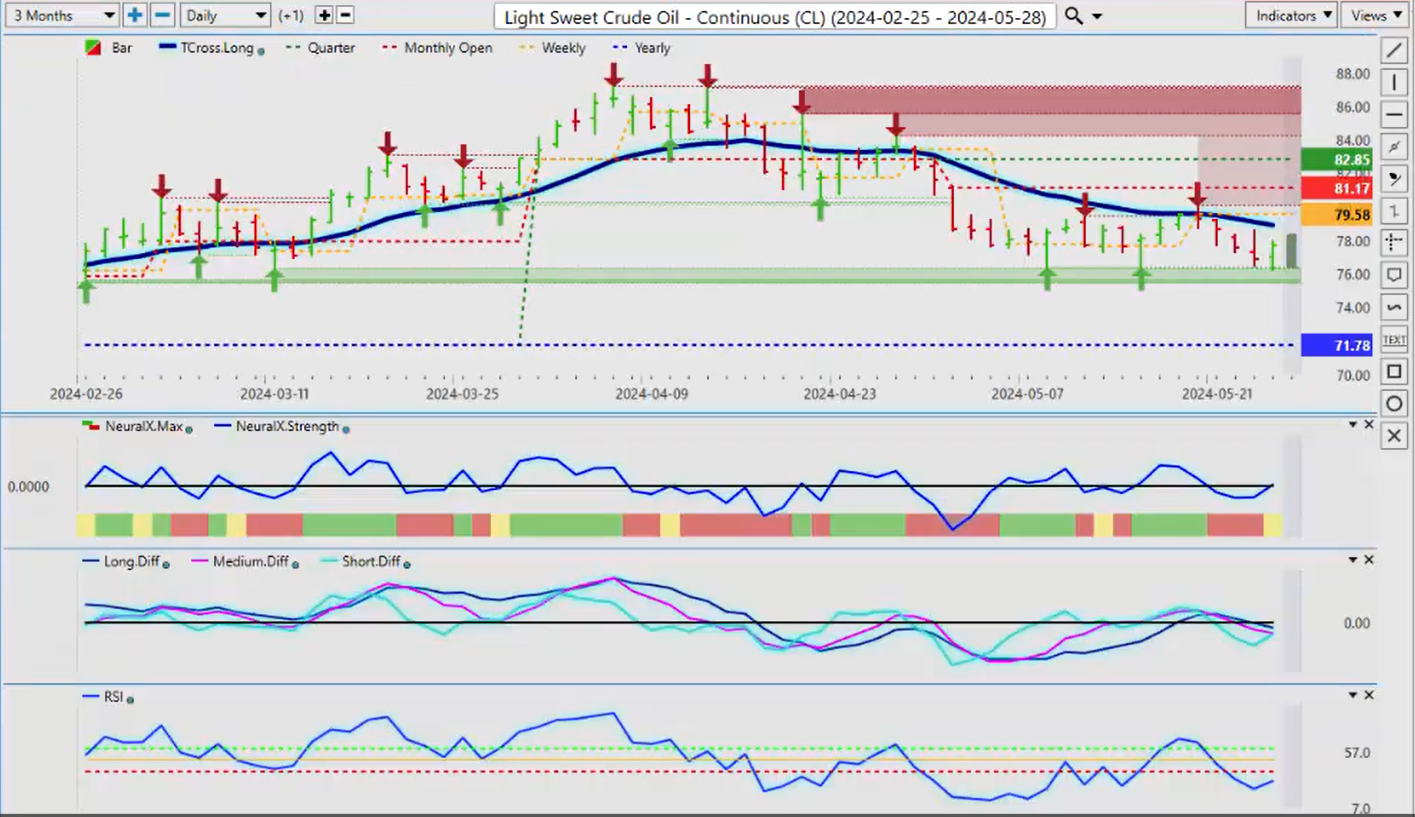
Now, for light sweet crude oil, again, heavy support down here at this 76 level. The seasonal pattern, again, doesn’t really favor gold, but it does favor oil as we move into June, July, August—those summer driving seasons. So, for now, pretty identifiable support. If we come back three months, we can get another multiple hard bottom here. Once again, the bull argument would be that we have heavy support, but the indicators are not overly positive here, other than the predicted RSI and the neural index strength giving that yellow warning sign. But very, very heavy support.
Now, very often what they do, guys, and I’ll give you a warning like I gave you on gold, is that they will try and run stops down here and then the real price will show itself shortly thereafter. So I could see them trying to run stops below 76 , but that would be a buying opportunity. I will give you a secondary level. The main level is 71.78 , the yearly opening price. For oil to turn officially bearish, it needs to break down and turn negative on the year. So I believe this area will easily hold, and right now, our immediate level that we need to keep our eye on is the 76 level, 76.34 . I myself have been buying heavily off this area for the last several weeks, but I’m taking profit because I’m not getting above that T cross long . But right now, that is our mean revision or retracement point.
Uh, not Fibonacci, not waves, none of this stuff, guys. We use real, hard numbers. You can see that as we sold off, came down to the 76 level, we hit our T cross long pretty much three days in a row and then failed again. So I can make a very bearish argument on that, but again, support down here, guys, at 76 , resistance up at the high. We continue to play this little game here until the real price shows itself, which I believe will likely be to the upside in the coming weeks and months ahead.
DAX
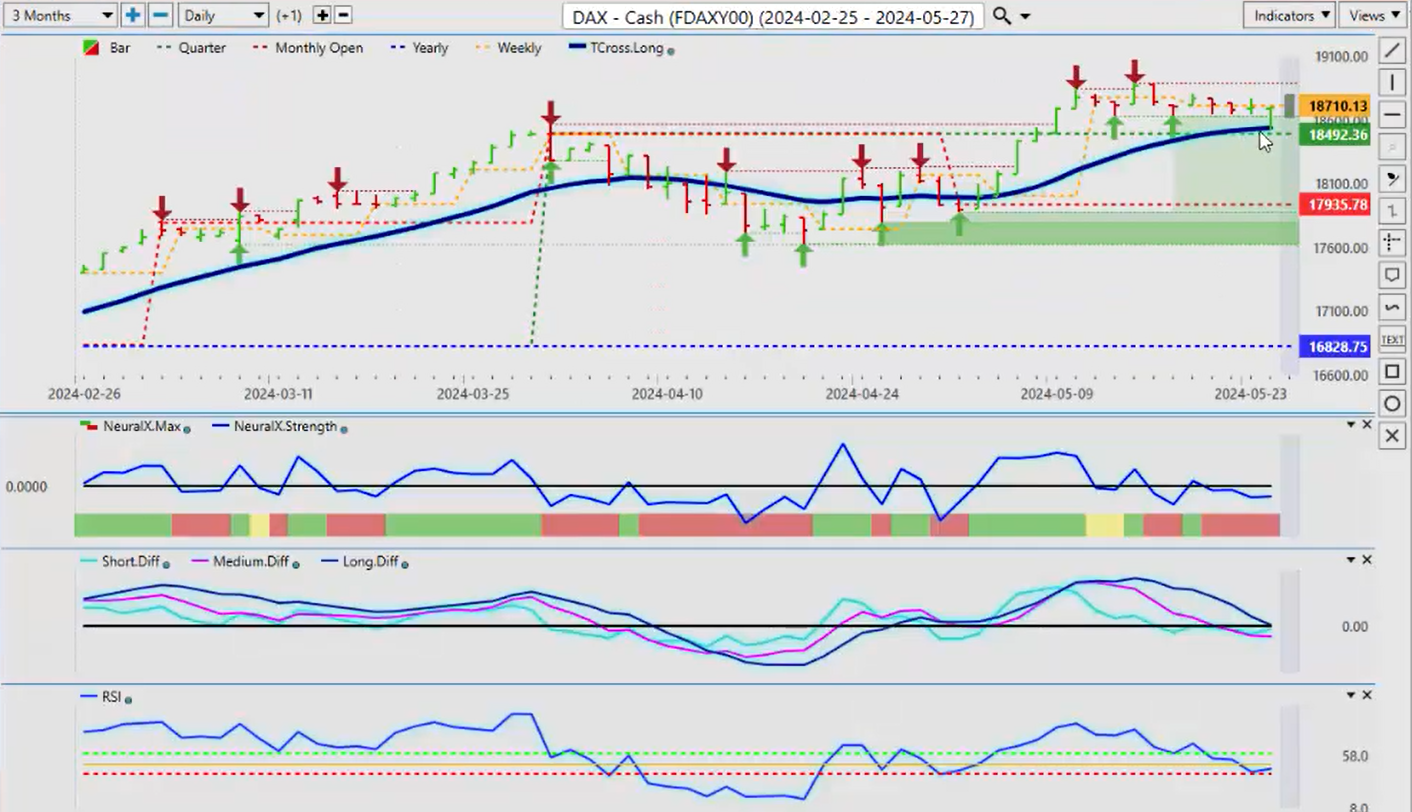
Now, as we look at the European markets for my European friends, right now the DAX is holding in there, but this is an S&P 500 trade, guys. The global indices are becoming exactly that—global indices with a very, very high correlation right across the board. So, the DAX for next week, you’ve got to keep an eye on your T cross long , 18,537 . That’s the key level. Below that, we have our quarterly opening at 18,49 2. I believe you’re okay for now, but if the S&P, the NASDAQ, the Dow drops, it’s going to pull the DAX down with it.
There is some European data coming out next week which will affect this DAX potentially short term; it may affect it differently than even if the S&P goes up or down. So we’ll be watching that. But our monthly opening, 17,935 , is still in a firm uptrend as long as we’re holding above that level. But again, signs of weakness: we’ve got a medium-term crossover; we almost have a long-term crossover here. But if you’ll notice the predicted RSI, again, we have no momentum to the downside, guys. The predicted RSI is failing at the 60 level.
The benefit of a 60/40 split is we can actually determine a breakout point if we have momentum. The RSI was never designed to be used as overbought and oversold; it’s a momentum indicator, a strength indicator. So this is saying there isn’t a lot of movement to the downside.
Volatility Index ($VIX)
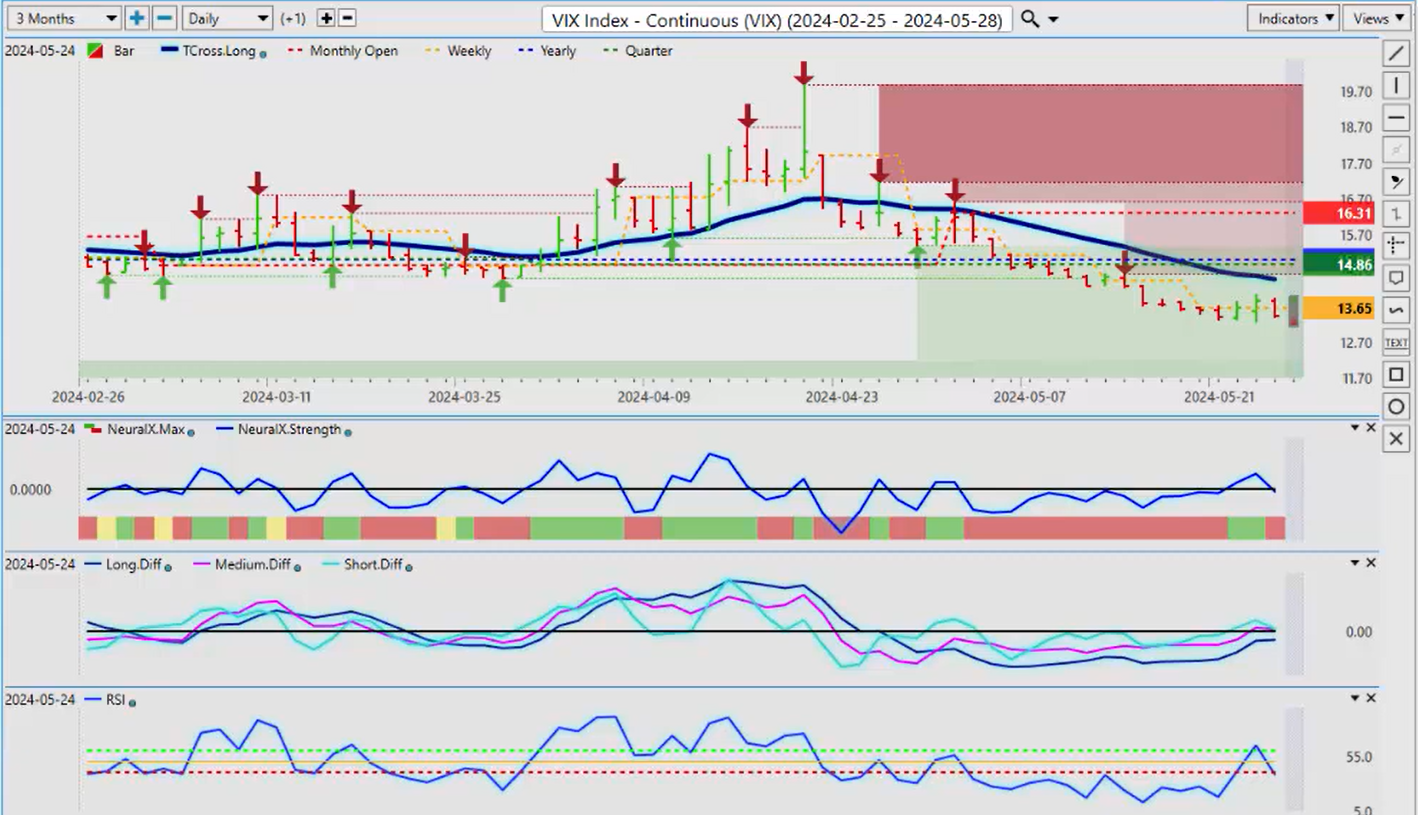
To match all of these together, I would look at the VIX and say, okay, if the VIX can move up, then that’s going to put pressure on those equity markets. But for now, it’s not. You can see that we tried to move on the predicted RSI; we failed. Now we’re sitting at 38, which is actually a breakout point to the downside. So we’ve got a very mixed bag here, but the VIX is firmly in a downtrend. We broke down under our yearly opening price at the beginning of March, so as long as this VIX is staying down, your stocks are going to be holding in there pretty good. But expect some volatility. I’m sure the Fed will be saying something again, sadly, next week.
Euro versus U.S. Dollar
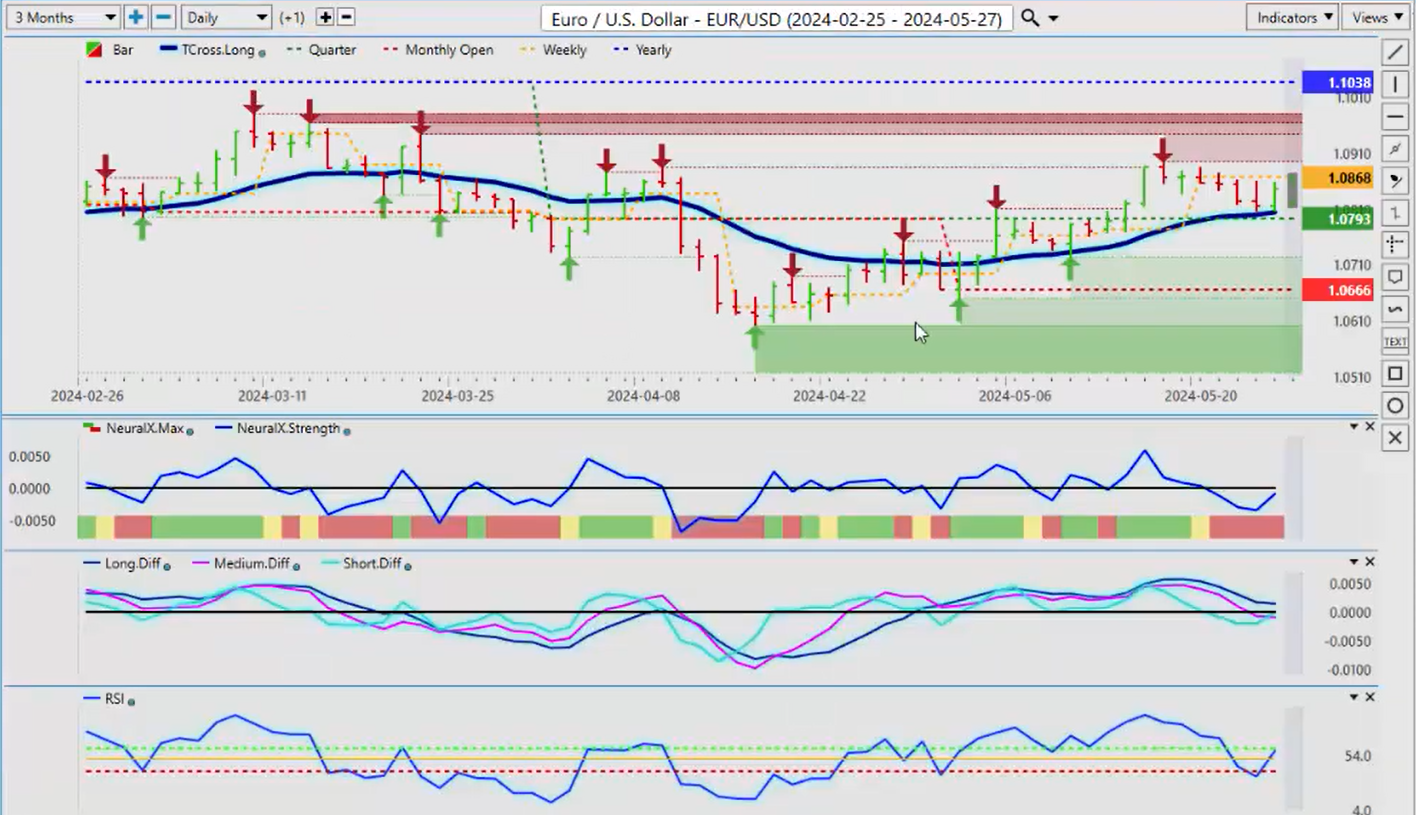
Now, as we look at some of our main Forex pairs, once again I will give everybody a gentle warning that my monthly targets on Euro/US to the upside have been hit. So right now, as we move into the end of the month, the euro is challenging the VP T cross long . I believe that this could break down because of the time of the month that we’re going into a period of dollar strength. If you want to stay on the bull side of this, your long entry is around 1.08 . You’ve got your quarterly opening at 1.0793 ; that’s where all your support is for next week. But I believe that could break down. We’ve got some crossovers occurring, but once again, combining the VP indicators tell me that I’ve got a mixed bag here. I need to look at those hard price targets. Right now, the quarterly opening and the T cross long are intersecting with one another. So again, if you believe the dollar will strengthen even short term, then you can set up sell limit orders below 1.0793 . I don’t know if you’ll get to 1.06 —I think that’s a tall order—but 1.0740 is possible.
U.S. Dollar versus Swiss Franc
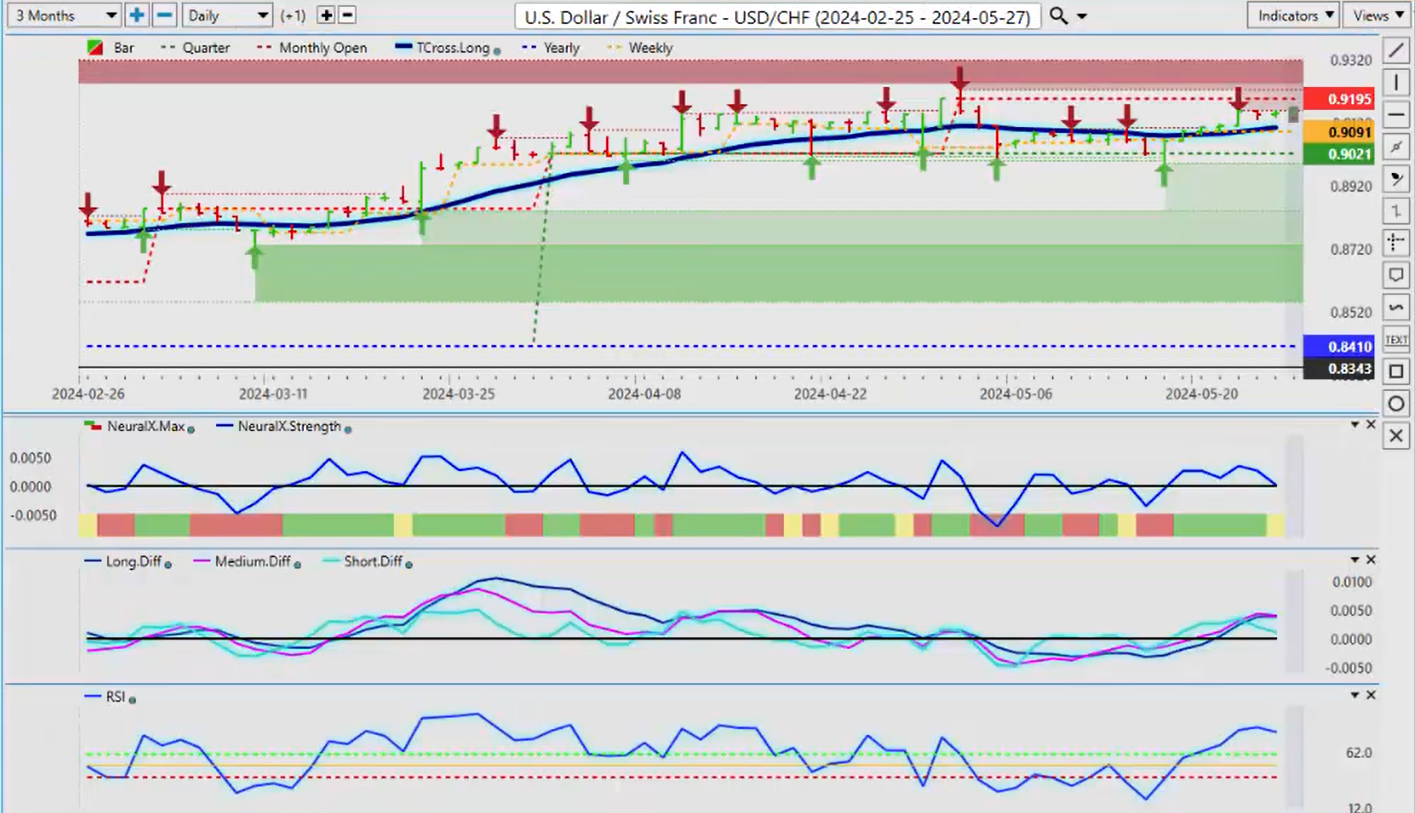
The counter pair to the Euro/US is the US/Swiss franc. We are holding firmly above the yearly opening and the quarterly, but we’re down in the month. This pair has been down all month, basically the Swiss franc regaining some strength against the dollar. I believe that monthly opening price is a big one next week: 0.9195 . If we break above that, we could see further upside. But ultimately, I believe this pair will go lower based on the economic numbers versus the US and Switzerland, flight to safety, yada yada. Many different arguments can be made there. Whenever this pair rallies, I believe it’s a selling opportunity.
Looking at the current monthly opening price, this will reset at the end of next week for the month of June—a new monthly opening price. We’ll monitor it there. But again, these indicators are very, very mixed. Our T cross long at 0.9104 suggests there is more downside likely than upside.
British Pound versus U.S. Dollar
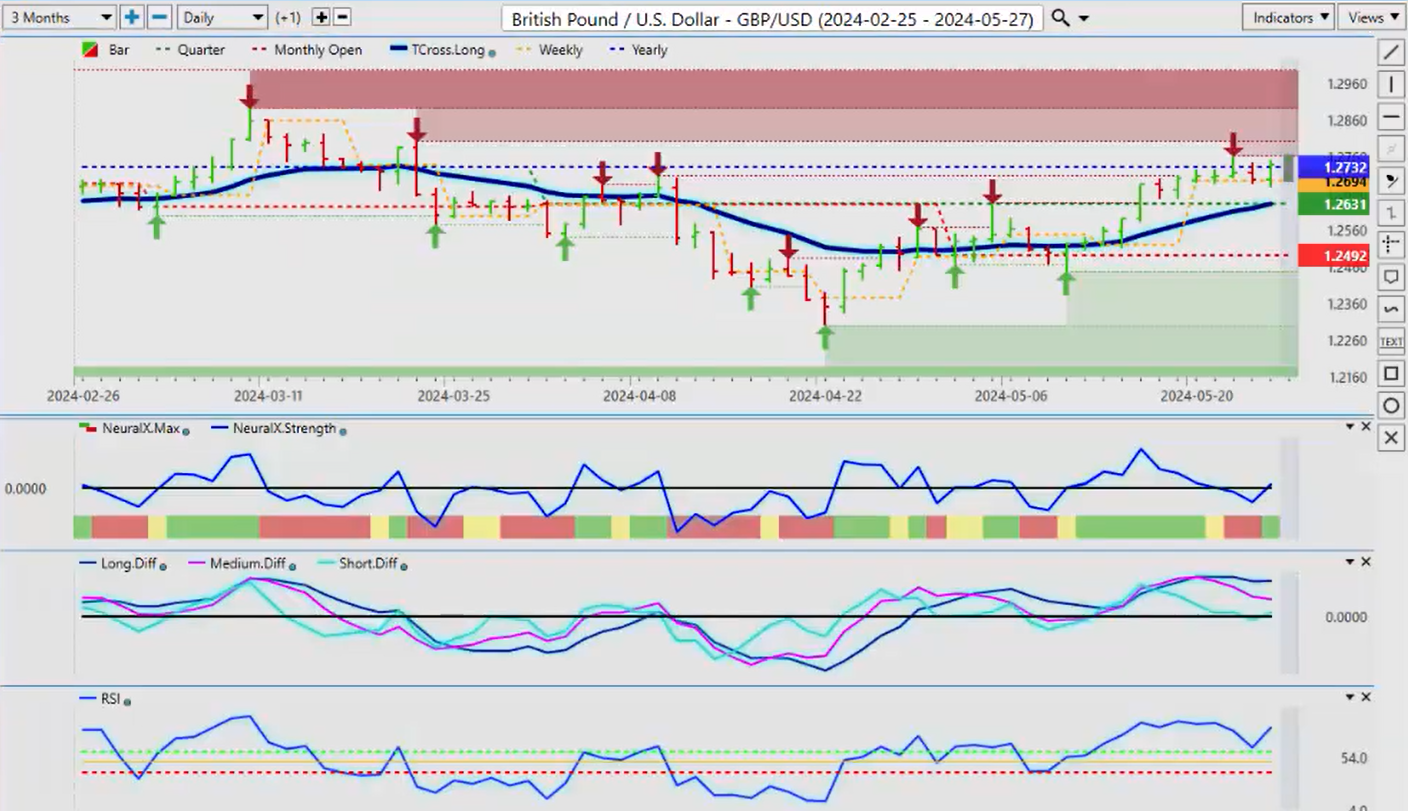
The British pound/US dollar has had a pretty good week, but this is a very powerful illustration of why we don’t want to be using rolling performance models. We don’t want to move the yearly opening price off the current calendar year because this is the line in the sand based on price, not based on my opinion, not based on what I think. Based on price against where we are in the current calendar year, we have struggled for five days across the current yearly opening price. Now, if I took a random 365 days to give you an illustration of that, that would give me a false number, then I would be saying, okay, well, I’m down here. Well, no, we don’t want to do that, guys. On January 1, we reset and say, okay.
A lot of chatter about how one week it’s bearish on the British pound, the next week it’s bullish. I don’t get into that back-and-forth stuff, guys. It’s not about being right or wrong; it’s about understanding and knowing your key levels, right? These levels right along here, the yearly opening, the current yearly opening price is 1.2732 . That is what has contained this pair the entire week. It’s impossible for me to script this, guys, because I talk about it every week. So I’m watching this level and I’m taking little, wee baby shorts across this because I just don’t believe the dollar has a lot of life left in it. But it does. Again, it’s not my opinion; it’s what I’m seeing with the dollar. The dollar is frustratingly staying above its quarterly opening, so that’s containing here. Our retracement point there is 1.2632 . That’s very easy for me to point out here. We get past the dollar strength, and then maybe the pound can regain and go higher. But we need the Fed to start talking about cuts here, guys, and he just doesn’t seem to want to do that.
This Fed has been extremely frustrating on my side because, you know, he’s going from five cuts to three cuts. I don’t know if I’m cutting now. I need three to five months of data. Anyway, that’s a whole other argument. I think what you’ve got to be careful of is just pick up on the inconsistency, if nothing else, from this particular Fed and be mindful of that because he’s flip-flopping everywhere, right?
U.S. Dollar versus Canadian Dollar
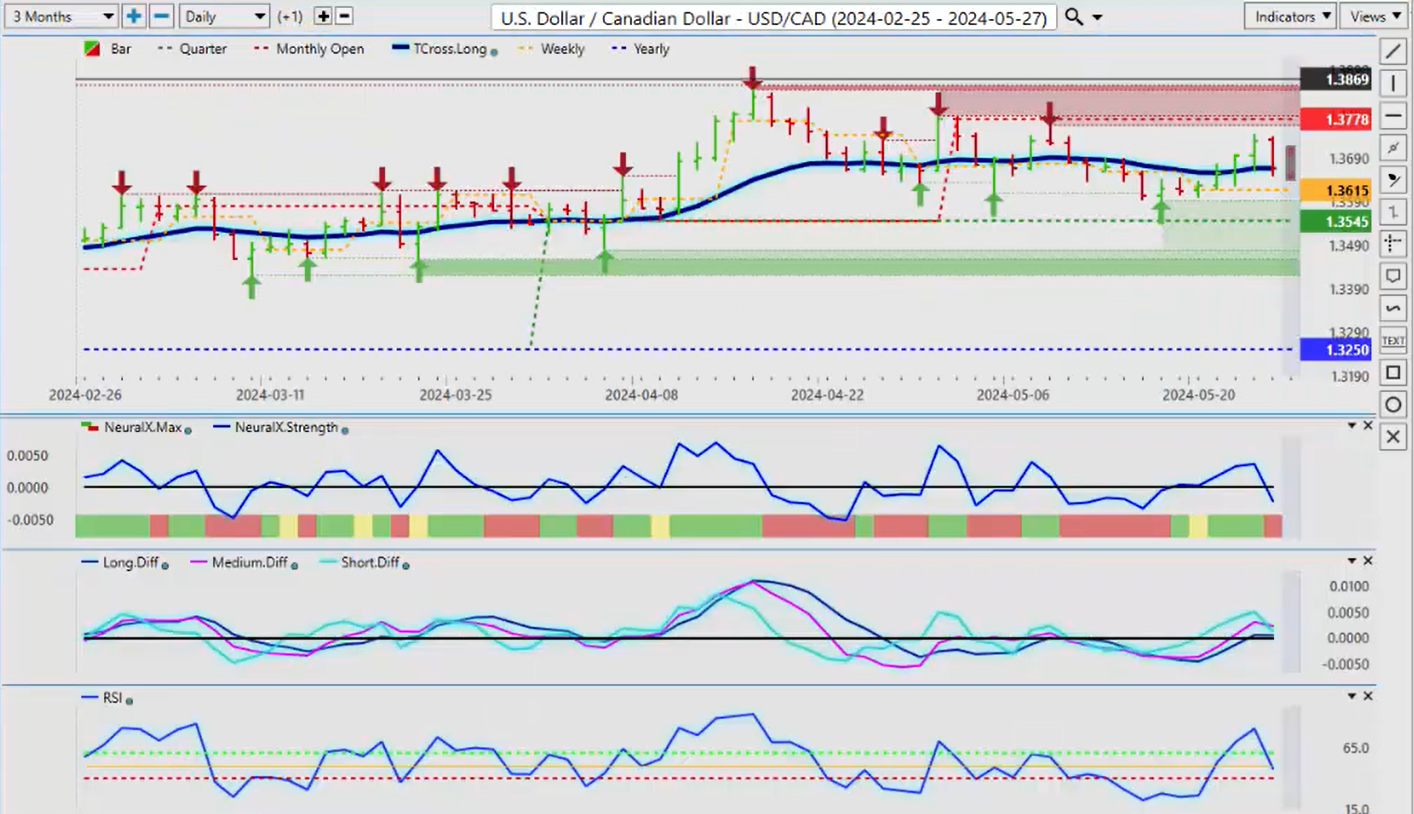
So when we look at the US/Canadian pair, the Canadian dollar has done pretty horribly this year, actually, and rightfully so. But you’re coming into a period of potential oil strength here, RBOB gasoline contracts strength, and that favors the Canadian dollar. So right now, it’s a tricky one. It finished the week right on our T cross long at 1.3666 . My bias on this pair would be to the downside once we get past the period of known dollar strength. So I could see us pushing back up towards, I don’t know if we’ll get to 1.3778 , but it’s possible. But I think more importantly, selling rallies is the better play as we move into that seasonal period of oil. 1.3716 on Monday, I think that’s a pretty decent area to start looking at your shorts. I don’t think there’s any risk to the upside unless we get above 1.3846 and stay above that. These indicators are pointing down, guys. They’re pointing that this pair is likely getting ready to move lower. So look for a rally up, and I think shorts are the better play there. But I will reassess it each week because, again, this is a weekly outlook, guys, not a monthly, not a quarterly, not a yearly. Each week, okay, what are we doing next week? And again, this is not a recap of something that’s already happened; it’s forward-looking.
Australian Dollar versus U.S. Dollar
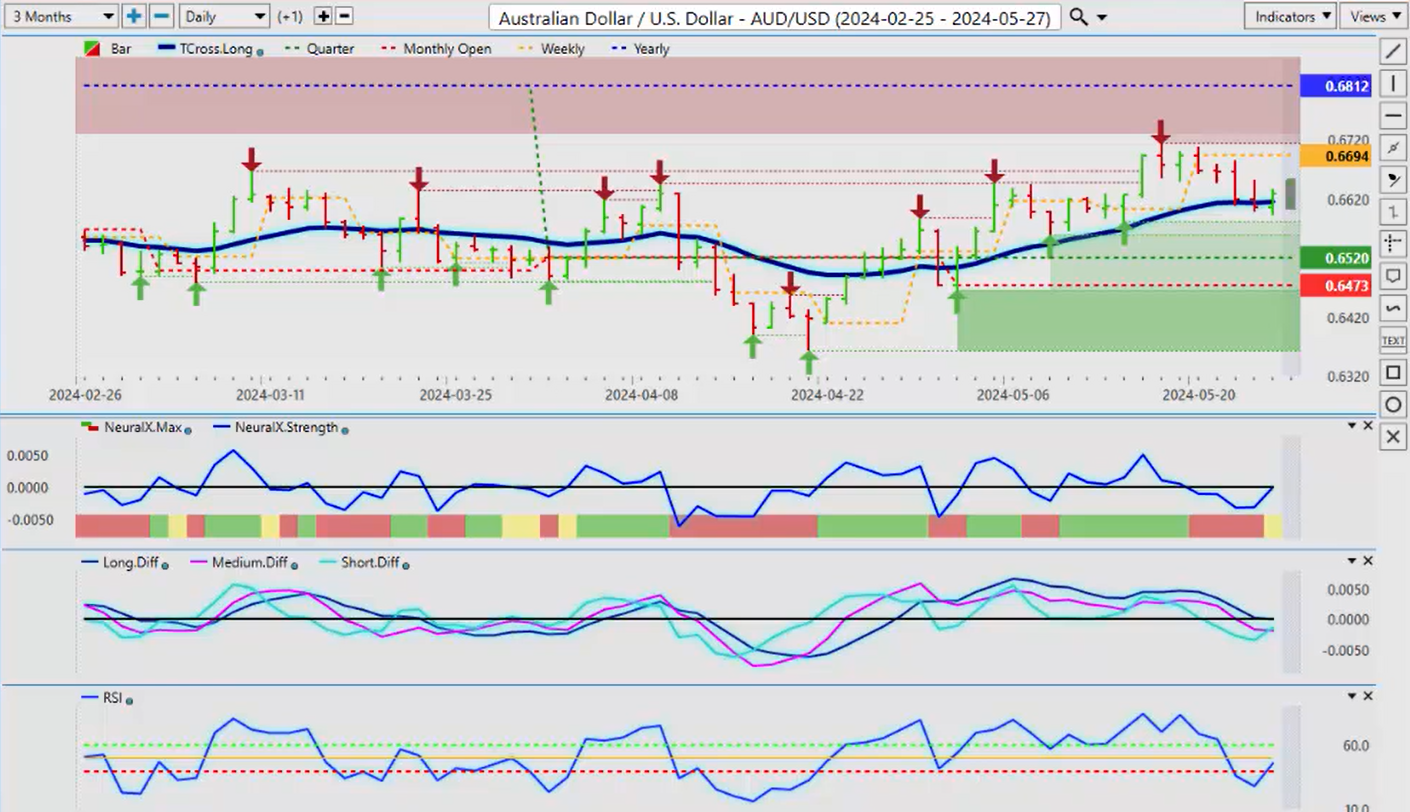
Right, so the Aussie again has failed as it approaches its yearly opening price, but we’re hanging in there. Sorry about that, guys. We’re hanging in there right around our T cross long . I believe the Aussie is a good buy. I’m hoping to get down to 0.6520 on a period of dollar strength so I can get an even better price on this pair. But again, just several years ago, I was trading this pair above parity, so if not if, but when, the dollar does sell off, I think there’s a lot of opportunity in the currency market, specifically with some of these like the Aussie, the New Zealand.
Australian Dollar versus New Zealand Dollar
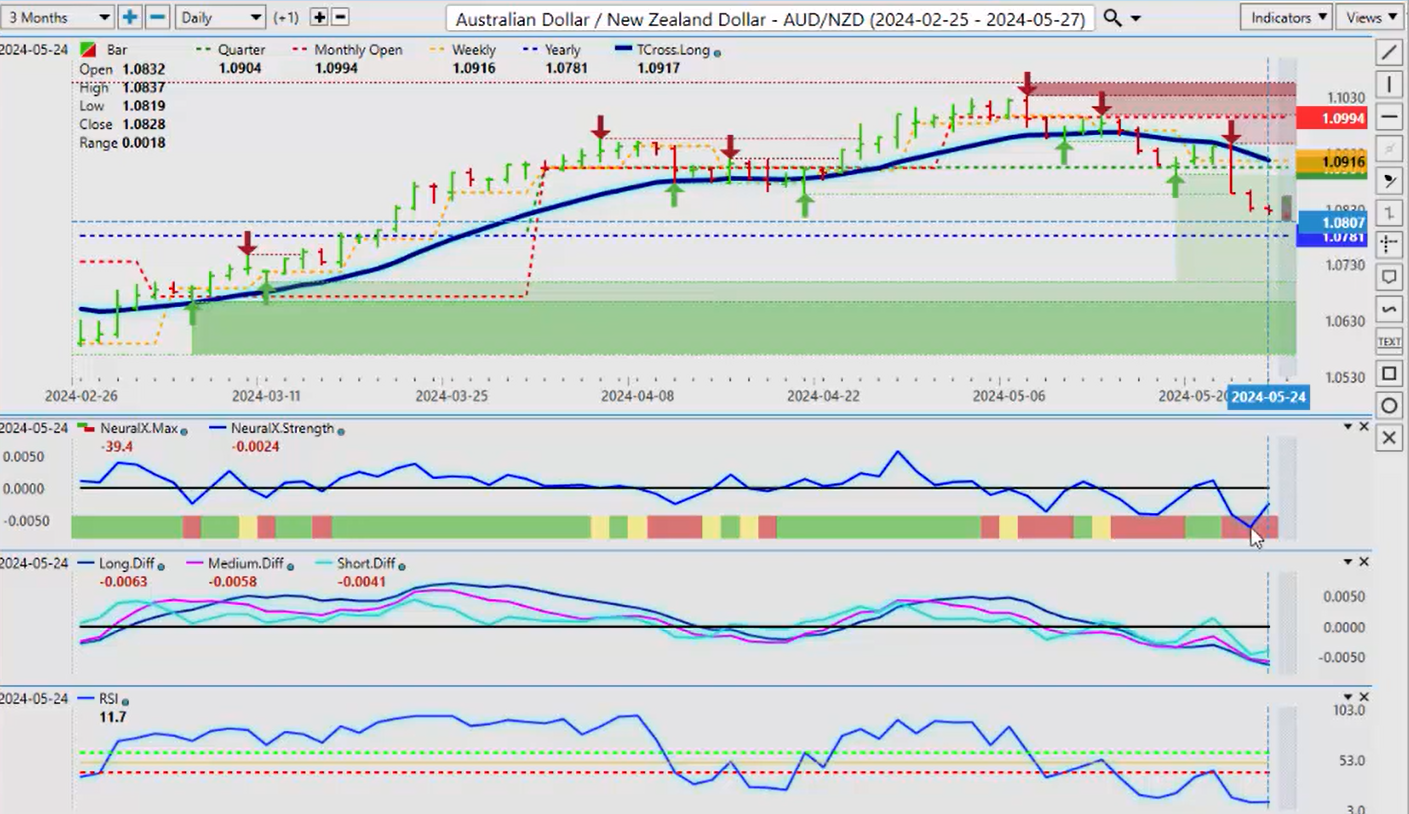
Because, again, you can see that it’s virtually the exact same trade. But of these two, I would argue right now that the New Zealand is stronger. I get this question a lot, and this is basically what’s fueling it. Obviously, the data hurt Aussie this past week, but as Aussie/New Zealand moves down, remember what this cross pair is, guys. In order for them to sell Aussie/New Zealand, they need to sell Aussie/US and buy New Zealand/US. So it tells you indirectly; this pair tells you which side you should be on here.
Here is why I believe the Aussie will rebound: we’re approaching the yearly opening price, and I believe that area is likely to hold. So look for some potential opportunity around 1.0780 next week. I think a long could work, and I’m looking for Vantage Point to guide me through that. That reverse check mark on the neural index strength, the predicted RSI sitting at 11.7 . We’ve had a good rally down now. I will never endorse overbought and oversold trading, guys, but I will endorse it if it’s near a critical level. Even if I just ignore this and say, okay, there’s my yearly opening price, and I believe the market’s overreacted a little bit, then there could be a very good long trade here.
And again, what I call the poor man’s seasonality is you can look at what it did last year at this time. Well, isn’t that interesting, right? So as we approach this yearly opening price, I would watch this pair because you could actually have a dual trade here, not just buying Aussie/New Zealand, but actually buying Aussie/US at the same time. But we need to confirm that that yearly opening price is going to hold.
With that said, this is the Vage Point AI Market Outlook for the week of May 27, 2024.