-
View Larger Image
Welcome to the Artificial Intelligence Outlook for Forex trading.
VIDEO TRANSCRIPT
Okay, hello everyone and welcome back. My name is Greg Firman and this is the VantagePoint AI Market Outlook for the week of May 13, 2024.
US Dollar Index
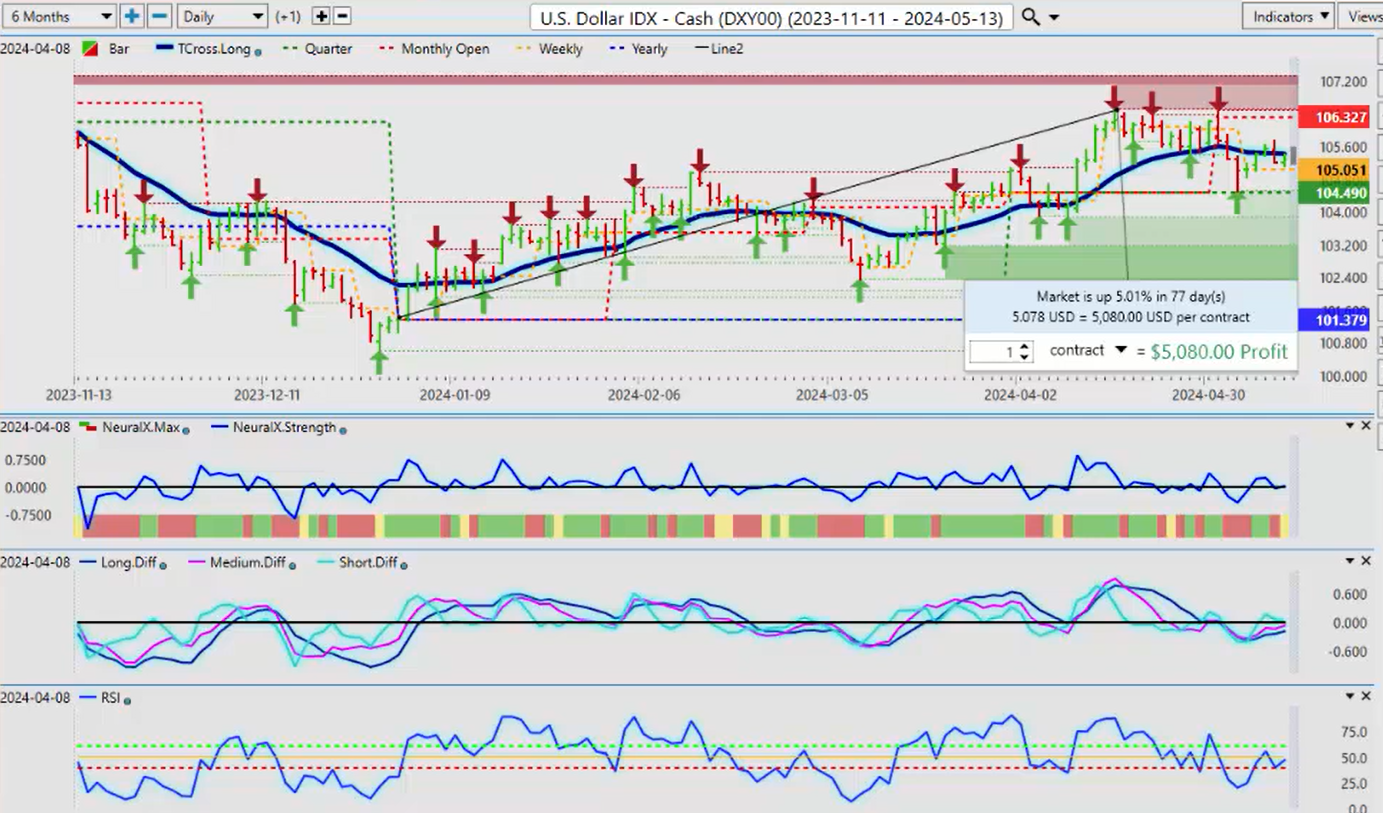
Now, to get started this week, we’ll begin where we usually do with the Dollar Index . We’ll mix things up a little bit so we can see what the actual real performance in 2024 is on the major markets. We can see that the Dollar has hit a maximum of 5% return since January 1st. Using that current yearly opening price is very important in determining what the real trend is from an objective standpoint, not getting caught up in these little macro and micro trends. So right now, the Dollar is holding below the TCross long 10543, but the indicators still suggest the Dollar could have some upside value.
Now, we’ve pushed higher, failed to break out on the RSI, but we’ve come back and retraced to the breakout point at the 40 level, and we’ve rebounded off of that. Now, we have an MA diff cross. Again, the Dollar is showing some sign of life here, but we’re firmly below the monthly opening price 10632. We are negative on the month, but we’re still positive on the calendar year with that yearly opening price of 10137. But ultimately, as I’ve stated, my view is that the FED’s rate hikes are off the table; it’s cuts only, and that is likely coming. The data is not supporting the Fed’s position, regardless of how he tries to spin this, so I believe that a rate cut is coming. Higher for longer is certainly possible, but I anticipate at least one or two cuts this year, and that should keep the Dollar under a little bit of pressure. But again, right now, we have this corrective move while below the T cross long at 10543, and again, we need to turn positive on the month in order to show that this trend is still intact. We’ve capped at 5%, and we haven’t made a new high in the US Dollar since April 16th. Now again, that’s not subjective; that’s what the chart shows us very clearly. So again, still a slight negative bias as we correct, but if we can get back above the T cross long, then we could potentially see further upside.
Gold
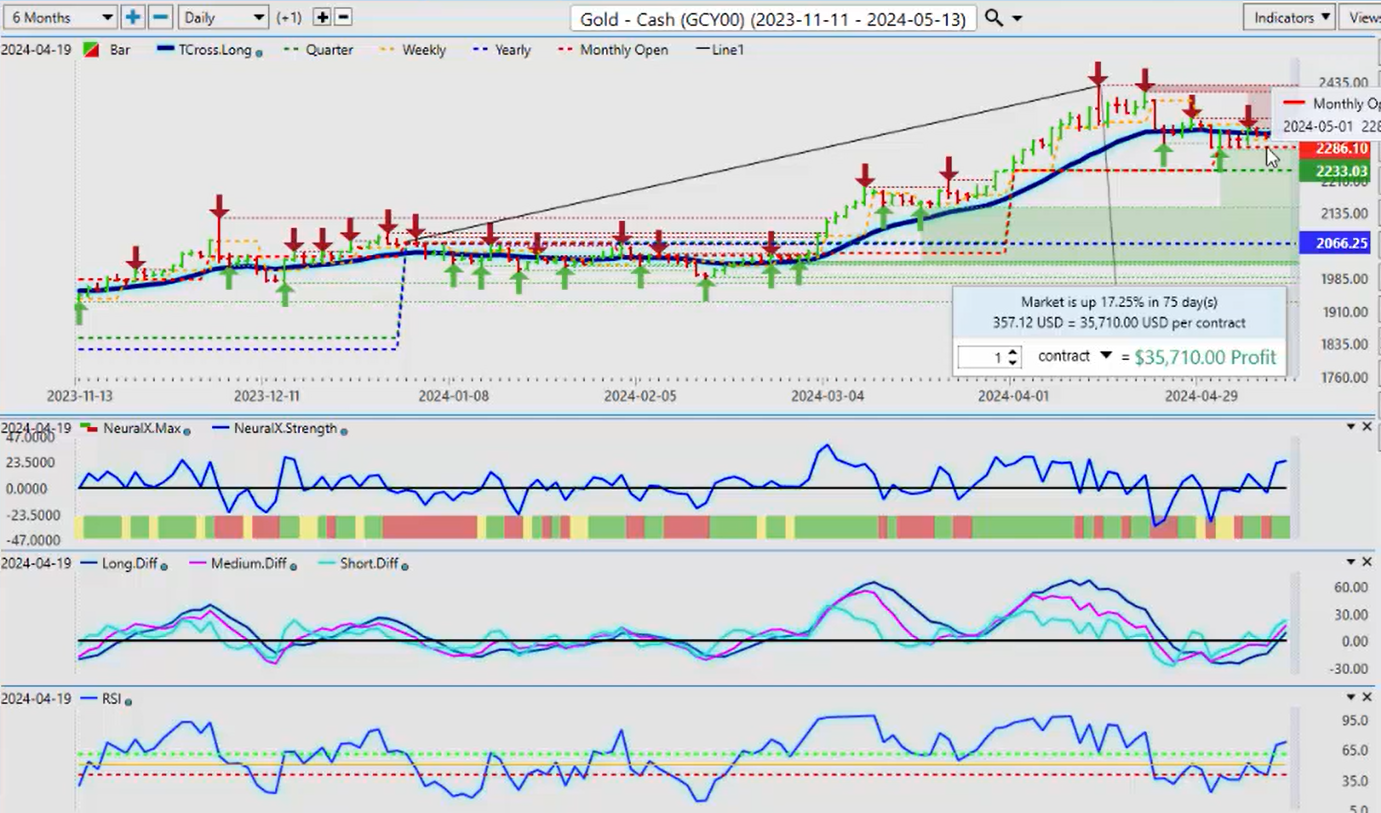
Now, when we look at Gold prices last week, I think I was pretty clear in the outlook that Gold remains and still has a bullish tone. But what I want to point out here is again, I always try to make an argument for the Bulls and make an argument for the Bears. So what I had specifically said is that we need to break above the T cross long, but Gold remains in a firm uptrend while below 2233. Our monthly opening price is coming in at about 2286. That area contained Gold . We crossed over the T cross long and we’ve moved higher. But again, this is completely based on guidance from the VantagePoint software. What I will point out, and again, that’s the bullish argument, so we now have as which I made very clearly last week, it’s not what I think but what I actually see, and I laid that plan out very, very clearly. Now, that’s the bullish argument. We’ve got our T cross long now at 2223, 2391; that’s our support level to start the week again, being guided by these VantagePoint levels which I clearly outlined last week. Now, my view is that we have not made any new highs in Gold , and again, this is not what I think, this is what the chart is saying. We’ve made a lower high there; we made another lower high, and my bigger concern is that JP Morgan Chase and Goldman Sachs have put out price targets on Gold at 2700 and 3,000. In my entire career, I am yet to see any of those forecasts come to fruition. In 95% of the time, it’s misleading. Is China buying Gold ? Yeah, of course, they are, but am I going to buy Gold just because China does? No, I am not. And to further go down that particular rabbit hole, India is holding more Gold reserves than China is. But when the media starts talking about these points and then Goldman Sachs comes out saying these are our price targets, I can give countless examples over the years how they’ve been wrong. The media basically tells everybody China’s buying Gold ; we’ve all got to buy Gold . Yes, we do, guys, but we also have to make the bull and bear argument on this. It’s not just a buy. So again, I would be more comfortable buying Gold up until the most recent high of 2412, but I will say that my price targets for the month of May are between again 2412, and 2472. Towards the 2472 area, I am not a buyer of Gold , and that is because, in most cases, not all, we use seasonal patterns, and Gold buying usually dries up around mid to late May, sometimes as early as late April. So the argument there again, to be clear, it’s nothing about what I think; it’s about what the chart says, and the media continually reporting on China buying this Gold because they don’t want to buy stocks, and they don’t want to buy real estate. That’s a fair argument, but that’s not the be-all and end-all. And the more the media pushes this narrative, the less attractive Gold looks to me. So when we do a comparative right now, uh, again, last week, I clearly mentioned that through the guidance of VantagePoint, not my opinion or what I think, is very clearly, the MA diff cross had been completed and was showing that what Gold was going to move higher. I simply put a cap on that area of the T-Cross long and said, look, we need to clear this area if we’re going to keep buying. And yes, Gold remains bullish above its yearly opening price, quarterly opening price, and more specifically, the monthly opening price. This chart looks exactly the opposite of the US Dollar . So once again, I believe that we potentially can move up to these levels, but in most cases, retail traders always buy high, and they always sell low, and then they’re left scratching their head, and 95% of the time, it’s been caused by this media. So again, be very, very cautious with longs up here, but they’re supported while above 2391, the same thing I said last week here, guys.
Bitcoin
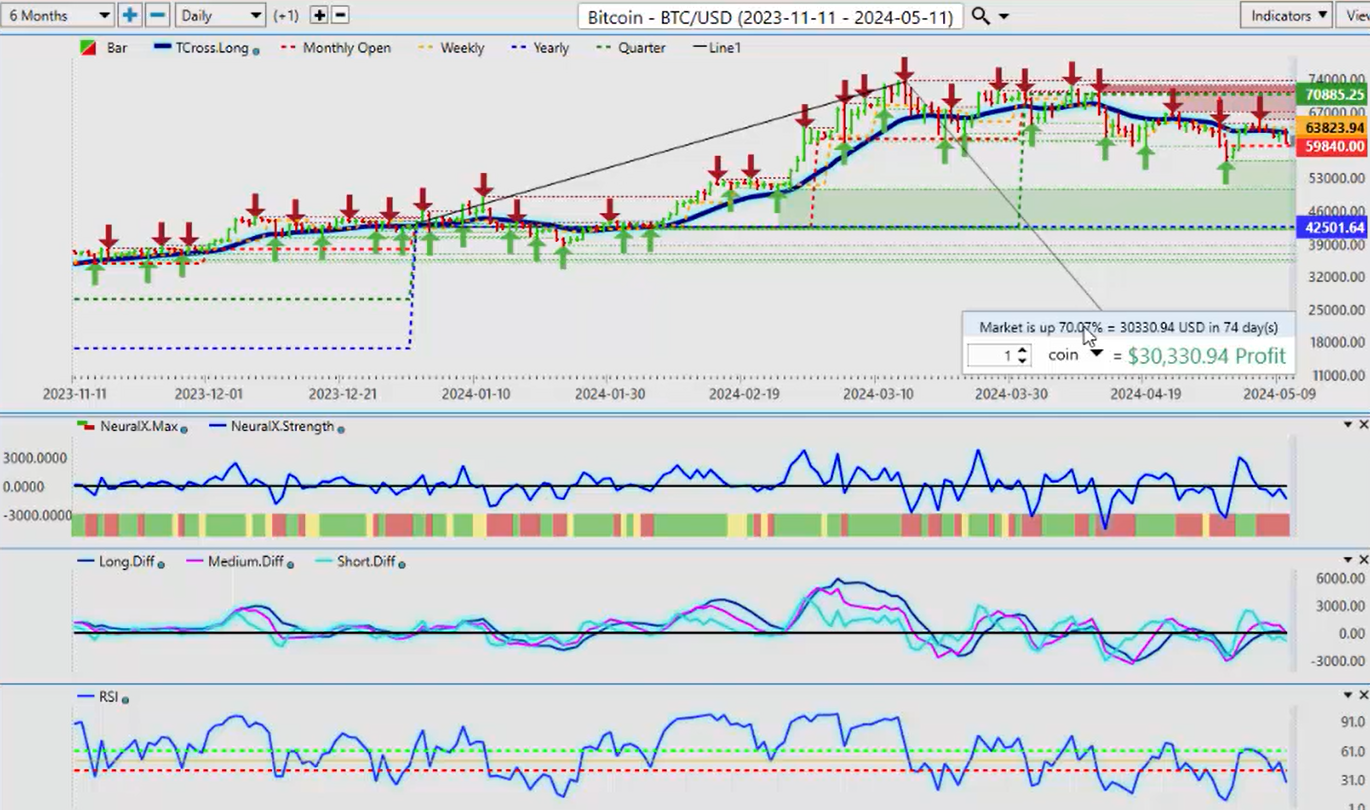
Okay, now when we look at Bitcoin , Bitcoin grossly outperforming Gold , not even comparable, hitting up 70% on the year, up 155% last year, as I’ve mentioned in these presentations, whenever Bitcoin ‘s had a down year of 50% or more, it’s had a very strong rally for the next three consecutive years, and again, that started last year. We were way out in front of it; we’re out in front of it now. The picture on Bitcoin right now does; we’re below our T cross long at 62,701, and it is unlikely that Bitcoin will move up while Gold is moving up, and that is Bitcoin is a very strange animal. It’s correlated itself to Gold , it’s correlated itself to the S&P 500, and the global indices. It’s a very interesting animal, this. But the main thing we want to understand is what its year-to-date performance is, and we’re not that far off that, guys. So again, am I day trading Bitcoin ? Not necessarily. I am a longer-term investor, taking the Warren Buffett approach, and I will point out that, again, that’s not always correct. Warren Buffett, to this day, refuses to buy Gold and refuses to buy Bitcoin , and I don’t think that’s the right play on either of these. I think that Gold and Bitcoin have been very good trades, but to be clear, Bitcoin has grossly outperformed it. So, well, maybe it is possible the Chinese are also buying a considerable amount of Bitcoin .
Well, I think that’s very reasonable. So, our monthly opening here, 59,800—we, I would prefer that we stay above this if I’m going to buy this until we start to see a deeper corrective move in Gold , if we even get one. But the point being is that this is a top performer, and again, it’s not what I think; it’s what the charts clearly state, as I said in last week’s outlook. So again, I don’t get into meaningless arguments over he said, she said. I go to the charts; that’s what we do, guys. So yes, Bitcoin is at significant resistance up at 73,662, and I do anticipate that area; we will pass that area during this calendar year and, specifically, late September, October, and November are my favorite months for buying Bitcoin along with right out of the gate in January. And again, I’m using VantagePoint’s key levels to guide me through that with basic price action tools that are again indiscriminate. The current monthly opening, the current yearly opening, and again, the quarterly opening is very important when we start a new quarter. So right now, Bitcoin is showing that there’s a little bit more downside, so we’ll keep an eye on that monthly opening price.
S&P 500 Index
Now, the equities, as discussed in last week’s Outlook, I believe that the FED is going to have to cut, and I believe that Equity markets are going to turn higher; that was clearly outlined in last week’s outlook before, not after it happened because this again is an Outlook, not a recap of something that’s already happened. So, when we look at this right now, the money is going to go either into equities or into Gold or into Bitcoin , or maybe all three, but for this, this is a very odd year for me specifically because Gold , up 17% on the year to having a very good year, is actually almost doubled the performance of the S&P 500. That is incredibly interesting and again, that can go to the Gold bull argument. But we also have to remember what I’ve said, and I’m giving that to you as a cautionary thing to say: look, whenever people like Goldman and JP start putting crazy price targets on something, it usually means that they’re taking the other side of that trade. I’ve seen them do this with Gold , I’ve seen them do this with Bitcoin , particularly with oil multiple times, so whenever they say buy, I am looking for a short.
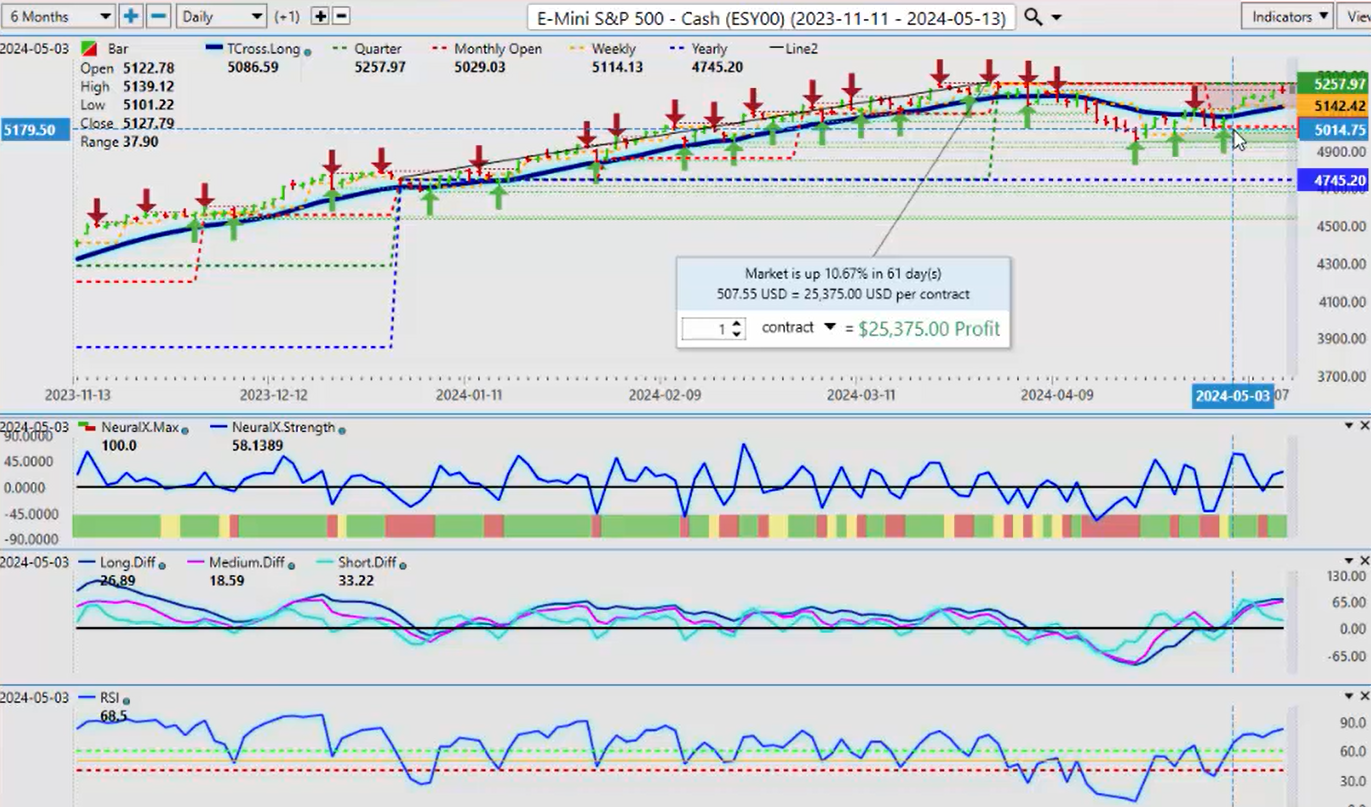
The S&P is making a very strong push last week, but we’re coming into again the yearly highs, but I believe that they can be broken because the FED is not reading this economic data correctly. They’re monkeying around with seasonally adjusting the unemployment numbers to make them look better than what they are, and pretending they’re not creating government jobs. No, no, no, guys, the FED is getting close to being backed into a corner here where he’s going to have to start to talk about cuts sooner rather than later. So, I believe the equity markets are pricing that in very much so, just like they are with Bitcoin , with Gold , with oil, some of the other different markets. Right, so right now, we need to—I’m sure there’s going to be some selling up at the 5256 mark, but if we can break through that and stay above our T cross long at 5135, then maybe the sky is the limit. Maybe it’s not, but I think we can break through that particular area on any type of dovish FED comments.
DAX
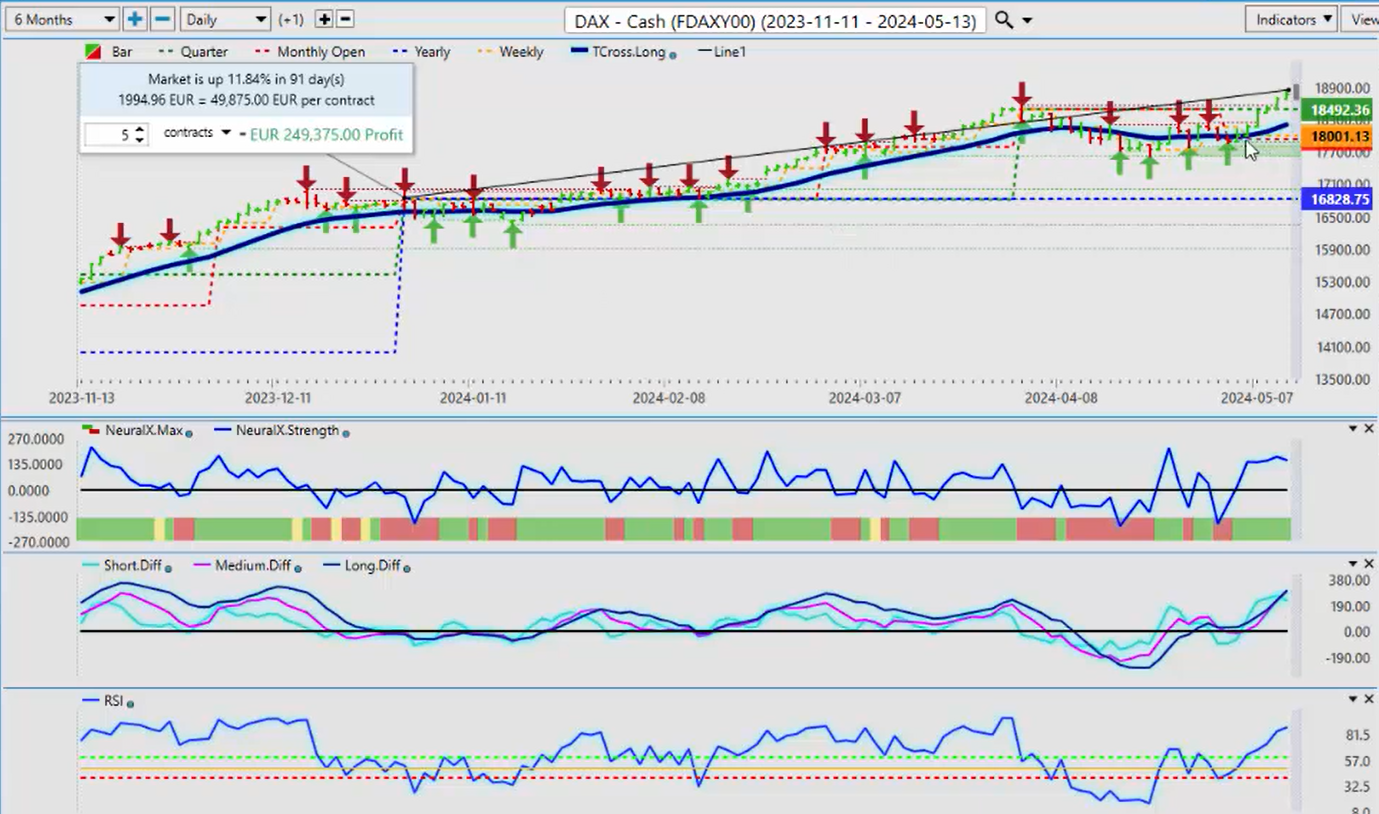
Now, as a comparative looking at the DAX, again, the DAX is the big winner last week, a very big winner, and what I had specifically stated in last week’s Outlook, because again, it is an Outlook, not a recap of something that’s already happened, and we, I try to identify the VP levels to watch for, and I often use that term, know your levels, like much like with Gold , if it breaks above that T cross long, then we’re good to go to the upside, at least in the short term. Right, so the equity markets, the same thing. We’re holding along the current monthly opening price that’s intersecting with the T-Cross long. The indicators in VP did not have a breakdown on the DAX or the S&P below the 40 level on the predicted RSI, meaning we have no downward momentum. It turns and makes a big run up, but what I had specifically stated is that the DAX will suffer the same fate, whatever that may be, of the S&P 500, and I clearly stated I believe equities will go—the S&P will go higher, and that fuels the DAX the same way. So, the DAX for next week, the Tcross long, 18,204—that’s the key level. But again, be careful, and that’s just like Gold , just like these other markets. I give warnings that are based on the charts; this could be a bull trap up here, so be cautious of that. That high is a very important high at 18,567. I would prefer that we stay above that level if I’m going to buy this, but cautious of that potential reversal because, as you can see, the neural index strength is a very interesting indicator. While the neural index looks—is doesn’t look green, excuse me—it is green, and you can see with that being a solid green, the neural index strength doesn’t actually show the same thing; it’s actually saying we’re stalling out a little bit up here. So, I’m not saying we’re going to crash on either the global indices like the DAX, the CAC 40, Nikkei, but I’m saying be careful up here; it’s just a fair warning that things are not always as they appear. So, a corrective move, if nothing else, is entirely possible back down to the Tcross long at that 18,204 mark.
Light Sweet Crude Oil
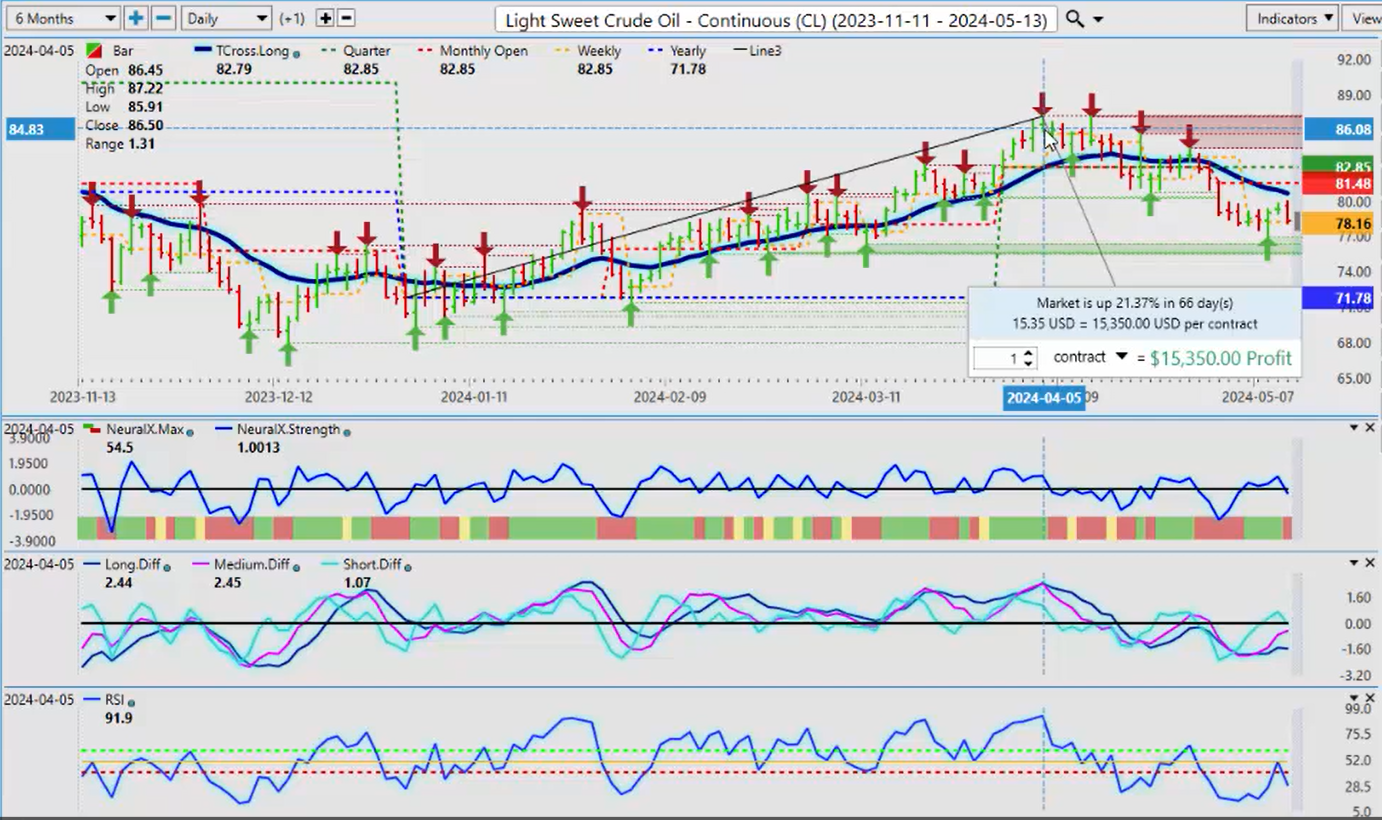
Now, when we look at Light Sweet Crude Oil , again, a strong performer, outperforming Gold , actually 21.37%. Now, what’s interesting about this is again, if seasonalities are not perfect, they just give us a warning sign in most cases; the Gold seasonal buying ends, like I said, mid-May to late May, and then oil buying starts. So, when you think of it from that perspective, and again, this is simply to assist traders, it’s more likely that oil moves into its seasonal pattern, and Gold moves out of it. That may or may not come to fruition; my job here is to simply advise of that. That right now, oil and Gold have been positively correlated.
But oil has outperformed it, so as we move into the summer driving season, oil usually extends higher with our RBOB gasoline contracts, and that’s usually when you see Gold fall off a little bit, and then you’ll see this slow rise of Bitcoin . But a lot of this is predicated on what the US Dollar does too. But the main thing is, we can identify where—what have we done this year? What has been the performance of oil? It’s very similar to Gold , actually. They’re both commodities. Is it possible that oil and Gold can go up over the next month? Yes, of course it is, but in most cases, they don’t. So again, right now, our T cross long on VantagePoint that is coming in at 8060—that’s the level we need to retake. The closer we get to June, the more likely we will get through this particular level, despite the nonsense in the Middle East and all this stuff. That’s the level we need to retake. And again, this is not a level that I think; this is a hard level that I can just like I did last week, guys, and said, okay, here’s our key level—if we get above it, we’re good to go. If we don’t, then it’s going lower. There’s nothing subjective about that; it’s objective. We have a clear line in the sand, and using the VP indicators for guidance as to which way we’re going—not what I think or what anybody else thinks, it’s what the chart shows. We haven’t made a new high in oil any different than we have in Gold , right around the same period. In fact, I could argue that oil is potentially a leading indicator for Gold . So, if oil turns around and Gold can’t hold that momentum, then that would simply confirm my seasonal patterns combined with the VP indicators.
So again, the closer we’re getting into June and summer driving season, the more likely it is we are going to see oil move higher.
Volatility Index
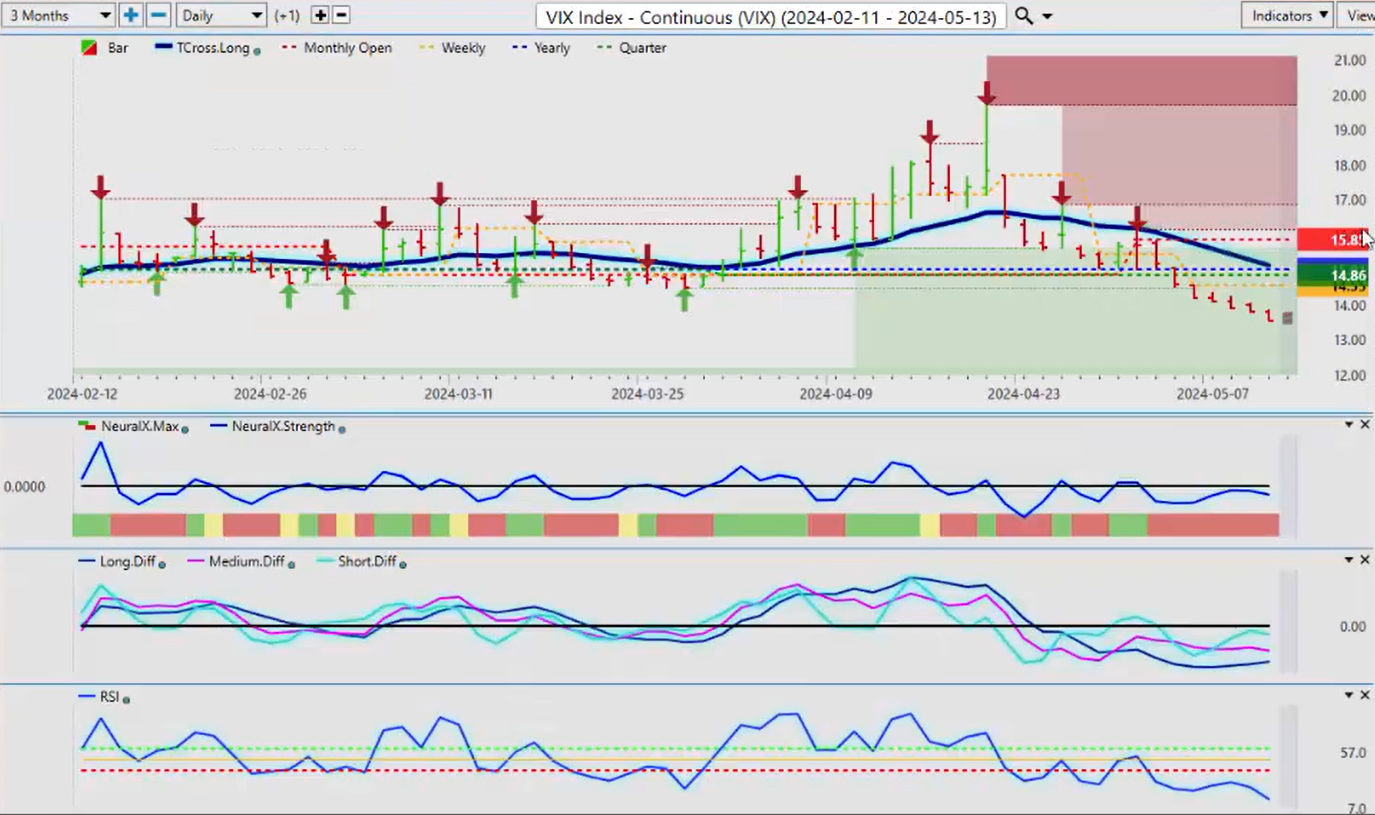
Now, we also discussed the VIX last week, and we’ll discuss it again here. I had talked very specifically about this 15.01 area, the current yearly opening price. So, on the VIX, this doesn’t look like oil or Gold or the S&P or the DAX or the Dollar . It doesn’t look like any of these. So, this again points to further strength in the equity markets, and the question is, can some of the other markets follow that, and will the Dollar respond negatively to that? I believe it will. So right now, the VIX remains very negative. The predicted RSI is at 14.6. I don’t look or even consider overbought or oversold levels, guys. That’s like us telling the market to stop going lower and turn around and go higher because it’s theoretically oversold. Well, I can’t even tell you guys how many times something has been overbought or oversold. You can see it right here; the trend is actually just starting, and the RSI can go into overbought territory, and the trader takes the opposite side of the market and tries to short it and gets killed, and then a week or two later, it follows into that pattern. So, be careful when you’re trading in a market that’s filled with algorithmic programs, quantitative-based programs that don’t care about overbought and oversold. It’s a momentum-based trade. So when oil breaks down, say that puts us in a break of the 60 level on the predicted RSI. A break of the T cross long would be the same thing that would take us out of the VIX. We break down below the T-Cross long, we break below the 40 level on the predicted RSI, we’ve had multiple retracements but never got back up above the 60 level to say, okay, we’ve got upward momentum. And you’ll notice exactly where the VIX failed on that T cross long and then continued its move lower. So yes, we could have a potential retracement, but this here is what you really want to keep an eye on—the T cross long. If that crosses over the yearly opening price, then that would be a very, very bullish signal for the global equity markets—maybe not the Nikkei, but all the other ones. So, we’ll watch this area very closely, but the T-Cross long 15.14, that’s our retracement point.
Euro versus U.S. Dollar
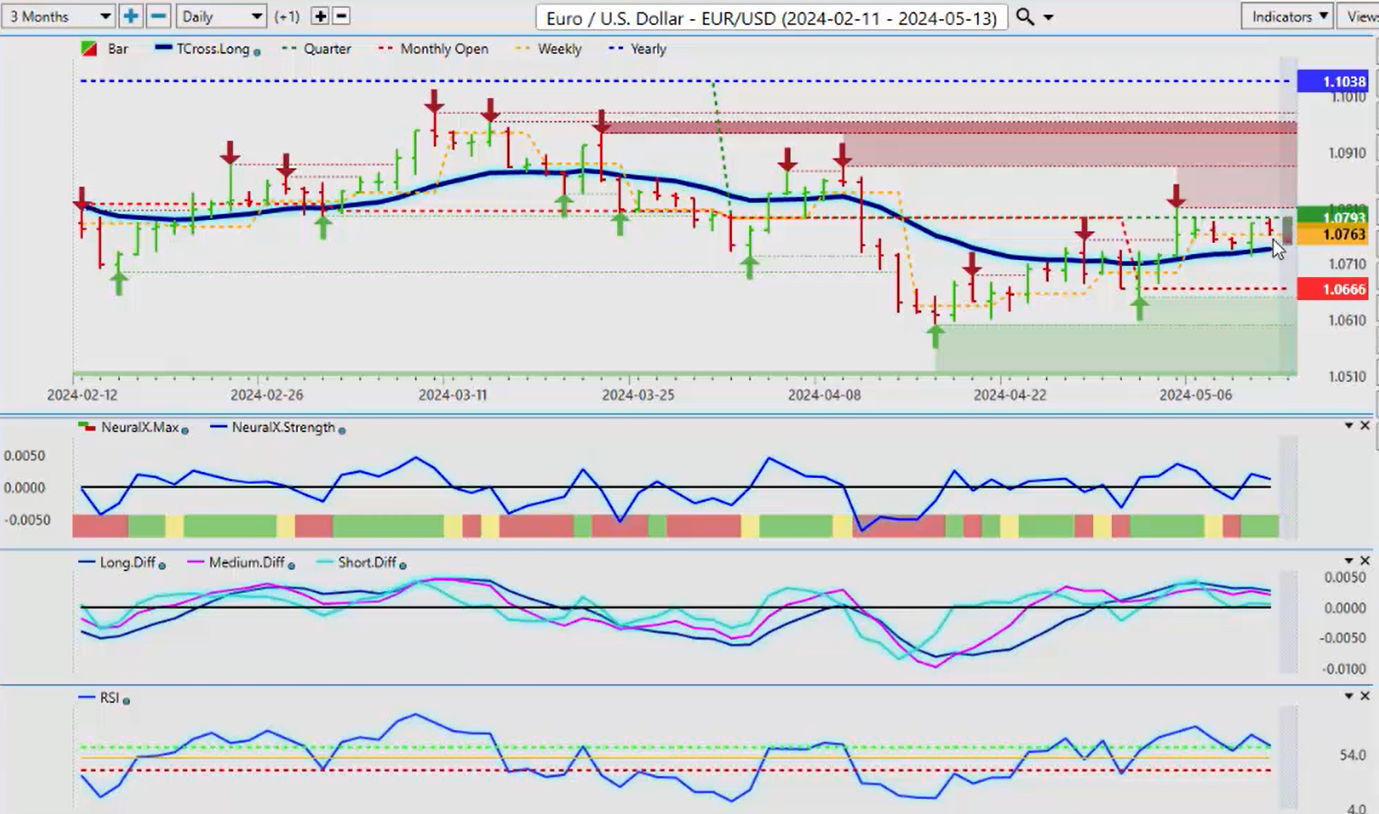
Now, as we go into some of our main FX pairs, again, the Euro reacting to that payroll number—it’s held up, but once again, guys, this is the benefit of using—you know, and again, this is not what I think; this is what I know. The quarterly opening price is very important to me, as is the yearly and the monthly. And right now, you can see that we’ve got this resistance, while they’re calling for a very bullish move in the Euro. Well, that’s possible, but we have to make that case objectively. We’ve never been positive on the calendar year on the Euro, and that’s not what I think; that’s what the charts tell me because I’m measuring it from an accurate standpoint, not using a rolling performance model. I want to know exactly where the Euro is on the calendar year. So the big obstacle for next week is, again, to get above that quarterly opening 107.93. If we can’t get above that, then we’re likely coming back down to the T-Cross long at 107.36. The indicators are suggesting that that is entirely possible.
U.S. Dollar versus Swiss Franc
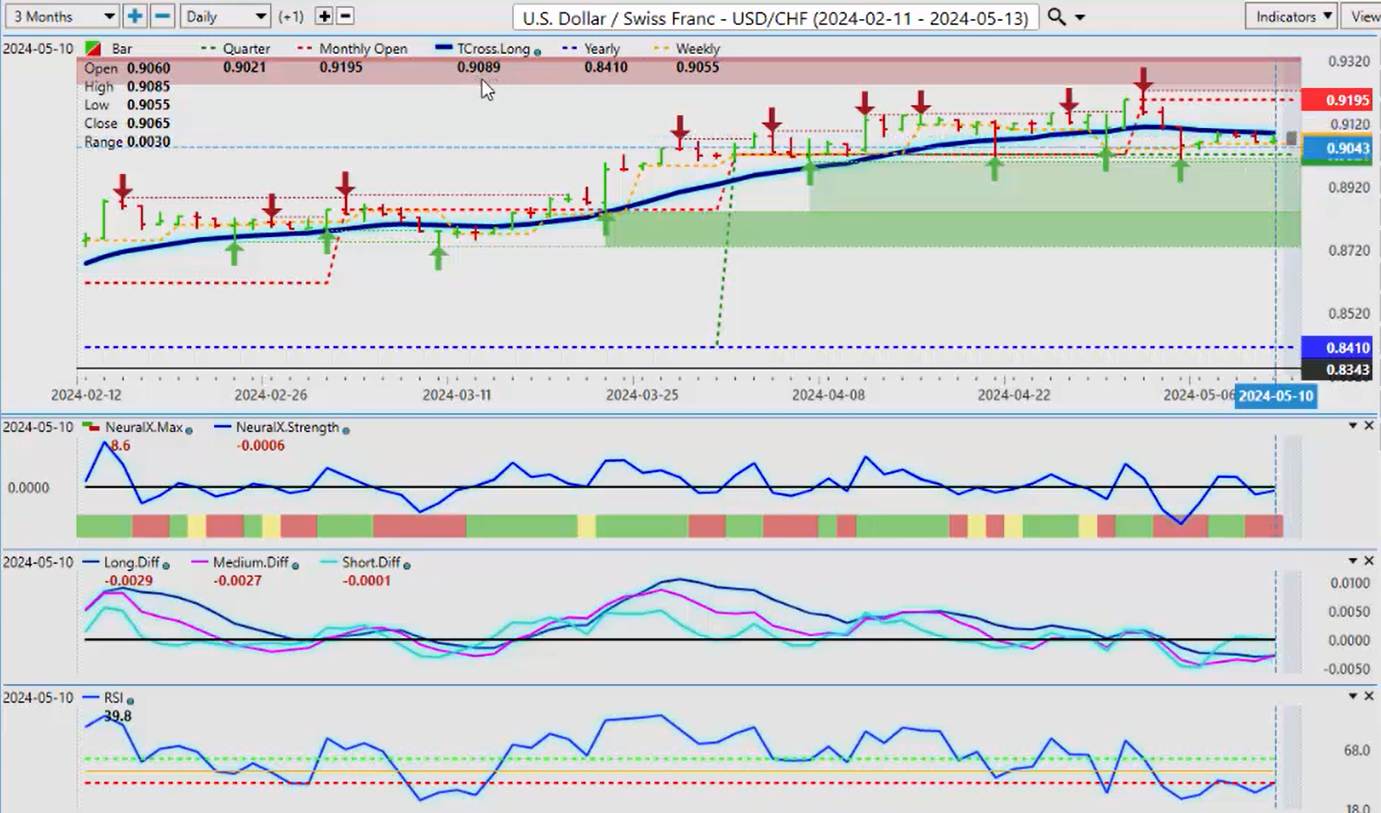
Now, when we look at the US Swiss Franc , once again, if I’m using the current quarterly opening price, then I can say objectively, not subjectively, that I need to break down below 0.9021, which would trigger additional shorts on this. But if I can’t break down below that level, then the potential to break back through the T-Cross long at 0.9089 is a reality. So this is all about identifying objectively—identifying critical levels using the VP tools, using the current yearly, monthly, quarterly opening price, even the weekly opening price I use, and then looking at the reversal contrarian indicators like our MA diff cross, that is warning that potentially there’s some dollar strength on the horizon because, again, that pink line crossing the blue line is saying the medium-term trend is weakening against the longer-term trend. So if we can push through that, the maximum retracement point, guys, that I’m going to give this is 0.9195, the current monthly opening price because ultimately, I believe that your commodities, your equities, are going to benefit, not the Dollar —that’s just a matter of time before he cuts. So these are the key levels to watch, and the indicators are suggesting we could break through that T cross long.
British Pound Versus U.S. Dollar
Now, when we look at the Pound Dollar for next week, once again, the Pound is struggling along here, but we’re holding above the current monthly opening price. We’re positive on the month, but we are negative on the quarter and negative on the year. I believe that these levels and the months ahead will be breached, but it could be a tall order. This is a weekly outlook, guys, not a monthly or yearly or quarterly; it’s a weekly outlook. So right now, this pair is challenging that T cross long, 1.2518, guys, and then our monthly opening price at $1.492. All of our support is sitting right there. And again, when we know these critical levels, then we can trade it. So, you could say, okay, I’m going to put a buy limit order as long as we stay above our T cross long, or I’m going to set up a sell order below the monthly opening price at $1.2492. I would strongly advise waiting until at least 9:00 a.m. Monday morning before taking any trades because remember, on Sunday night, not all markets are not in on Monday until about 9:00 a.m. Eastern Standard Time; that’s when we start to see the true price for the week. So right now, that’s our key level. If we lose it, then that will simply confirm Dollar strength.
U.S. Dollar versus Japanese Yen
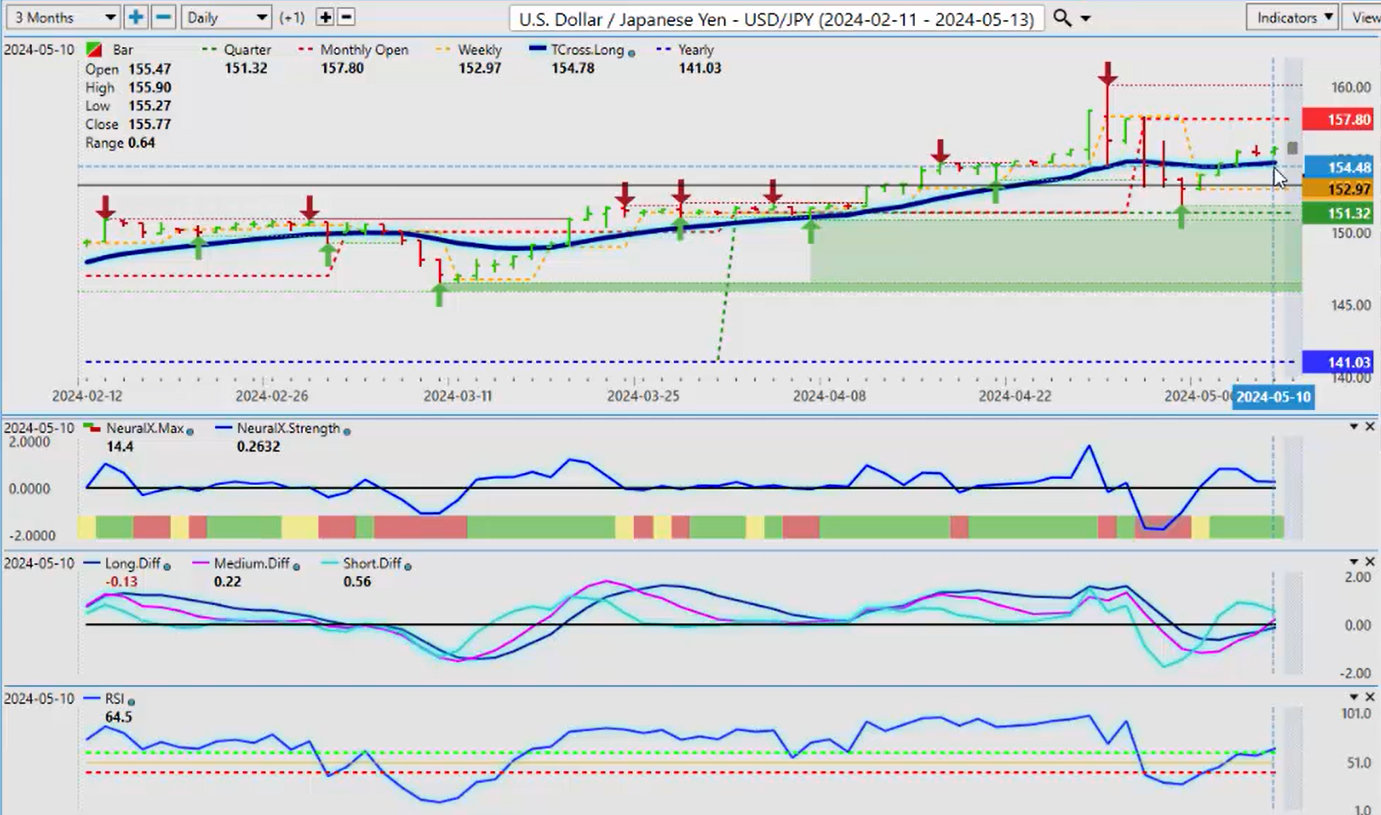
Now, the Dollar Yen —again, I will strongly advise to be very cautious with anything that has a Japanese yen in it. I think the Bank of Japan is going to be on the prowl again next week. Always look for intervention on Sunday or early Monday. They trade—this is what they do, okay? So, for now, we’re above our T cross long. I am neither a buyer nor a seller. I believe that we have better opportunity on other pairs without this guillotine hanging over our heads of the Bank of Japan—are they going to intervene or not going to intervene? Is the Fed going to hold? Is he going to cut? What’s he going to do? All of this is hanging in the balance of the carry trade, which that’s all the Yen is right now, a funding currency for the carry trade. Don’t forget that, guys. And when a carry trade, if you’ve ever experienced it, when it comes unwound, it’s not pretty, is what I will say. So our T cross long, if you want to stay with the primary trend, 154.78.
U.S. Dollar versus Canadian Dollar
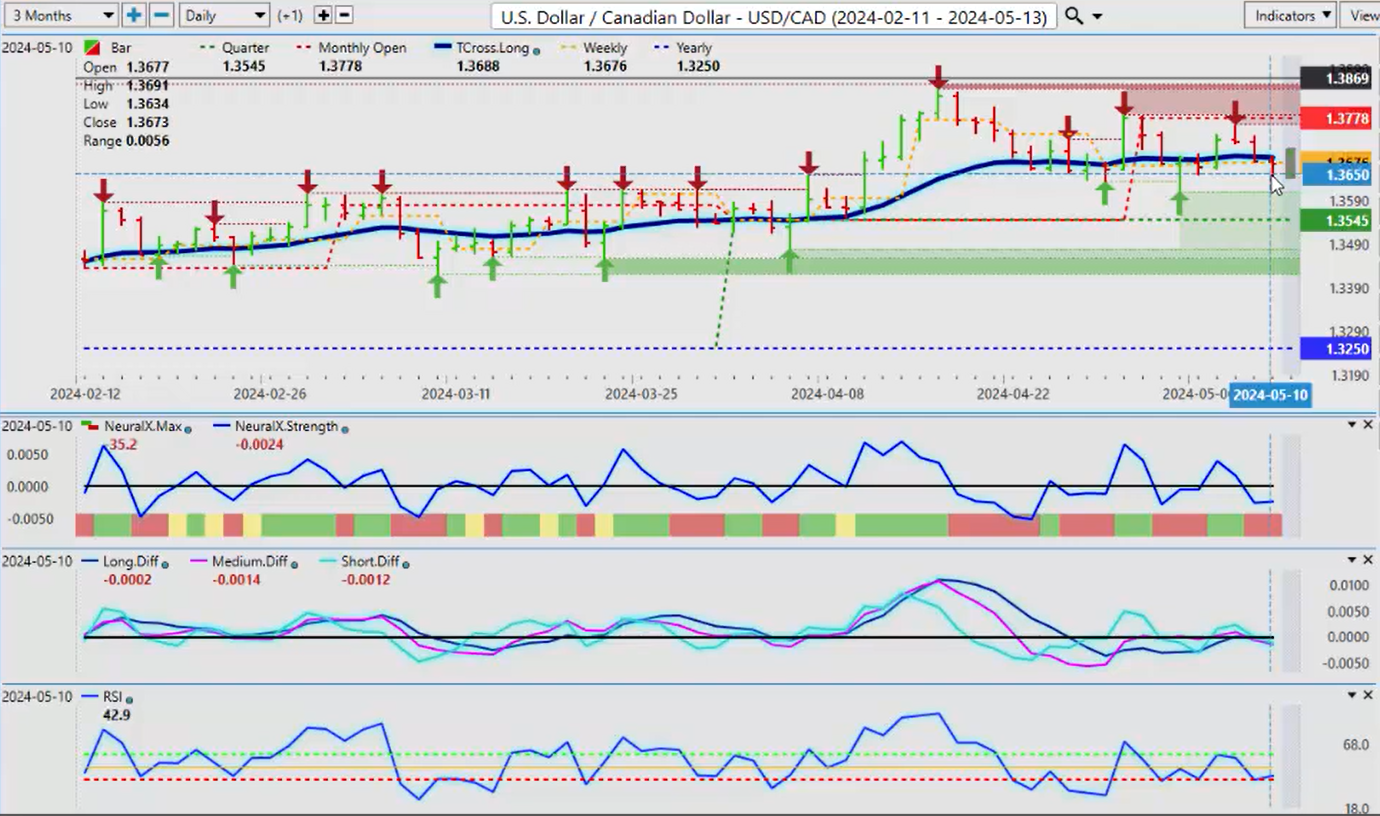
Now, the US Canadian pair—once again, we’re starting to show some mild Canadian dollar strength. I believe the rate cuts that are coming from the Bank of Canada are being priced in right now because when the rate cut actually comes out, very often shortly thereafter, the currency actually strengthens because it’s over, it’s done—it’s a buy the rumor, sell the fact. So we’re firmly below our monthly opening price, that is our key level here, guys, 1.3778. And then we combine that with our T cross long, just like I did with Gold last week, guys, 1.3688. You can see that as long as we can hold under that level and under the monthly opening price, we know we have there is a higher probability that there’s a seasonal pattern starting soon in oil that will favor the Canadian dollar. If the equity markets continue to advance, that favors the CAD, the Aussie, the Kiwi.
So, as long as we can do this, I think our retracement point here is 1.3545, the current quarterly opening price. If we can break down below that, we are likely, in the months ahead, going to target the 1.3250, the current yearly opening price.
Australian Dollar versus U.S. Dollar
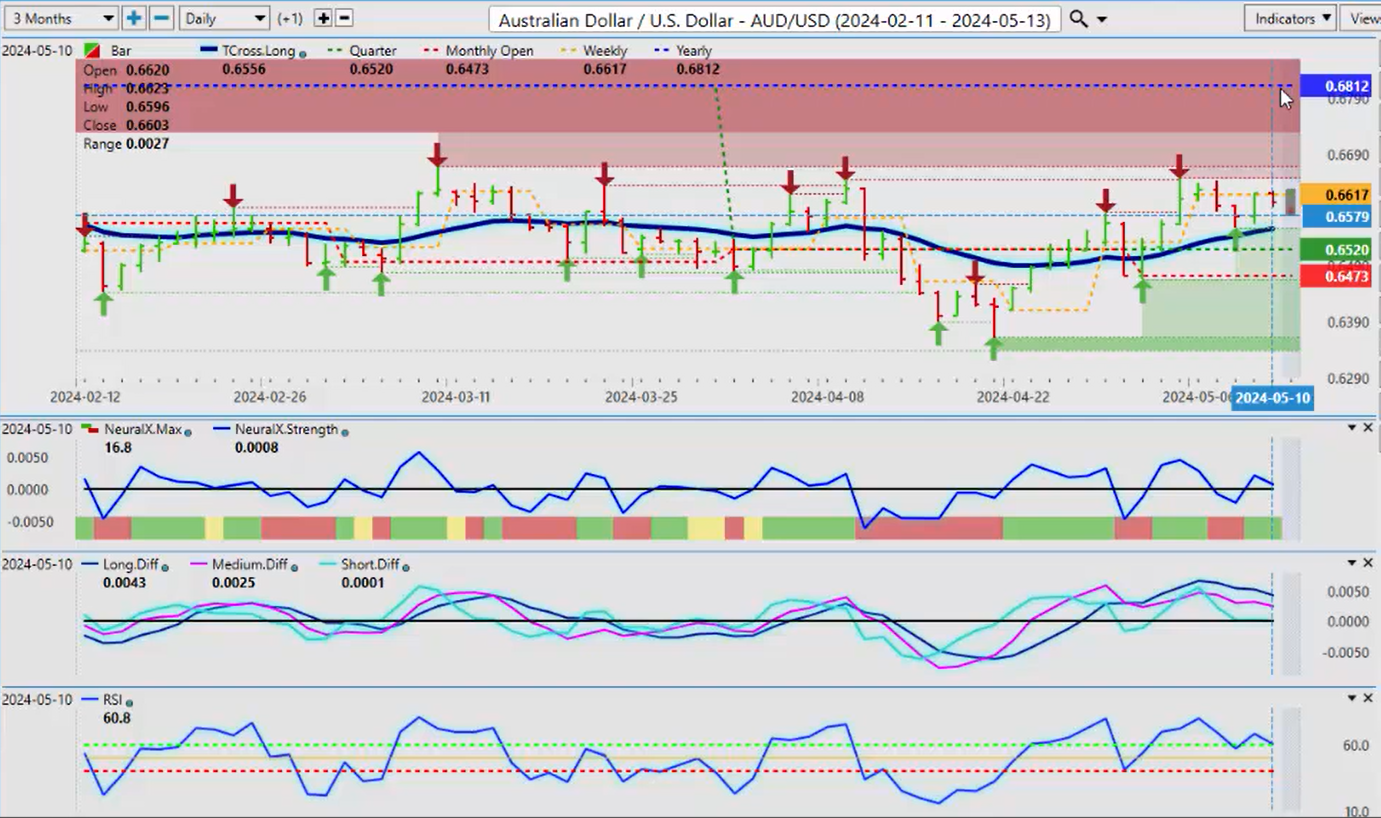
Now, the same thing is going to apply for Aussie and New Zealand . The Aussie currency is showing signs of life, but don’t forget, just like the CAD and the Kiwi, that we’re still below our yearly opening price, and if you bought the Aussie, if you bought the CAD, if you bought the Kiwi on January 1, you’ve never made any money on it; it’s been down the entire time. But knowing, armed with that knowledge, we can also say, look, if I can break through this immediate verified resistance zone high, 0.6647—and I will drop a side note to you Forex traders—0.6647 has been the sell point for the last three months in a row. So, in a tool like VP+, that when you move it over to the monthly chart, this is what most don’t see. So if I look at this and say, okay, 0.6659 for 3 months in a row, and I’m going to go out on a limb saying it might even be further—no, it’s not. We broke down below right here, and then we came up, and you can see that every single month, this pair fails.
So, an additional strategy that I can give you is putting a buy limit order just above 0.6650. So whenever this is done, assuming that the downside on the Aussie is done now—which I can’t do—our T-Cross long is at 0.6556. I think longs there are reasonable, and then putting additional buy limit orders once we break through these verified zones.
New Zealand Dollar versus U.S. Dollar
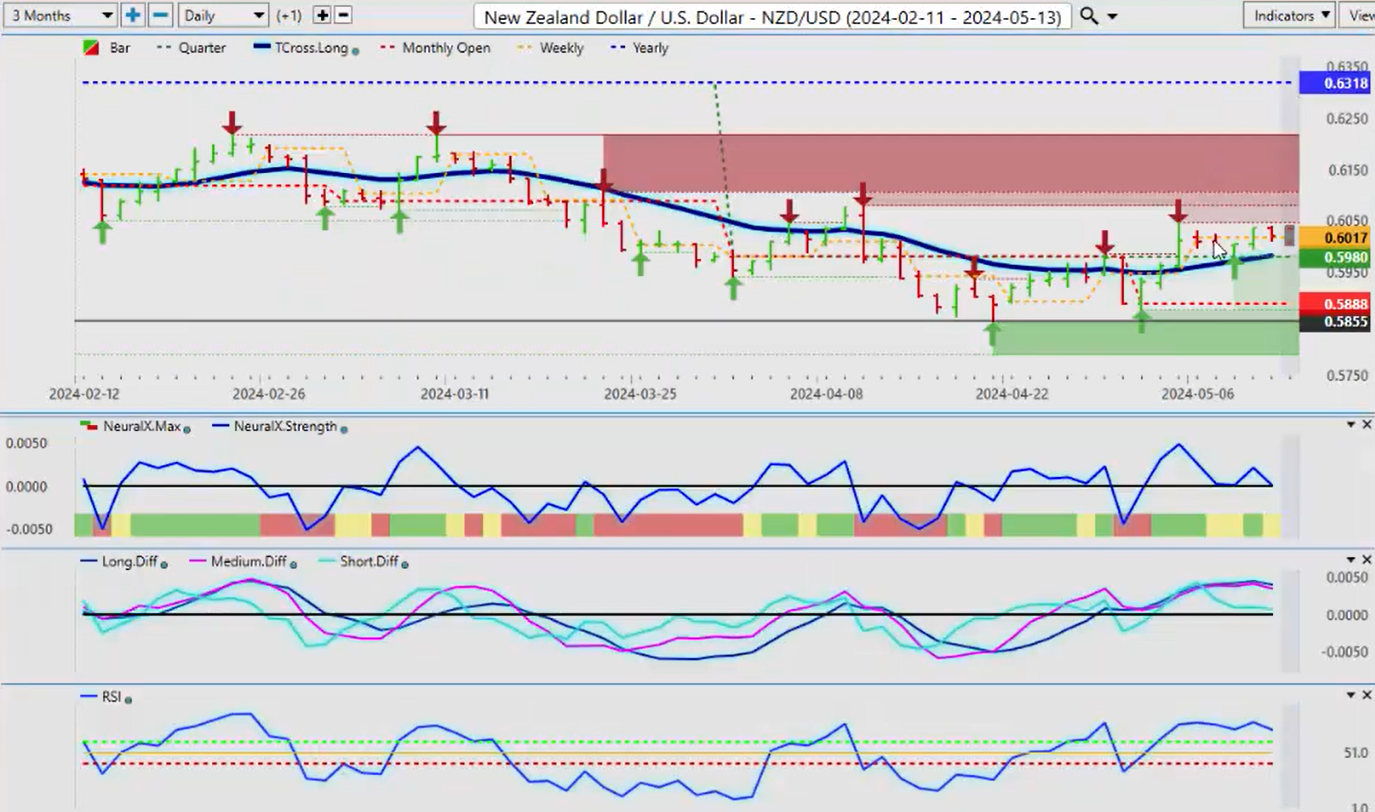
The same thing would be applicable to the Kiwi . In this particular scenario, we can assess here that once it too is trying to break higher, our yearly opening price 0.6318. The indicators, though, are saying we’re going to correct lower first. I think I would agree with that based on what the core indicators and the VantagePoint software is saying—that there’s a better than 60% probability that there’s still some Dollar strength here.
So, a bit of a mixed bag, but like any other week, the volatility will bring opportunity. So, with that said, this is the VantagePoint AI Market Outlook for the week of May the 13th, 2024.