-
View Larger Image
Welcome to the Artificial Intelligence Outlook for Forex trading.
VIDEO TRANSCRIPT
Hello everyone and welcome back. My name is Greg Firman, and this is the VantagePoint AI Market Outlook for the week of December the 11th, 2023. Now, to get started this week, we’re going to do things a little bit differently.
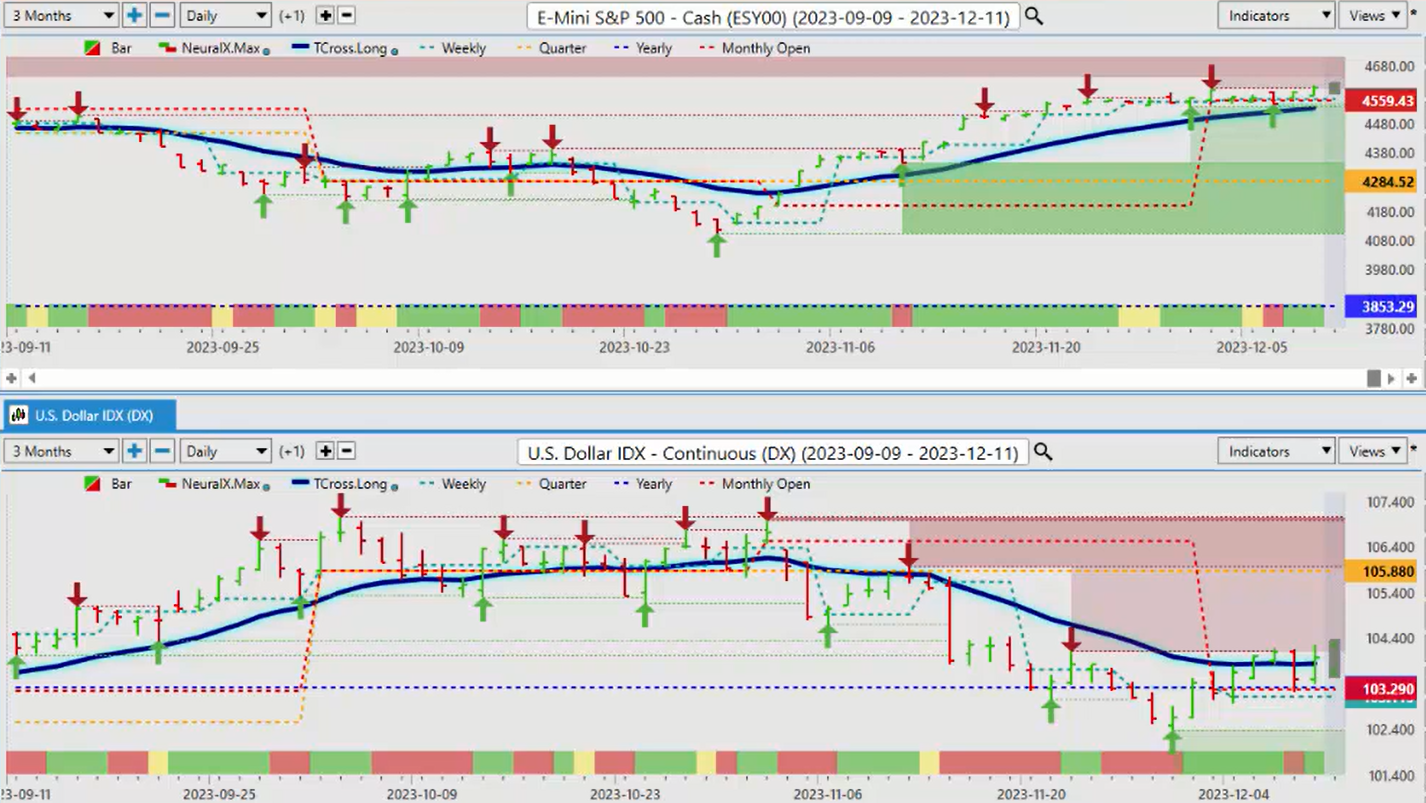
This week, we’re going into probably one of the final trading weeks of the year for volatility, that is, and we want to use our long-term Vantage Point indicators. So, in this presentation, we’re not going to do the Forex pairs, oil, Bitcoin in isolation. We’re going to do a comparative analysis using the Vantage Point T cross long, the long-term predicted moving average. Basically, the way we will define this is: if we’re above it, the market is primarily bullish; if below it, it’s primarily bearish. So, but at the same time, we’ll do a comparative as to what the intermarket correlations are. So, the main one we’ll see here is the S&P 500 or the spy’s or the equities in general to the US dollar. So, in this particular by splitting the Vantage Point screen, I can look at both at the exact same time instead of looking at them again in isolation.
So, what we see is whenever the dollar rises, the equity markets go lower. So, this most recent bull run, which has been pretty substantial in the S&P 500 going back into early November, that triggered a fairly significant sell-off in the dollar, and you can see that we’ve retraced multiple times back to that T cross long, but we’ve ultimately failed in the dollar. So, if we look more specifically at the US dollar, the payroll number, again, certainly nothing to write home about, a weaker number in my view, some of the revisions are downwardly revised, but the way the current market labor market is certainly doesn’t want more rate hikes. So, we’ll hear more from the Fed this week, but again, in a week like this, we don’t want to be using short-term indicators because they’re very reactionary to what’s going to happen with the CPI this week, the retail sales, and of course, the FED announcement.
So, but in most cases, the week after the non-farm payroll number, the dollar sells off either way. Historically speaking, over the last 5 years, the dollar has done very poorly in the month of December. If we look at it over the last 15 to 20 years, 80% bearish signal on the dollar. So, again, if we couldn’t rally that last year in the dollar, it’s going to be even more difficult for it to rally this December. So, as we can assess here, we’re getting all tangled up in that T cross long. Now, I’ve got my neural index here, but I also have the quarterly, the monthly, the yearly opening prices on here to gauge where we currently are this month. Again, we don’t want to move to a rolling performance model—5 days, 30 days, random days—we want anchor points in our trading; we want the first of the month, the first of the year, the first of the quarter, and the first of the year—very important.
So, the dollar is running along the yearly opening price. The monthly opening price is intersecting with that. This is all coming in around 10329, 10332, but our quarterly opening on the dollar, the dollar is having a very poor 4th quarter. When we cross-reference this to the S&P 500, our main support level, our T cross long is 4533. So, as long as we’re holding above this, the dollar will remain under pressure. Now again, it will be a very, very choppy week, and I don’t think the market will put bets down until at least we get that CPI on Tuesday, but I think the FED statement is more or less going to be a wash. I don’t think he’s going to hike; I think he’s going to talk about hiking and talk about cutting, but it will be data-dependent, so it’s a whole lot of nothing, guys, is what I would say.
So, again, we will watch that T cross long coming in at 10358.
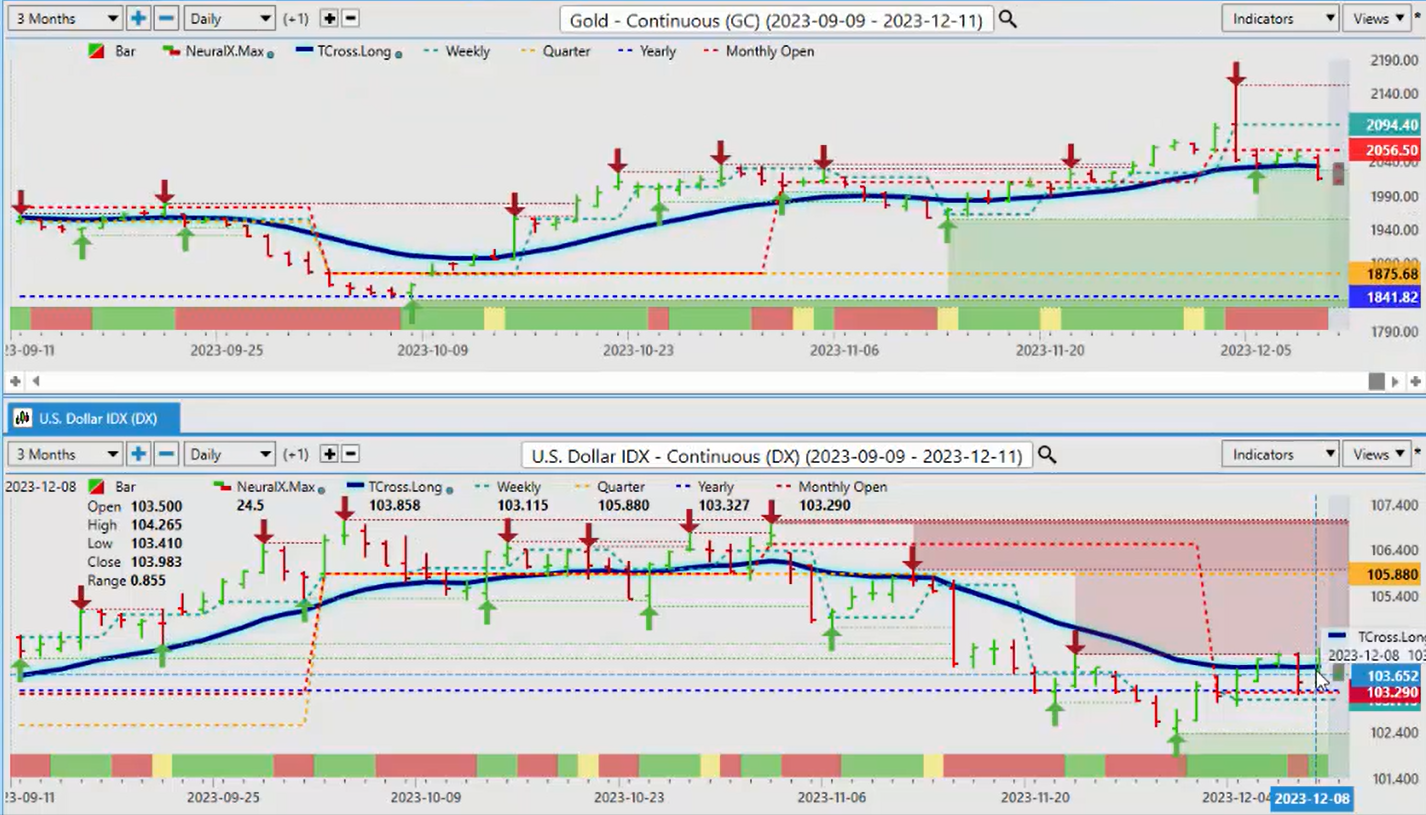
Now if we do a comparative to gold prices, again, that little bit of dollar strength we’re having this week, this past week, has pushed gold back down, but again, when we’re using the proper anchor points here, guys, this is the key thing. If I’m using a rolling performance model and trying to gauge performance on 30 random days, it would be very difficult to get an accurate price; you’d be reacting every week as it moves. So, our anchor point is pretty strong on the monthly opening at 2056. So, as you can see, every single day this week, we’ve been banging into that monthly opening price, and then we pushed down on Friday on what the market perceives to be a better payroll number. But again, in my respectful opinion, it was not; it’s basically showing a cooling labor market. So again, I think that it’s a good buying opportunity.
We can assess here that the quarterly opening price coming in at 1875, the yearly opening price at 1841, they’re stacked in there nicely. We’re just getting some resistance coming in at the weekly opening and that monthly opening price. So, once we get it, if we can get back up above 2056, then gold should start moving.
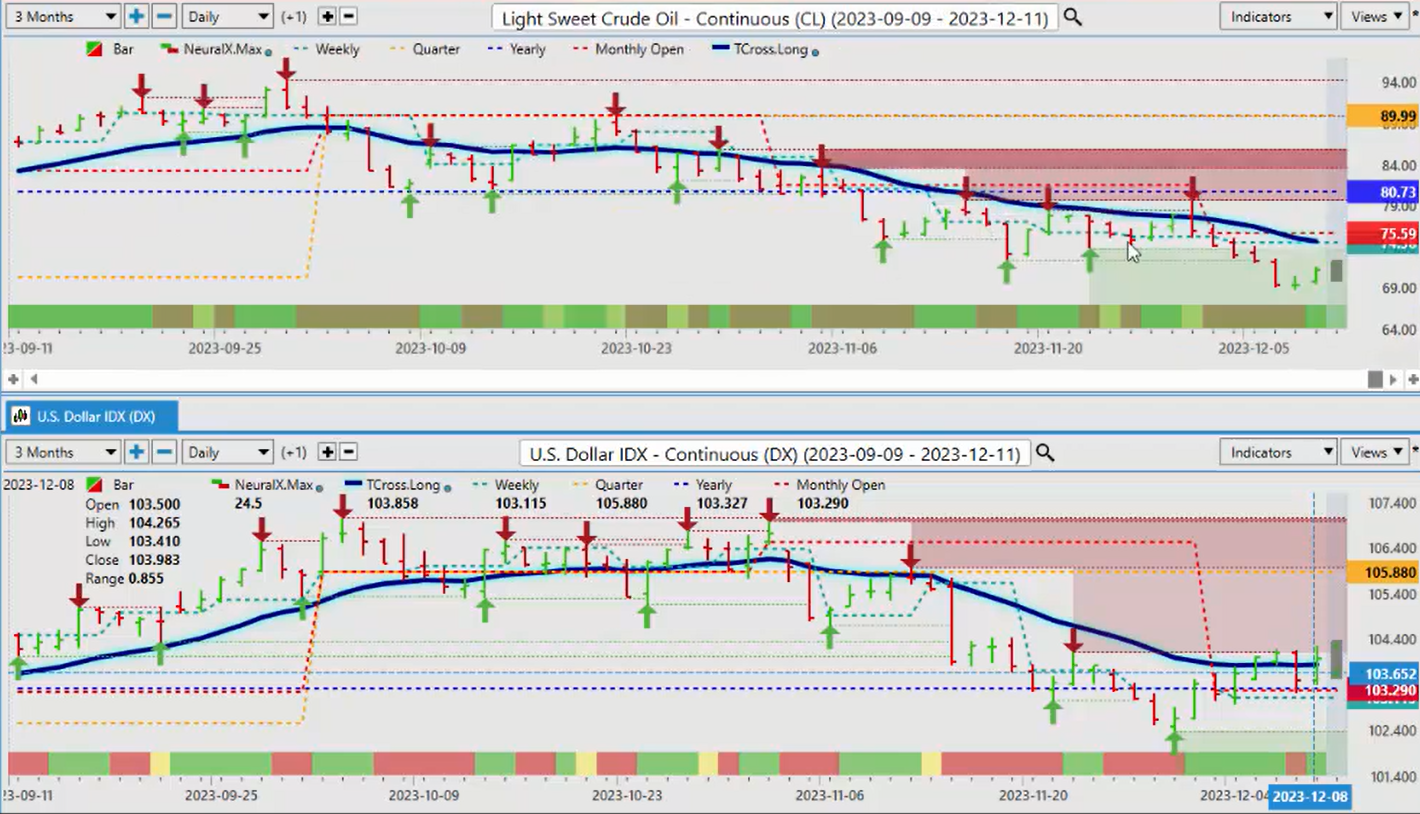
Now, when we do that comparative to oil, we talked about it last week, once again using that T cross long, the single predicted long-term predicted moving average to gauge our retracement points and potential entries.
So, once again, the market is again pushing down. We’ve got a little bit of life in this, but what we can assess is there’s actually a fairly strong correlation between light sweet crude oil and the dollar index. So, potentially, there’s two trades. If the dollar follows its normal monthly and yearly seasonal patterns, the dollar goes lower; that would tell me that oil would be going lower also. I believe that they’ve misinterpreted that labor report. When you look deeper inside that report, the worse it gets. So again, dollar moves lower, and if there’s basically about an 80% to 90% positive correlation to oil, then again, it would go down lower.
Now, if the dollar moved higher, broke its cycle, and moved up in the month of December, that would suggest that oil would move up with it. So again, when we do that comparative analysis with them side by side, then we’re not looking at it in isolation; we get a much better view of what’s actually happening here.
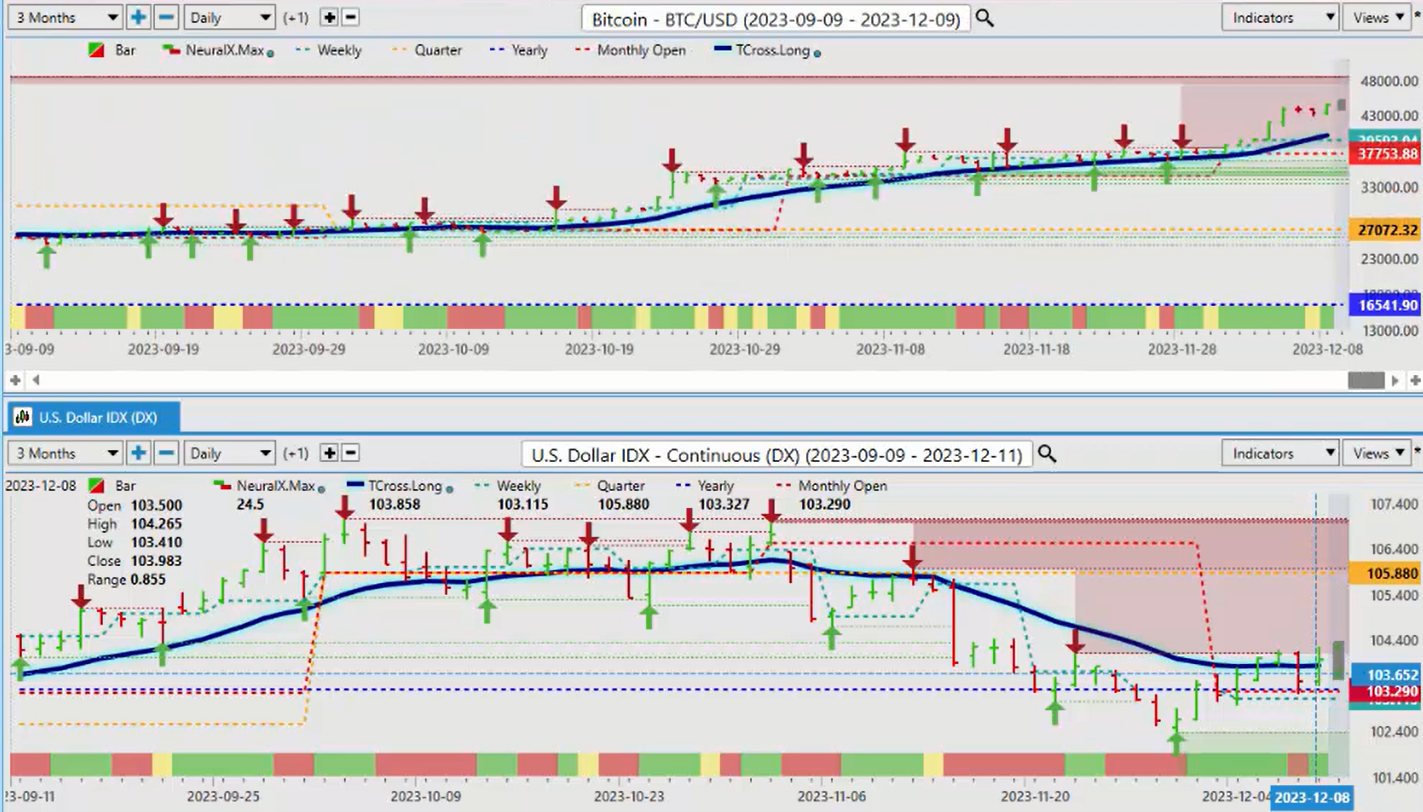
Now, with Bitcoin contracts, once again, Bitcoin making a pretty aggressive move over some of the data that’s come out this past week, but once it made its move, we’re really starting to stall out up here. Not a lot of buyers around this 45,000 mark. So once again, we would look for a retracement back to our T cross long; that would be 40,263. So yes, we think that Bitcoin can go higher and likely will go higher in 2024, but we look for an accurate retracement point, and that T cross long would be that the neural index remains green.
In the case of Bitcoin, we’re above our weekly, our monthly, our quarterly, and our yearly opening price. You can see they’re all stacked in line, and again, as long as the market remains above these critical areas and the T cross long, it produces a bullish continues to produce a bullish signal. But my concern here, we’re in a very data-heavy week this coming week, so I would be looking for a potential retracement back into this 40,263 area.
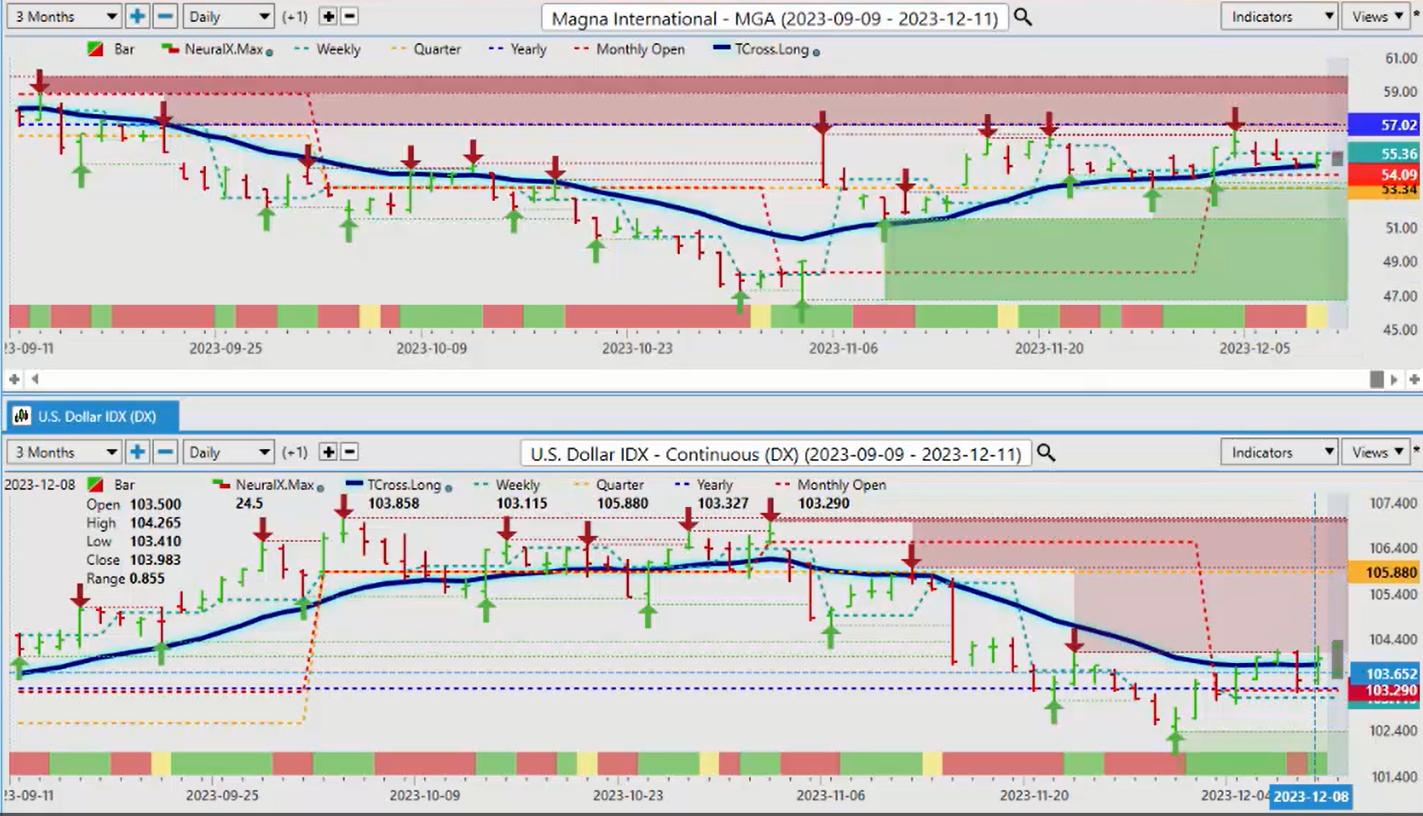
Now, when we further look at this some of the correlations here over the years that I’ve noticed with the Vantage Point software, this one’s particularly interesting: the Magna International stock. Now, this has been about a 92% inverse correlation. So, with this Magna stock, if this stock continues to hold above the T cross long at 5465, not only is there a long trade on Magna stock, but it’s also that confirmation that the dollar is getting ready to sell off again this month.
The next known seasonal pattern for the dollar would be in February. So again, the bias would be higher for Magna, higher for the S&P, higher for gold, but they’re all tied to the dollar. As Magna was going lower back here a few months back in September during that period of very extreme dollar strength, it pushed the Magna stock. But when the dollar turned and started moving lower at that exact same time, the Magna stock started to move higher. So again, we’ll watch this one next week, but if this stock continues to hold above the Vantage Point key levels, then again, that would confirm that the dollar is likely moving lower.
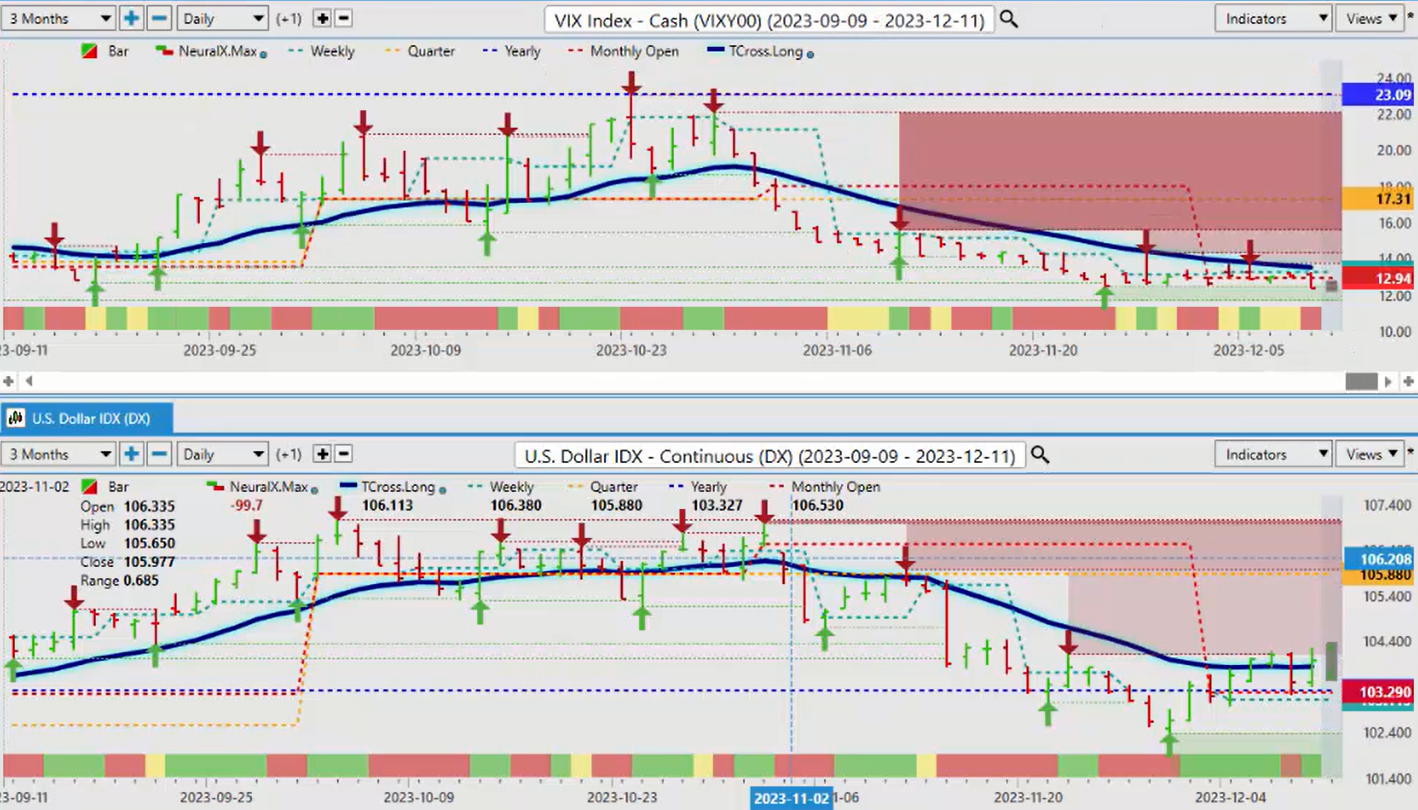
When we look at the VIX , the VIX is about a 98% positive correlation to the dollar index. We don’t have a buy signal or we don’t have a confirmation of a reversal on the VIX just yet.
So right now, our current monthly opening price on the VIX is coming in at about 12.94. If that holds, then again, we would say, “Okay, equity markets higher.” That’s again going to confirm that the dollar would be moving lower into the end of the month and potentially January also.
But that VIX level of 12294 is very important, equally as important as when we look at another inverse correlation with Magna. So that level, again, 5465, the longer it holds, the better a long trade would actually be on this. So again, it’s these types of inner market correlations that are driving factors in what we do, but understanding these inner market correlations is the main thing, and then applying the indicators.
So as we look at some of our main Forex pairs going into this week, there are certainly signs of some dollar strength this past week, as we can see with the Euro .
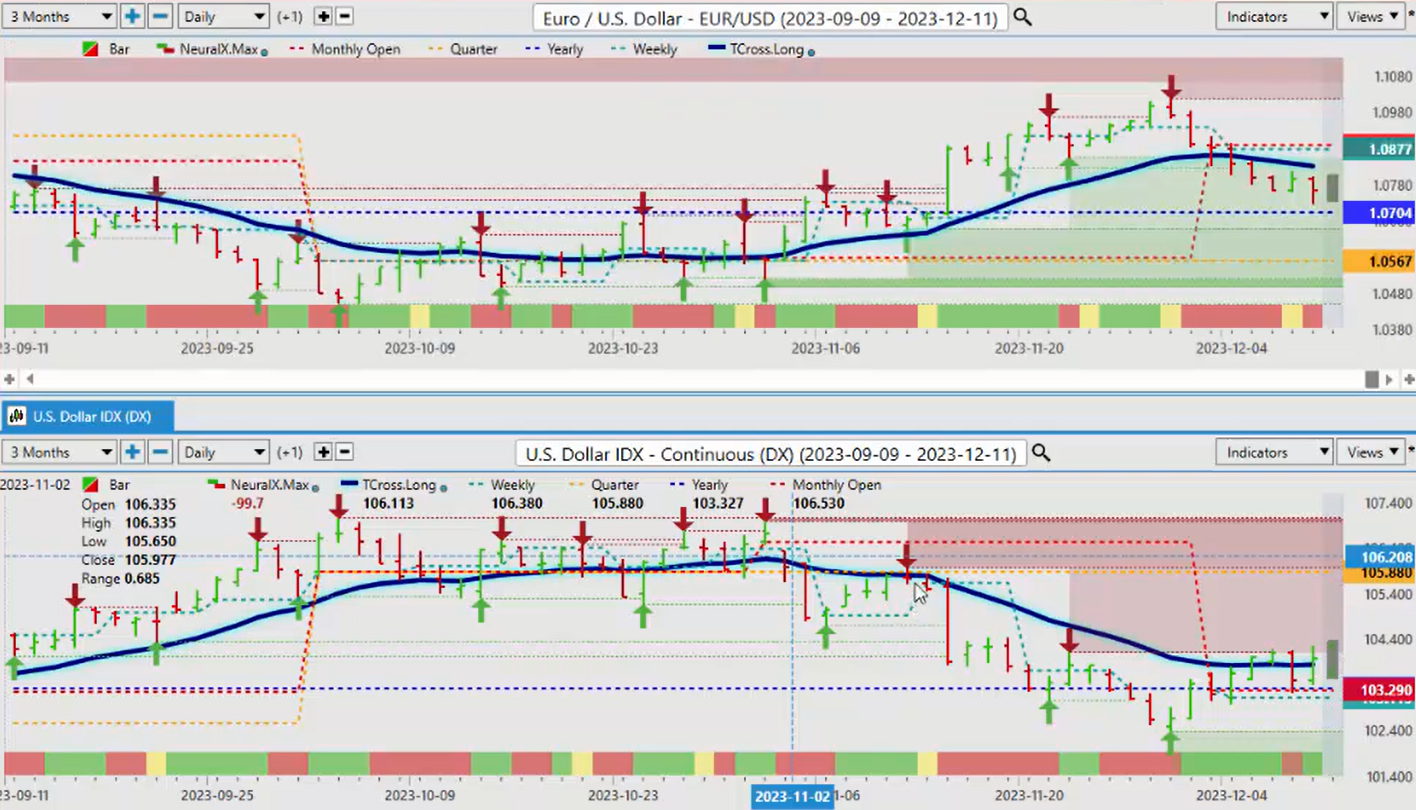
Now, again, when you’re trading the Euro US pair, there is a 99.99% inverse correlation to the dollar Index; when the dollar rises, the Euro US pair goes lower. So right now, the Euro has basically struggled at the beginning of the month, but this is part of a known period of dollar strength. I’ve coined the phrase ‘dollar cycle.’ That dollar cycle means real money must buy dollars at the beginning of the month; they don’t have a choice. Remember, a currency is nothing like a stock; nobody is required to buy a stock, but governments, high-net-worth individuals, etc., are required to buy US Dollars, Canadian dollars, Aussie dollars, Euros, etc. So, again, a very different type of market. With the Euro, we’ve got pretty heavy support; we’re going to be coming into next week 10407, 10567 on the quarter. But unless we can make a sustained break of the yearly opening price, then this is a corrective move. So once again, we want to make sure we’re looking and monitoring that dollar Index to see what it’s doing, monitoring gold prices and Bitcoin, but particularly monitoring the S&P 500. If it continues to advance, then that will give us that confirmation the euro is likely to reverse and go higher. But 10704 is the main level to keep your eye on next week. But again, mildly bearish, but I would argue this is more corrective in nature at the current time.
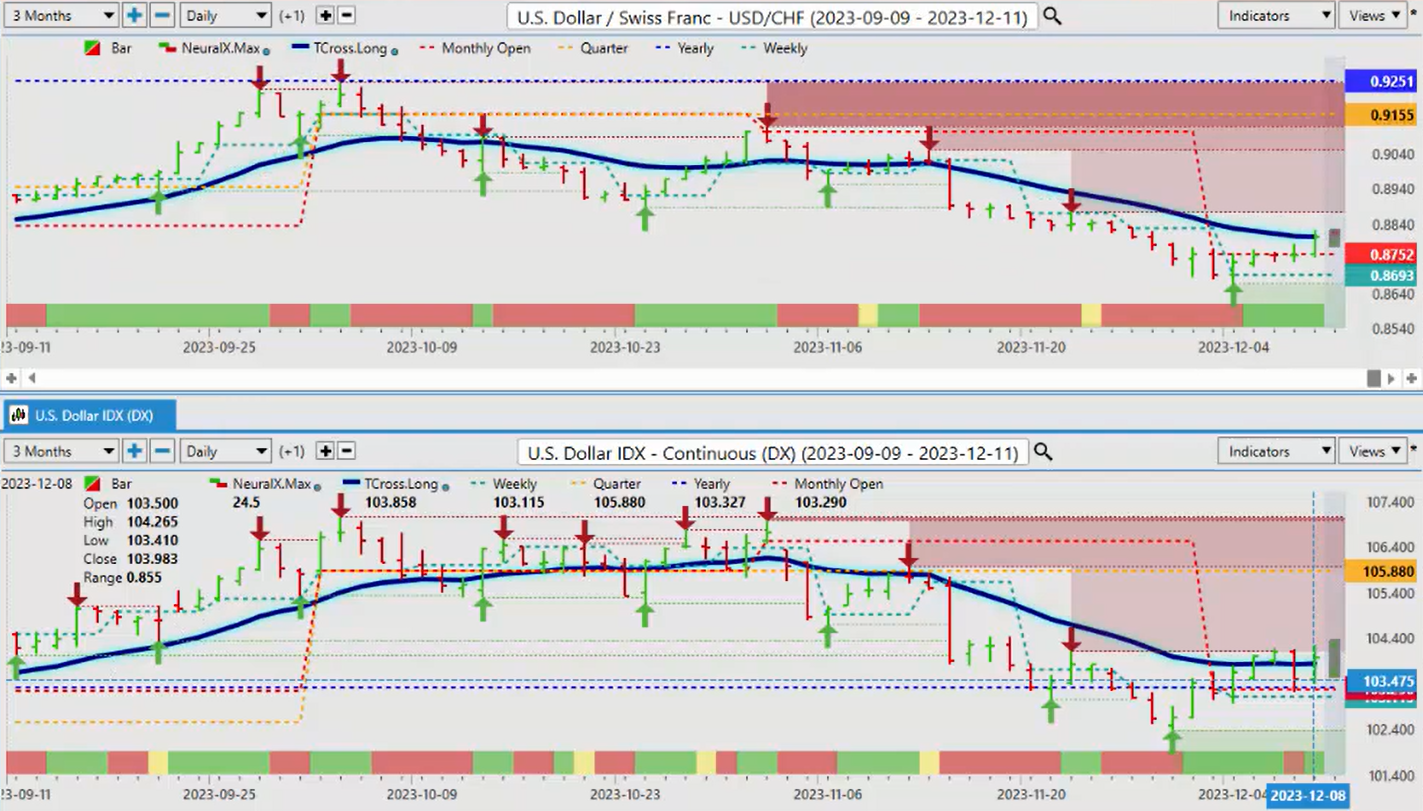
Now the US Swiss franc, US dollar versus the US Swiss franc, excuse me. You can see that there’s about a 98% positive correlation; dollar down as this particular Forex pair goes down. So once again, we’re stalling on Friday, exactly on that T cross long coming in at 8802. This level here is critical. If the dollar Index fails, then this is a very good opportunity for a potential short going into the remainder of the month and of course January. If we look at the predicted high for Monday 8821, then we can say, ‘Okay, 8821.’ Our T cross long that’s coming in at 8802. So all of our resistance there, there is no Gap to be filled here, is the point that I’m making. So it’s either going to this level will hold and there’ll be a good short going into Tuesday, Wednesday, Thursday of next week, or it breaks through early. But keep an eye on that particular level. Right now, the neural index is green, but we are firmly below the yearly opening price.
Now when we look at that, you can see that we’ve had multiple tests of the yearly opening price up here at 9251, and we failed significantly each time. And that’s why it’s very important that you’re using prop anchor points, the current yearly opening, the current monthly opening, the current weekly and quarterly openings, because again, these are anchor points, guys. We don’t want to keep moving the goal post every week. It just becomes confusing as to what the actual performance is, right?
So again, still very uh bearish on this on the year. We’re challenging that monthly opening price, but we must clear that T cross long.
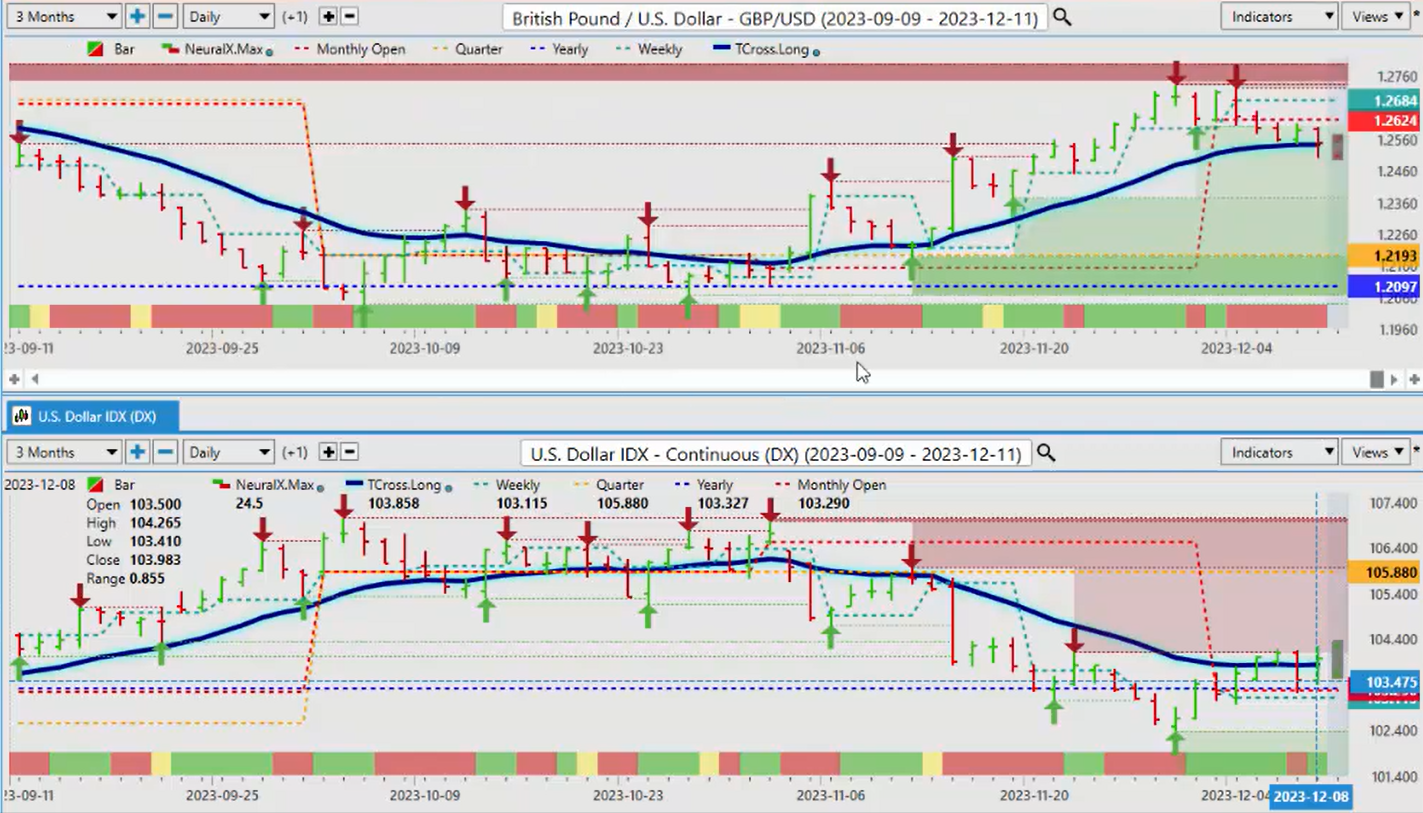
Now when we look at the pound dollar for next week , once again, the pound dollar is sitting right on our T cross long, but we are firmly above our yearly and quarterly opening price, so that T cross long needs to hold here, guys. So by Tuesday, Wednesday, of next week, we want to see if we’re holding above 12544. But that will be our main focal point of our trading this week is, is seeing if we can hold above that.
Now again, we’ve closed at 112, uh 12549, excuse me. So that’s going to be around our our weekly opening price for next week. So the weekly opening price, the T R cross long at 12544, uh, if we’re holding below that level, then short term, there’s sales may work. But I would be very, very cautious going into this Fed announcement because I don’t think you’re going to get a hawkish Fed. I think he’s going to have a very difficult press conference, actually.
So again, as long as we can identify this area, we can trade that.
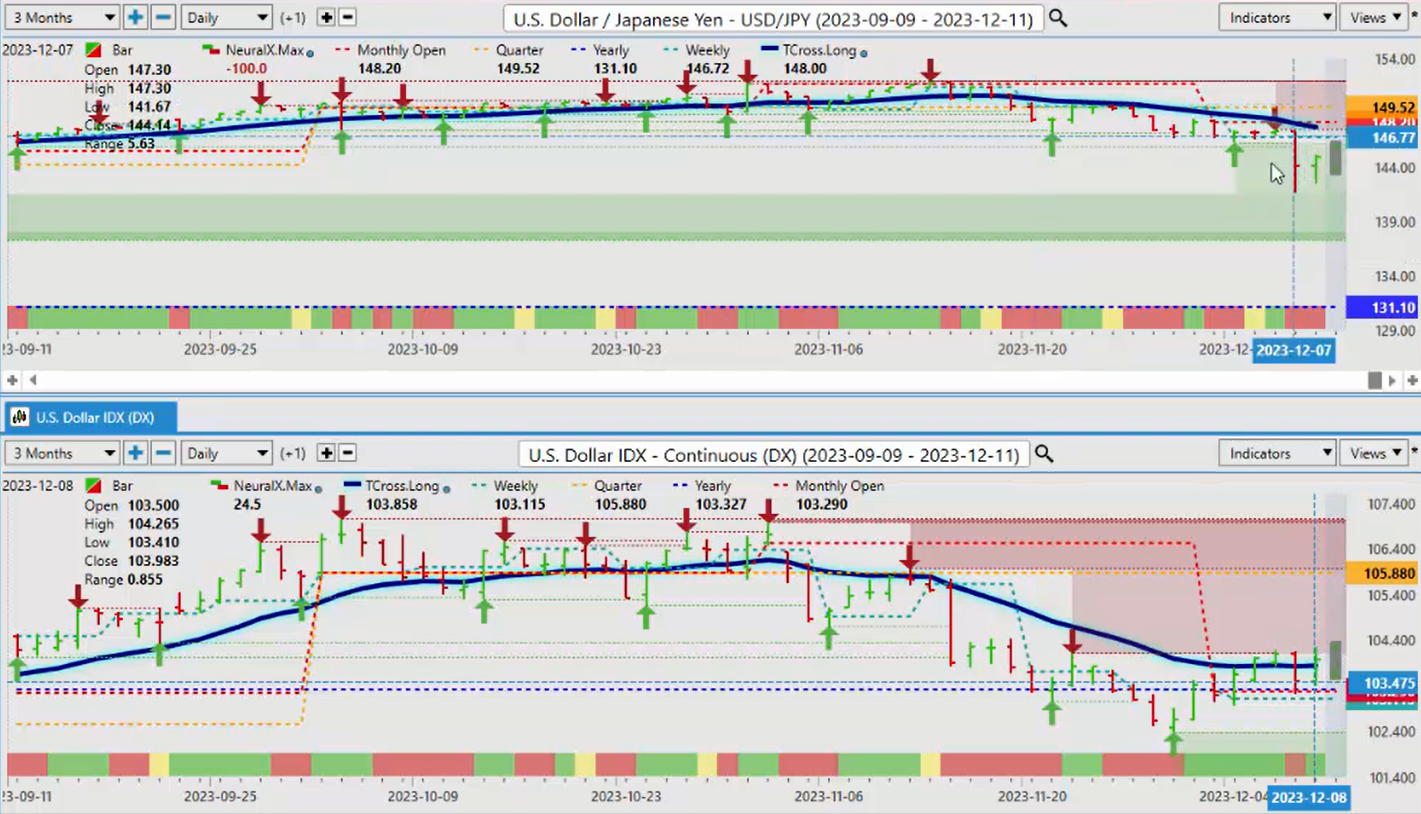
Now, again, if we’re looking at the dollar Yen , but we’re not looking at it in isolation as I had talked about earlier this month, that I am not a a seller of the yen in the month of December because of that seasonal pattern. So right now we’ve had a couple of very volatile sessions here. But once we broke through the T cross long back here, we came up and tested that level three four five times and then we came down hard.
Now on Thursday of this past week, same thing, it got close to the flame and down it went. So right now we’re still bearish, but we’ve got a little bit of a gap to fill here. Our T cross long, 14769. Keep an eye on that as your as a retracement point. But we would also use our monthly opening price which is again 14820. Last week, 14672 was our weekly opening price. And as you can see, it was just too much for the pair. Uh, but again, this still is a carry trade. But if the Fed makes any hint at possible cuts, the interest rate differential in the carry trade will change. Uh, and it will become less attractive for holding dollars, not. It’ll be more attractive for holding Yen, either. But it may prompt people to take profit on the carry trade, thinking that the Fed is going to go into two three rate hikes next year. So that’s something to watch.
But right now I believe they are slowly exiting that particular carry trade.
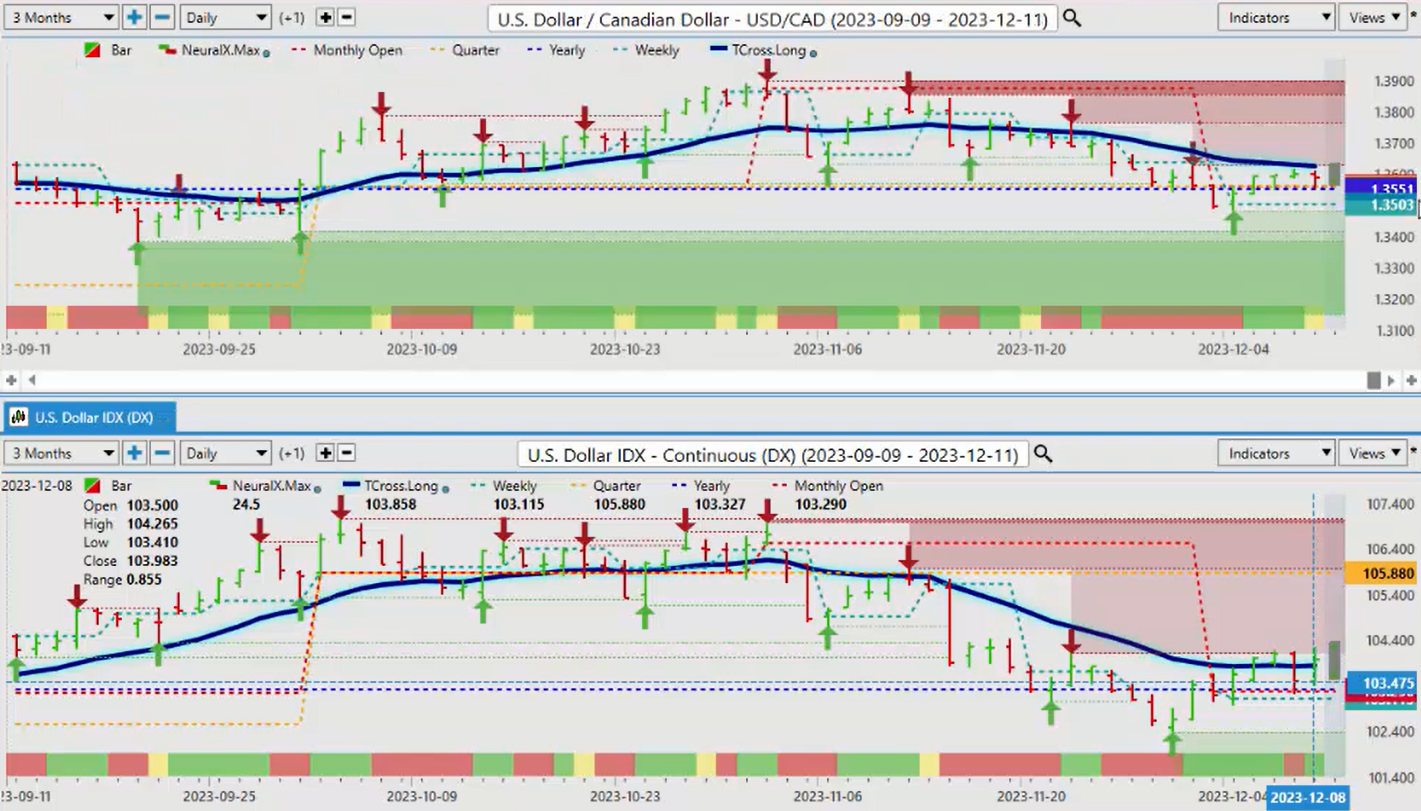
Now when we look at the US Canada for next week, once again we can see that as when the dollar Index moves lower, US Canada moves lower. So we’ve come up to our T cross long on Thursday of this past week. We failed at that level and move lower. But we’re a lot of activity around the current monthly and yearly opening price, 13562, 13555. All of our resistance is sitting right right there. So, uh, I think it’s unlikely that we’ll break through this area. So when we look at our predicted high for Monday, because again, this is an Outlook, guys, not a recap of something that’s already happened here. So the predicted high is coming in at 13631, and our T cross long is coming in at 13624. So right now there’s a very slight short bias to this, but we would need the equity markets going higher, the dollar index going lower. But again, you can see that this correlation is about 95% uh positive, both positively correlated. So basically, the US can US dollar Index goes lower, US Canada goes lower. So we’ll monitor this one, but this pair will be choppy next week.
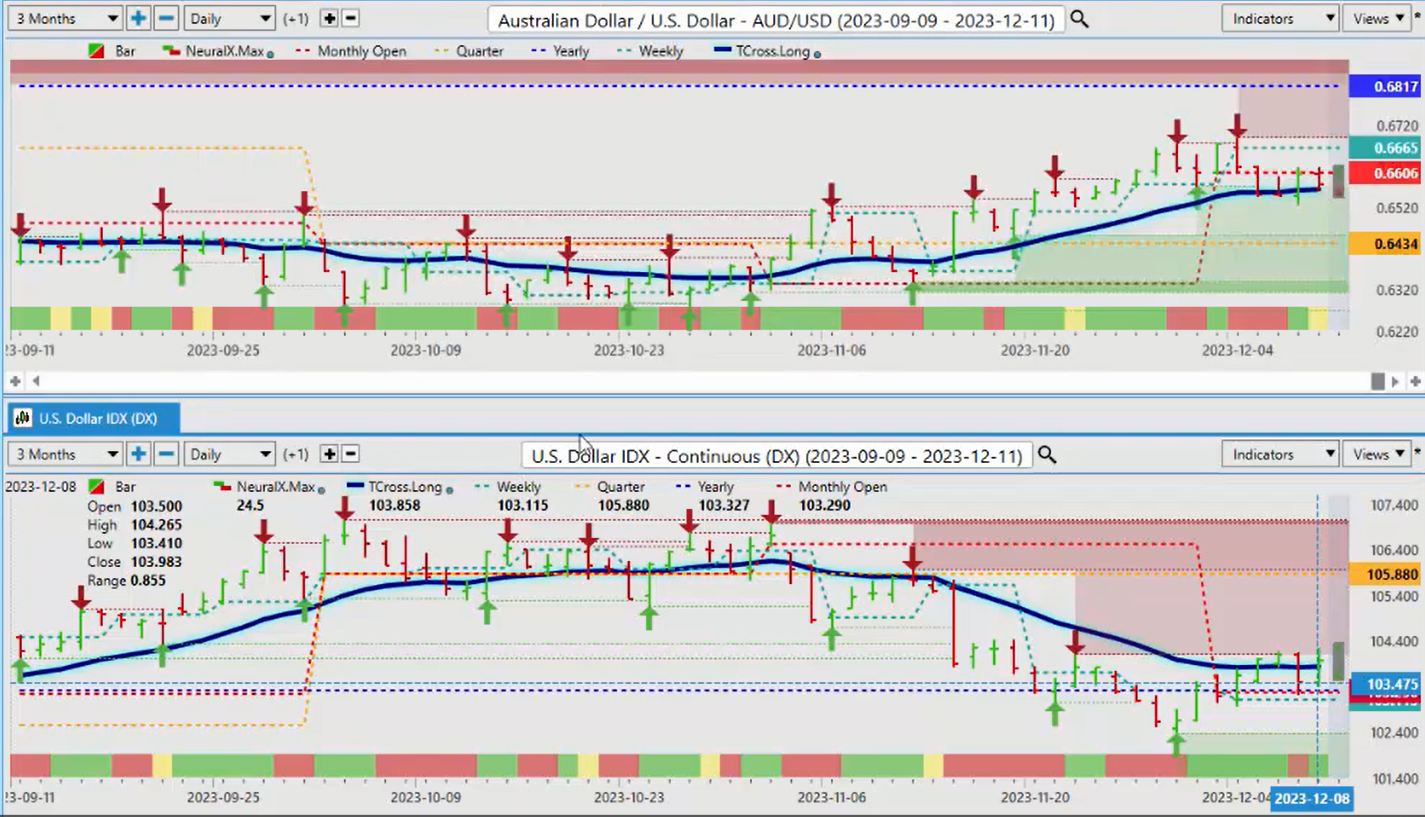
When we look at the Aussie US pair, uh, another great example of leveraging price versus the predicted moving average versus inner Market correlations and staying present and having proper anchor points in your trading. So the monthly opening price basically contained Longs the entire week after we broke down below it on the Monday. So we’ve come up and tested that but you can also see that the T cross long provided heavy support for this pair on the downside that t cross long coming in at, 6565. Our quarterly opening price, 643 for as long as we’re above that area there’s still a bias that we can go higher with this pair. But we do need the dollar Index going lower and stocks going higher. The Aussie, the cad, the New Zealand, they all respond very positively, meaning they’ll buy those currencies if the S&P and the global stock markets are healthy and moving up. So the bias is higher on the Aussie based around that particular uh, correlation to the equity markets.
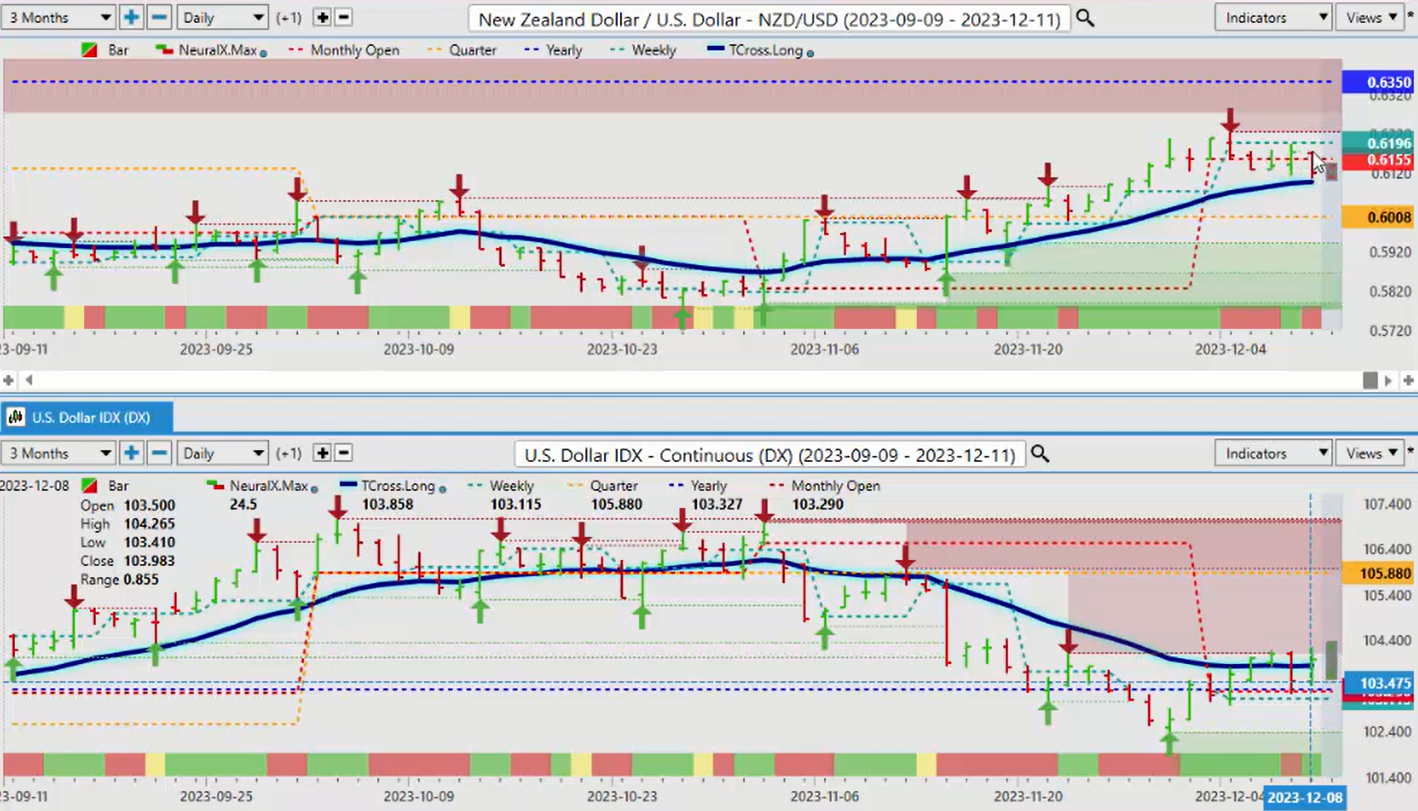
The kiwi, very very similar you can see that we’re basically moving back and forth between the weekly and the monthly opening price. Our T cross long here for next week 6097. Once again if we get our stocks moving higher then we have a go to buy Aussie us buy New Zealand Us sell US Canada and indirectly buying pound dollar euro us and shorting the dollar Yen but the main thing is that we can see these inner Market correlations one goes down, and one goes up. So even though the the Aussie and the Kiwi don’t make up part of
the dollar Index they still are affected by US dollar strength and weakness. So again we will have a very data heavy week next week, but with that we come opportunity providing we understand these correlations and apply longer-term indicators with price analysis. So with that said this is the vantage point AI Market Outlook for the week of December the 11th, 2023.