-
View Larger Image
Welcome to the Artificial Intelligence Outlook for Forex trading.
VIDEO TRANSCRIPT
Hello everyone, and welcome back. My name is Greg Firman , and this is the Vantage Point AI Market Outlook for the week of December the 4th, 2023 . Now, as we move into year-end, uh, we do have, we’re likely to still see some volatility in the first, 10 to 12 days of the month. So, let’s begin with the Dollar Index .
U.S. Dollar Index
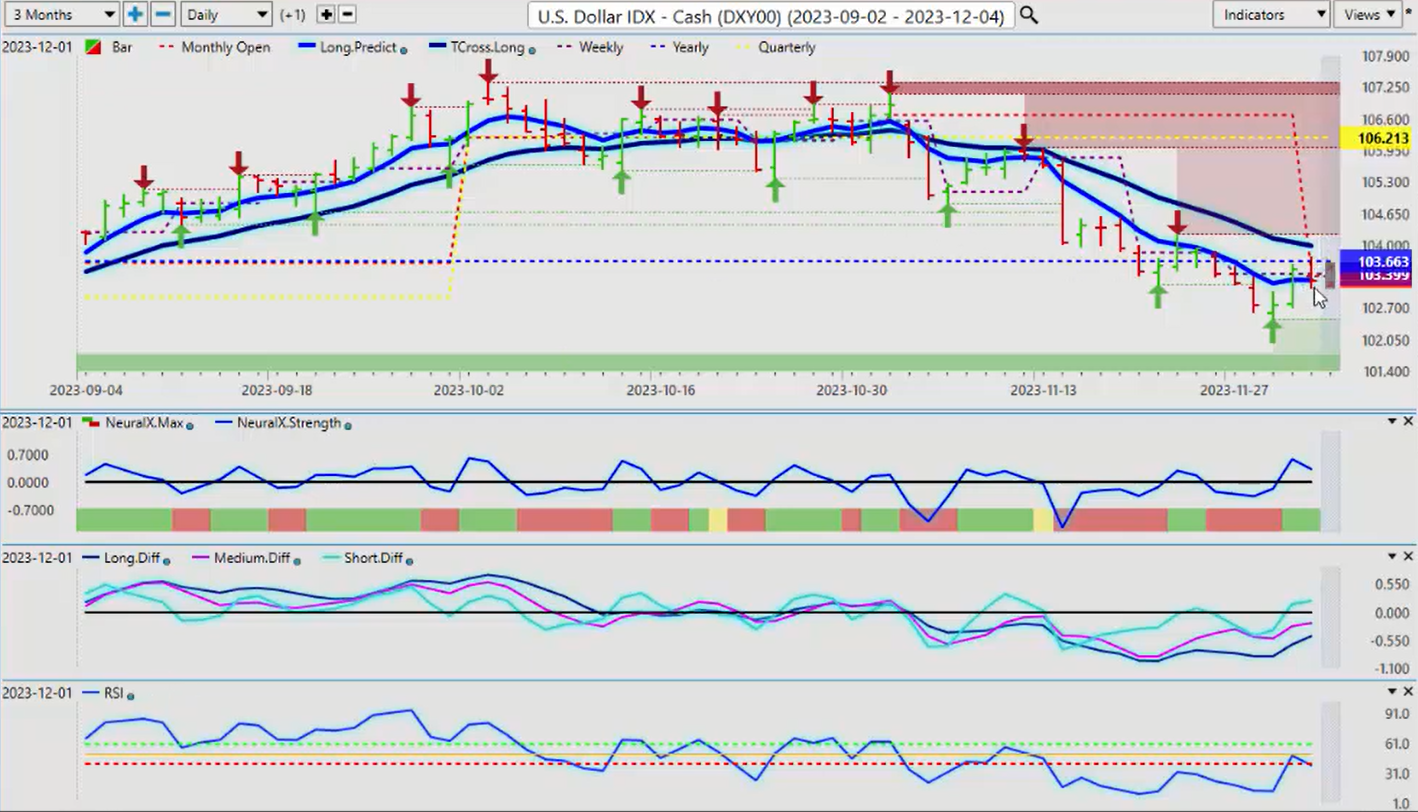
Now, once again, we want to make sure we’re using the current monthly, yearly, quarterly opening price again rolling performance model is in most cases lagging and can provide false signals, as we’ve seen many times in this calendar year. So, the current monthly opening price is coming in at about 10335 . We have the current yearly opening price at 10366 . The quarterly has firmly shown the Dollar’s downtrend long before it actually started to move. It was struggling holding above these particular levels. But when we bring all this together with the Vantage Point Long predicted and and our T cross long , it allows us to isolate very specific levels and then get validation from the point in time indicator, meaning that as long as we can hold below that monthly opening price at 10355 and the yearly opening price at 10366 , then the T cross long at 10397 should provide additional an additional backstop of resistance for selling dollars.
Now, the month of December historically is very, very poor for uh, for buying US dollars, but we will get some buying in most cases the week of the non-farm payroll, which is next week. So again, the Tuesday after the non-farm payroll number, either way, the dollar usually sells off, but in the month of December, it’s particularly weak. So right now, our structural bias, the indicators are starting to rise slightly here. We got a little bit of volatility there on Friday from the FED comments, but not enough to get any real dollar buying. But I do believe we will see some next week. But either way, we would be looking at shorts into that uh, T cross long , should we be able to pass over the current yearly opening price because again, guys, if I took a random 365 days and went back and said, okay, well, that would put us up here somewhere, uh, one could even interpret that as it’s somewhat bullish, uh, but again, the using proper anchor points in your trading will help validate weekly, daily, and monthly trades. Very, very important.
So the indicators and Vantage Point slight bit of a the neural index strength is picking up on a little bit of uh, weakness here but not an overlot over an over amount, excuse me, we’re still above the zero line. Our predicted short, medium, and long-term differences are rising. Now the predicted RSI is sitting at 38.4 , and basically, I’ve got a 60/40 split here because again, I’m not interested in buying overbought oversold signals, uh, no, I don’t want to tell the market which direction to stop and turn and go the other way, uh, because again, you can see that you can go into an oversold condition many times just as a rally is starting. So we want to be very cautious with that. Before we want to look at buying US dollar, I would want to see the predicted RSI above the 60 level, and I would like to see, preferably, the market above the Vantage Point T cross long at 10397 , but I think that is very, very unlikely, uh, going into the month of December or as we move forward into the calendar year-end because remember, this is the fiscal first quarter for the US, the fourth quarter that ended on October 1 , and that’s usually it for dollar strength to any real sign significant amount.
S&P 500 Index
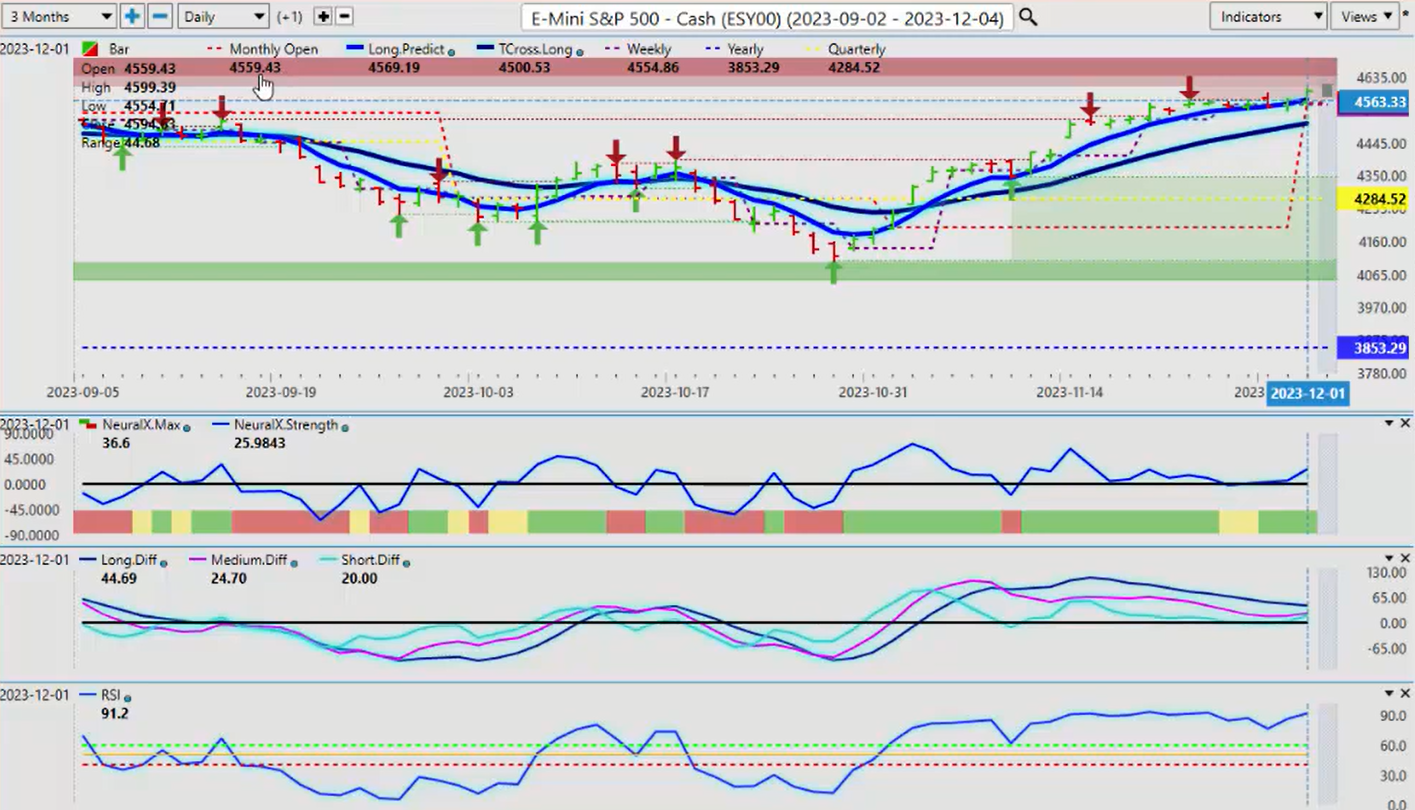
Now this Rally or this uh, rally to the downside, I should say, the selloff in the dollar is pumping life back into the stock markets, but once again here, guys, we want to make sure we fully understand where we are in this particular rally. So if we use the current monthly opening price, very important, 4559 , we are firmly above the yearly opening price, and again, going back into March when we looked at that and the markets, uh, the analysts are saying all the equity markets are in, in bear Market territory and then for it to turn around and rally almost 20% is somewhat comical, but again, with that rolling performance model, it often gives false and misleading information. So at that time in March, you can see as we go back here into that time period that using that current yearly opening price, it allowed us to basically say, well, wait a minute, the Market’s not actually inator bar territory, it’s positive, and then we’ve had a significant rally off of that particular area back in March.
So again, if we look at things where we’re at right now, then the there’s several arguments that could be made, uh, that we’re overbought, but again, always look at this, guys, we’ve been technically overbought on the RSI, uh, since the beginning of November. So if the market does finally turn lower, then does that validate the overbought condition? My argument would be no, it doesn’t validate it. So what we need is to the validation of that is to break down below the current monthly opening price and the Vantage Point T cross long that level is coming in at 4500 . The quarterly, the equities are having a very very good, uh, quarter here, and you can see that this was accurately forecasted back on the beginning of November. We I actually did it in this particular presentation on the week saying, okay, if we can cross over these two predicted moving averages, then we can extend higher. But as you can see, while the predicted high and predicted low for the day are, are, are very, very powerful tools, uh, one of the questions I got from last week was saying, well, I’m not really getting a pullback to the Daily predicted low to buy this. So this is the advantage of using the f8 , which is the long-term Crossover with just the predicted moving average, and you can see that every day we’re in constant contact with, with this, with this blue line, and that can be used to buy from. So that level for next week 4569 , our T cross long coming in at 4500 , so we know where all that support is. But I would like to see us hold above 4559 , but I do believe uh, a minor pullback is in order here before we get a more significant rally going into month-end.
Gold
Now gold prices again are firmly benefiting from uh, this, this dollar um, selloff. But in my respectful opinion, and again looking back at these weekly outlooks…
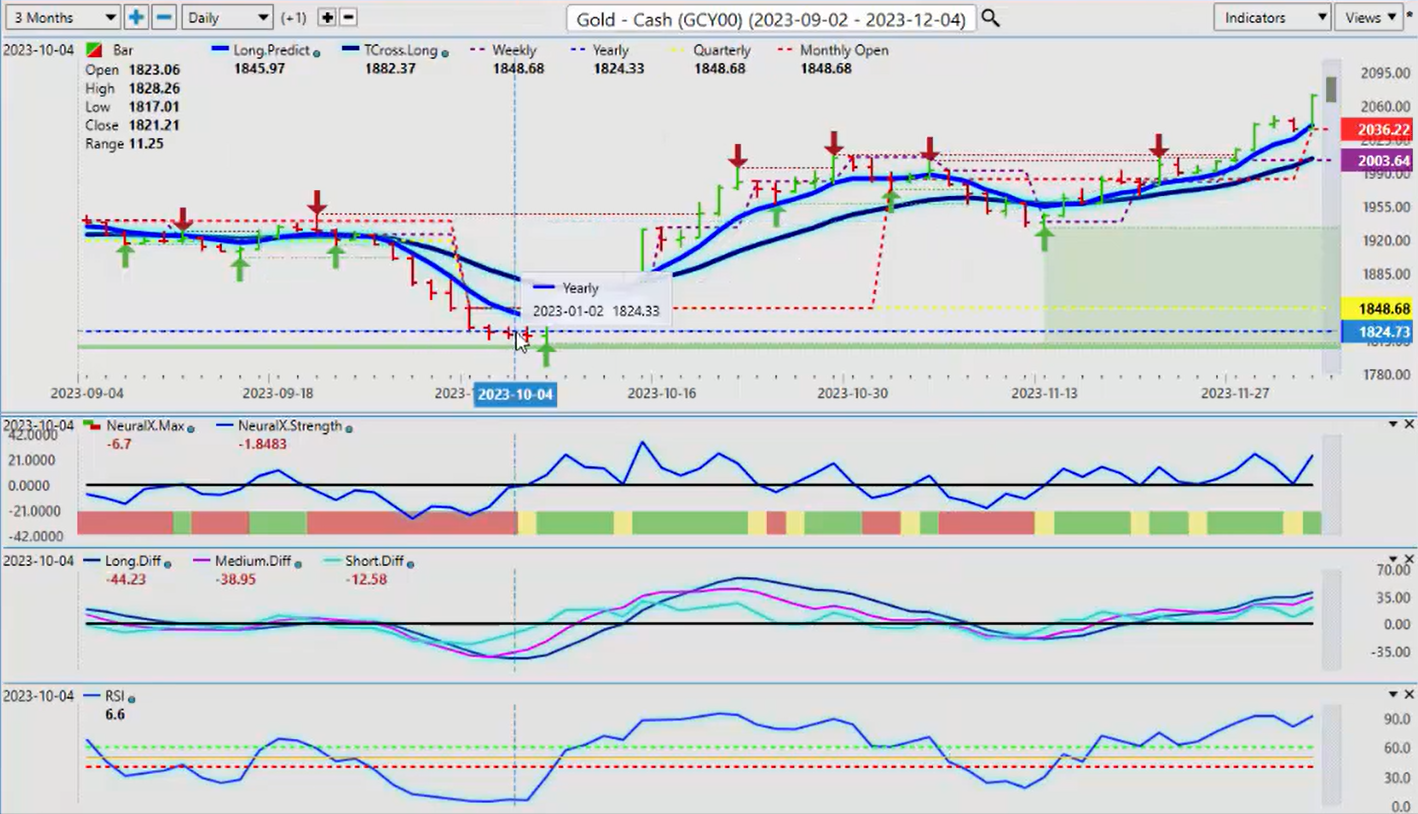
I had been very adamant that uh this was another just like the equity markets back in March this was an excellent buying opportunity and gold the more they tell you that the pundits tell you to sell something the more you should be looking closer at Longs. So again when we when we identify using the current yearly opening price not a random 5 days random 30 days random 365 days that doesn’t give you the kind of Anchor Point where you can actually validate a trade. So when I look at this right here if I consistently stay below here and break below this yearly opening price I would be in full agreement that that shorts are val are are validated but that didn’t happen we price completely stalled around this invisible support and now we’ve had a massive rally on gold back to the upside where we would be expecting this in mid December uh mid November either way but it is gaining further momentum here and December and January are usually pretty good seasonal patterns provide good seasonal patterns excuse me for buying gold so we’re we’re well underway here but I think a pullback is is is reasonable to some degree. So we would identify that using the two blue lines here the lighter colored blue and the darker that’s the long predicted at 2040 and you can see we’ve got the T cross long at 2005 but our current monthly opening price is 2036 so if we do get that pullback then we have a couple of areas where we can buy from and then as it starts Rising back off the Vantage Point predicted moving averages then we can have limit orders to buy it when it goes back assuming that we come down and correct lower first when it crosses back over the current monthly opening price and the current weekly opening price for that matter then we can buy or add to contracts. So uh again there’s a lot of different ways this can be done but for now price structure here is still relatively bullish for gold but whenever I see a bar like this on a Friday, uh very often it it sets up to be uh a bull trap or a bear trap if it was a big bar to the bottom so I would be looking for a pullback next week between 2040 and 2005 to re set those long positions.
Light Sweet Crude Oil
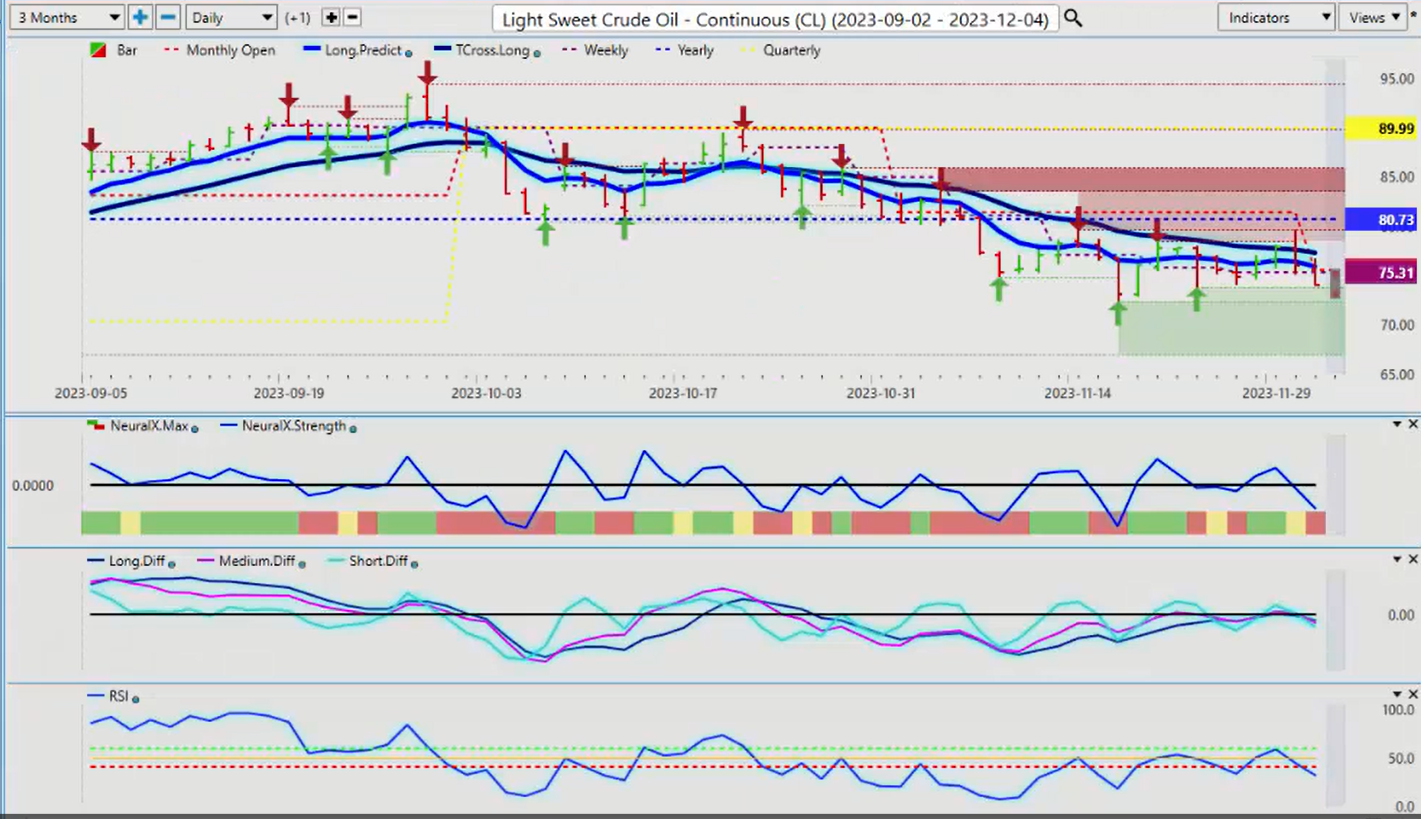
Light Sweet crude going into next week again very tough quarter and this came right out of the gate. So once again guys uh I’m going to sound like a broken record but I I get a lot of questions on this what do you mean by an anchor point What’s the difference well the difference is uh quarters don’t stand start at random points guys they they they’re very specific when the first quarter starts second third and fourth so as I start going into the actual fourth quarter then I’m I’m not usually looking at buying oil I’m looking at buying other Commodities silver gold uh Bitcoin these are top dogs for me but again whatever works for everybody but when we look at these levels right now we can see that the quarterly the the monthly the yearly they’re all stacked up against oil here and when it crossed over the current yearly opening price that led to a substantial move down and oil so again we had a little bit of a push up here and you’ll notice we came dangerously close to 8073 the current yearly opening price we got up as high as 7960 and then it it was a bull trap guys and then down it goes so the trader that’s using that rolling performance model gets a false signal buys it he stopped out so again this is only this is a free video just uh advice to benefit the the masses there’s things you can look at to see if it can improve your your trading because I do run into this a lot.
So right now the indicators are bearish in oil uh but we’ve got some pretty heavy verified support down here down to a low at 7237 which I think will is likely to contain uh oil prices for at least for 2023 but it will be you can expect further volatility.
Bitcoin
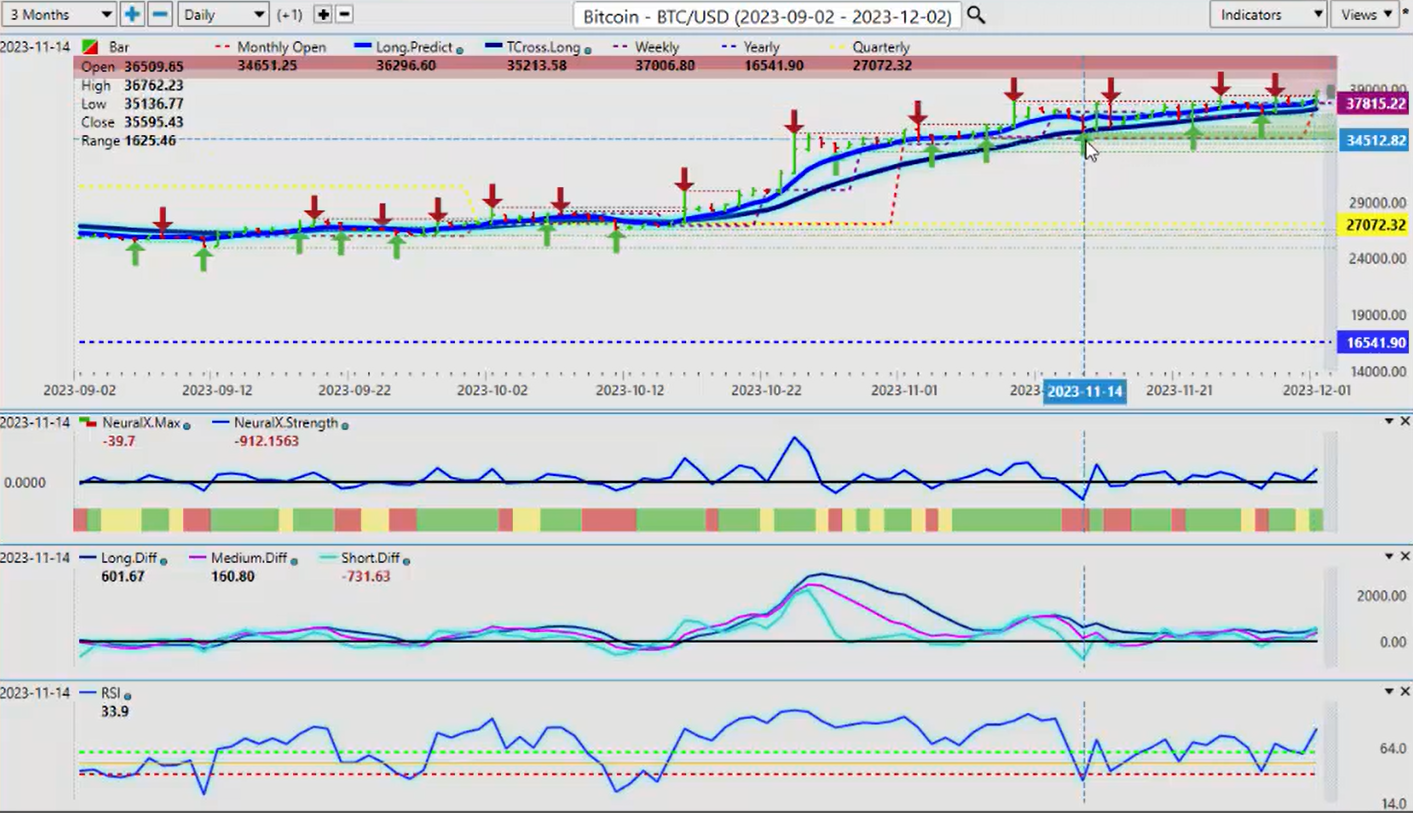
Now Bitcoin finally starting uh to show some life here we’ve come through uh usually with Bitcoin uh November is a tough much tougher month and it’s still fared very well it’s closing it’s closed out the month starting uh starting December strong again but as you can see using the proper anchor points guys and again using that monthly opening price 34,000 uh 34,651 we’ve held above the monthly opening price the entire month the quarterly opening and the yearly opening price uh so again and then we’re simply using the Tross long to to buy and actually I’ve done quite a few shorts as we’ve discussed on here too around the 38,000 Mark 38,41 18 to be more specific we were not getting any buyers up there but December uh could be a better a better month for Bitcoin it’s certainly starting off well. Bitcoin it can it can benefit from higher gold prices and it can benefit from higher Equity prices and that’s what I suspected uh months ago when I discussed it on here that I I feel that Bitcoin could possibly correlate also to Gold but uh clearly we’ still got buyers uh heck of a year bitcoin’s more than doubled this year so Longs well still on the table until such time as the Vantage Point indicators suggest otherwise.
Euro versus U.S. Dollar
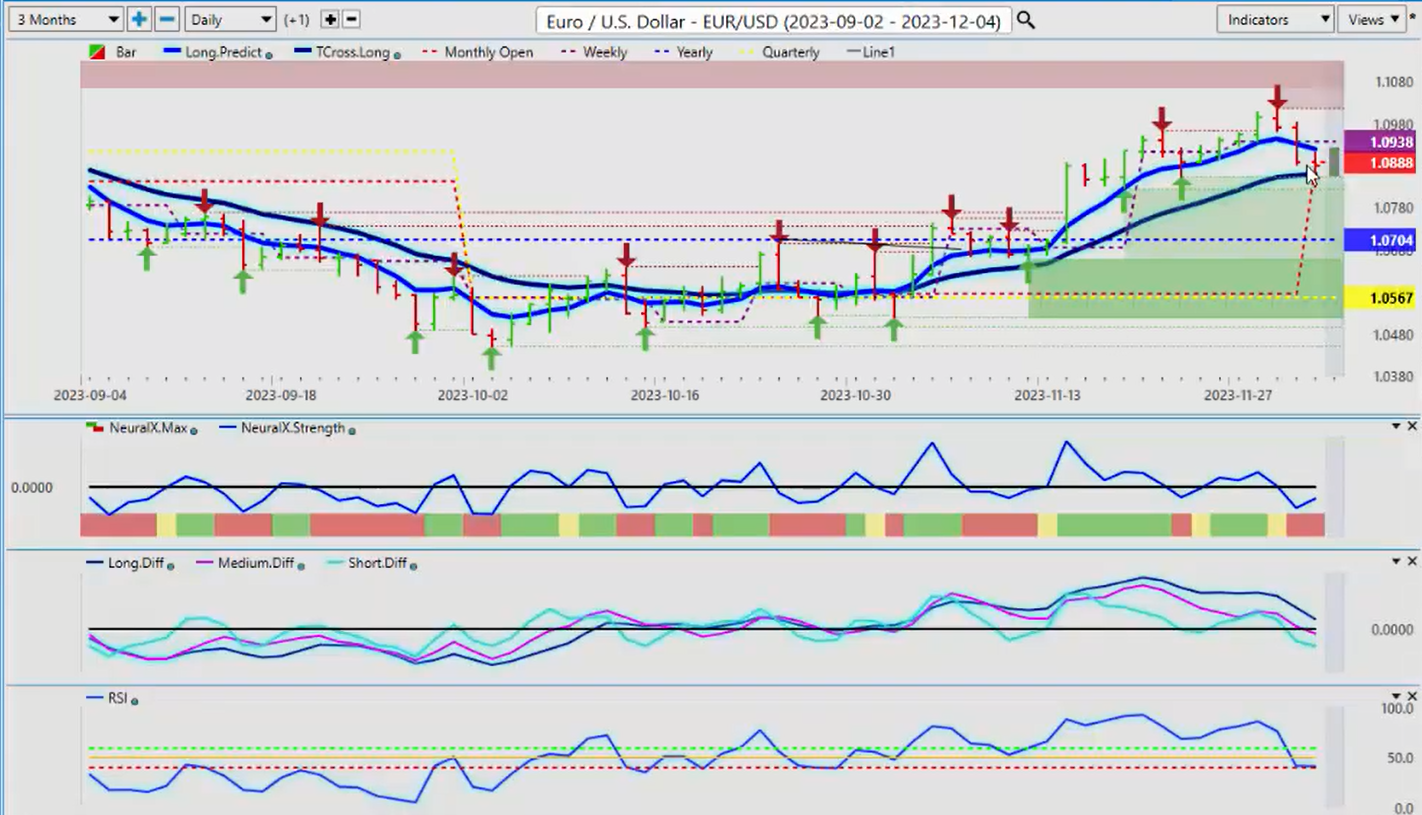
Now when we look at some of our main forex pairs for next week uh the Euro seeing some volatility on Friday but you can we can assess we came back down to the T cross long uh 10360 we hit that and bounced out of it so once again we will look at that current monthly opening price 10888 the second we start holding above that level the euro is likely to extend higher. Right now we’ve got very good support 10860 but additional support down into the uh down into the lower 107 area but I think that will be very difficult uh but the indicators are somewhat mixed here but you can we can assess here using that 60/40 split on the predicted RSI you can see that the we didn’t have any downward momentum here. Even though we’ve crossed over the long predicted this lighter colored Blue Line uh the RSI was saying no there isn’t a lot of momentum here and I and I will say that the Euro predominantly is a very high correlation to Gold. So if we get a little bit of a pull back in Gold then we should see a pull back in the Euro this week but that would be a buying opportunity because again firmly firmly above its yearly opening price. Its quarterly opening price uh and the dollar not in the best place right now, so again any pullback and again we’re going into a week with no known dollar strength but it’s likely going to be much smaller as the market starts to price in rate hikes or rate Cuts excuse me.
U.S. Dollar versus Swiss Franc
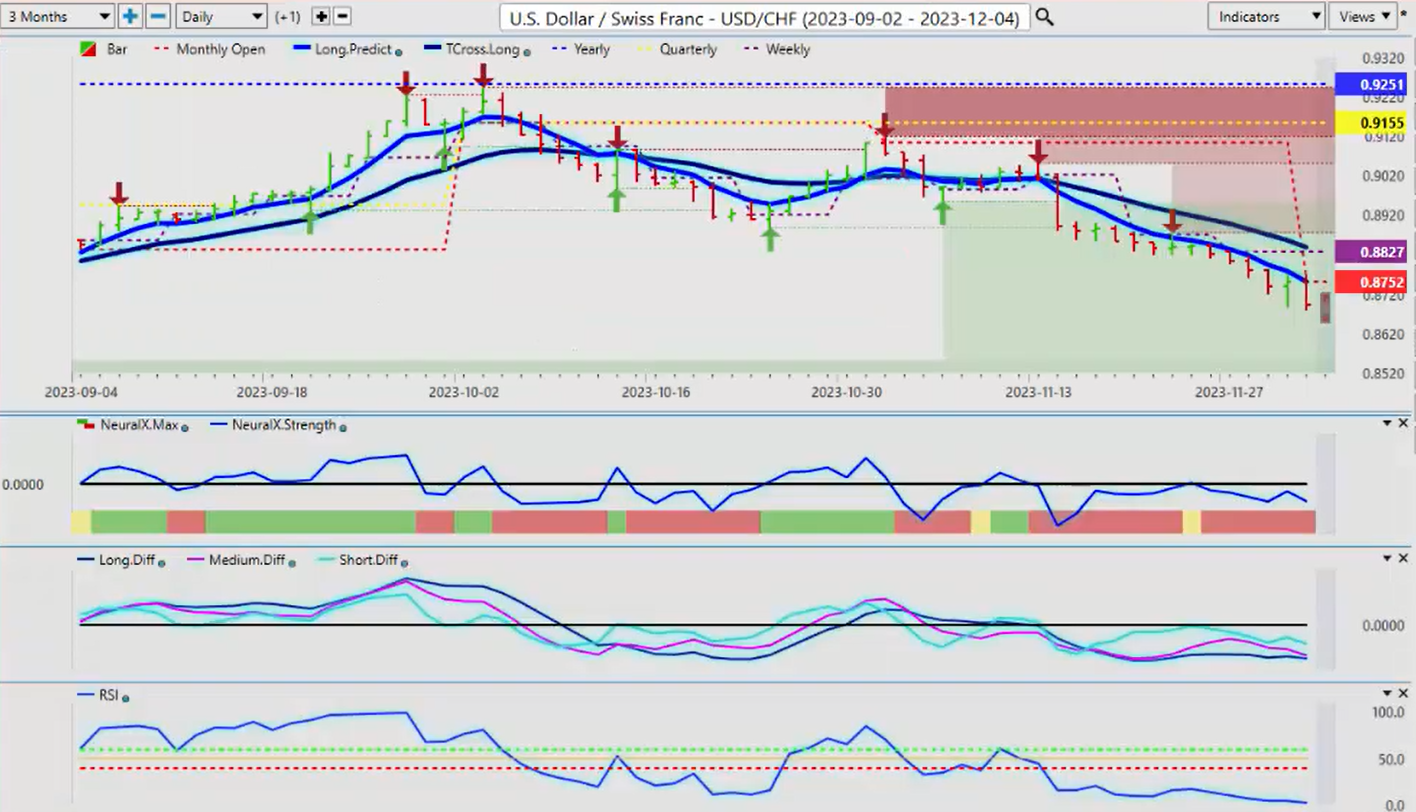
So when we look at the US Swiss frank again this pair basically mirrors the dollar Index so if the dollar Index is not doing well then in most cases this pair is falling so again another alter alternative to using the predicted high and low only in our trading I prefer to use the long predicted and you can see that this is very very easy trading and if the market doesn’t make it to the to the Vantage Point predicted high for me to sell into then I will simply use the blue line by itself as a pivot area so for for Monday’s trading we can because this again this is an Outlook guys not a recap of something that’s already happened 8751 8830. Again we can see a very well-structured uh chart here that’s not uh congested with 50 different indicators what it’s got is basic price structure in Market correlations predicted moving averages and I can use that predicted moving average as an entry point so if I look at this right now for Monday’s trading uh we’re looking at a very minor predicted high of 8721. But I would be watching very closely for a short-term long trade here if we get that dollar strength but once again uh using overbought oversold accumulation distribution whatever you want to call these different terminologies uh you can see that we went into oversold territory very very quickly, so what I would be looking for here is a breach of the predicted moving averages, which were for now uh that’s going to be very difficult uh but our T cross long is likely to contain any dollar strength this coming week.
British Pound versus US Dollar
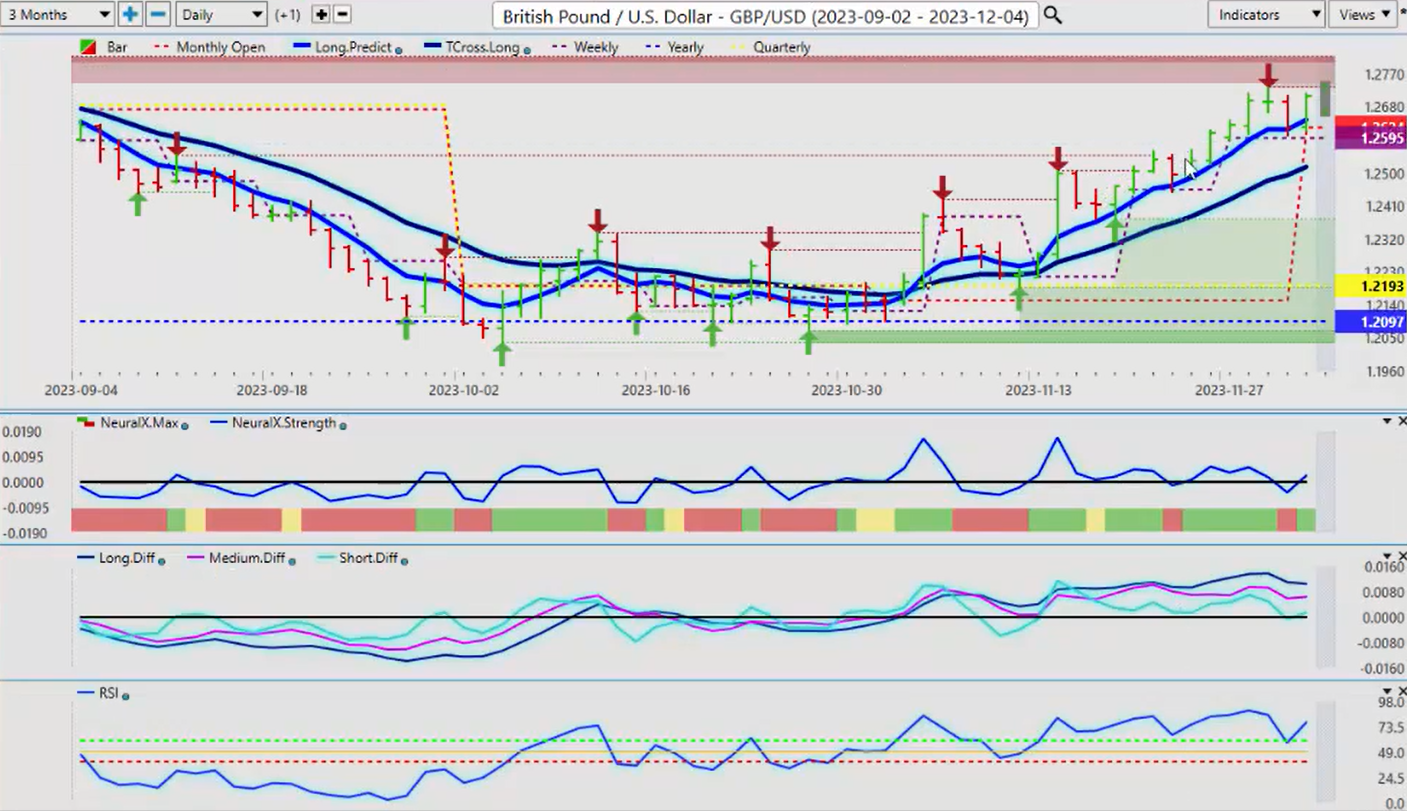
Now the pound dollar once again the pound dollar having a a pretty decent week uh last week and again I’ll just clean up some of this chart so we can see it a little more clearly the the market structure using proper anchor points yearly opening quarterly opening I’ve even got my weekly and monthly opening price in here so the new monthly opening price on this one is 12624. We’ve closed very strong 8710 but you can see that to to begin the month one could argue based on the Vantage Point indicators based on using that uh current monthly opening price one could buy right off the open on Friday.
And it’s a pretty darn good trade so we’ve just got to watch out for this uh verified resistance high 12733. And again, always remember, guys, the beginning of the month, the first week of the new month is usually when we see some dollar buying. So can’t rule that out, but if we get a pullback, we can identify those areas, the long predicted 12645, the T cross long at 12517. So I like to pick them up between these two blue lines. But if we’re holding above the monthly opening price, and again, December is usually a very poor month for the US dollar, then we may not get below the monthly opening. You can use that number of 12624 as a potential entry point. But again, if I went back a random 5 days or a random 30 days, then you wouldn’t have that type of an anchor point there to gauge whether this long is still viable or not. So if we do cross below the monthly opening price, then you can put a limit order below that too. But right now, the indicators are saying we are going higher.
U.S. Dollar versus Japanese Yen
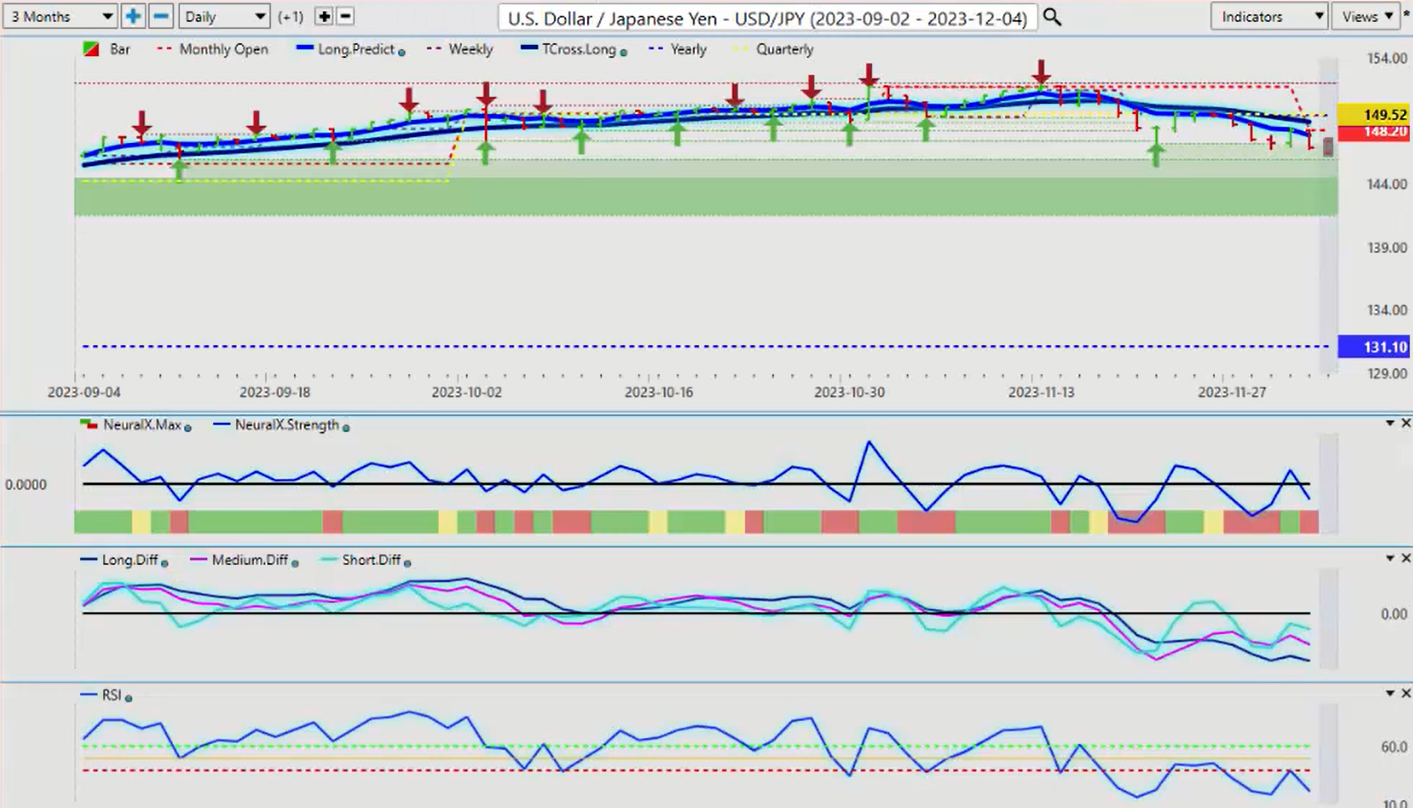
Now, with the dollar yen, the dollar yen as I’ve talked about over the last few outlooks, that predominantly, again, December is not a good month for the dollar and it favors the yen. So even with the carry trade, you can assess here and we look at the current quarterly opening price, using that leveraging that price, 149.52. Then you can see that as soon as we crossed over the current quarterly opening price, the natural retracement point was back to it, and then we failed again. So again, if I went back and just picked and chose 5 days, 30 days, 15 days, 365 days, I wouldn’t have the luxury of being able to leverage that Anchor Point in to confirm my trade because believe me, it’s a very dangerous short because of this carry trade. But I also think the market’s pricing in rate cuts from the US, and that will affect the carry trade. The interest rate differential between Japan and the Federal Reserve is potentially in the next year is likely going to shrink, so that will definitely affect longs on this pair. So right now, the indicators are mixed but firmly below that.
So our current monthly opening price 14820, and we’ve got our T cross long, now that’s coming in at 14894, which has crossed over the quarterly opening at 14952, which is a very bearish signal to say the least. And combine the seasonal pattern of dollar weakness in December, well, we just got to get through a couple of days, the first week of the non-farm payroll, the week of the non-farm payroll number, and that should trigger additional shorts but watch out for volatility with this pair.
US Dollar versus Canadian Dollar
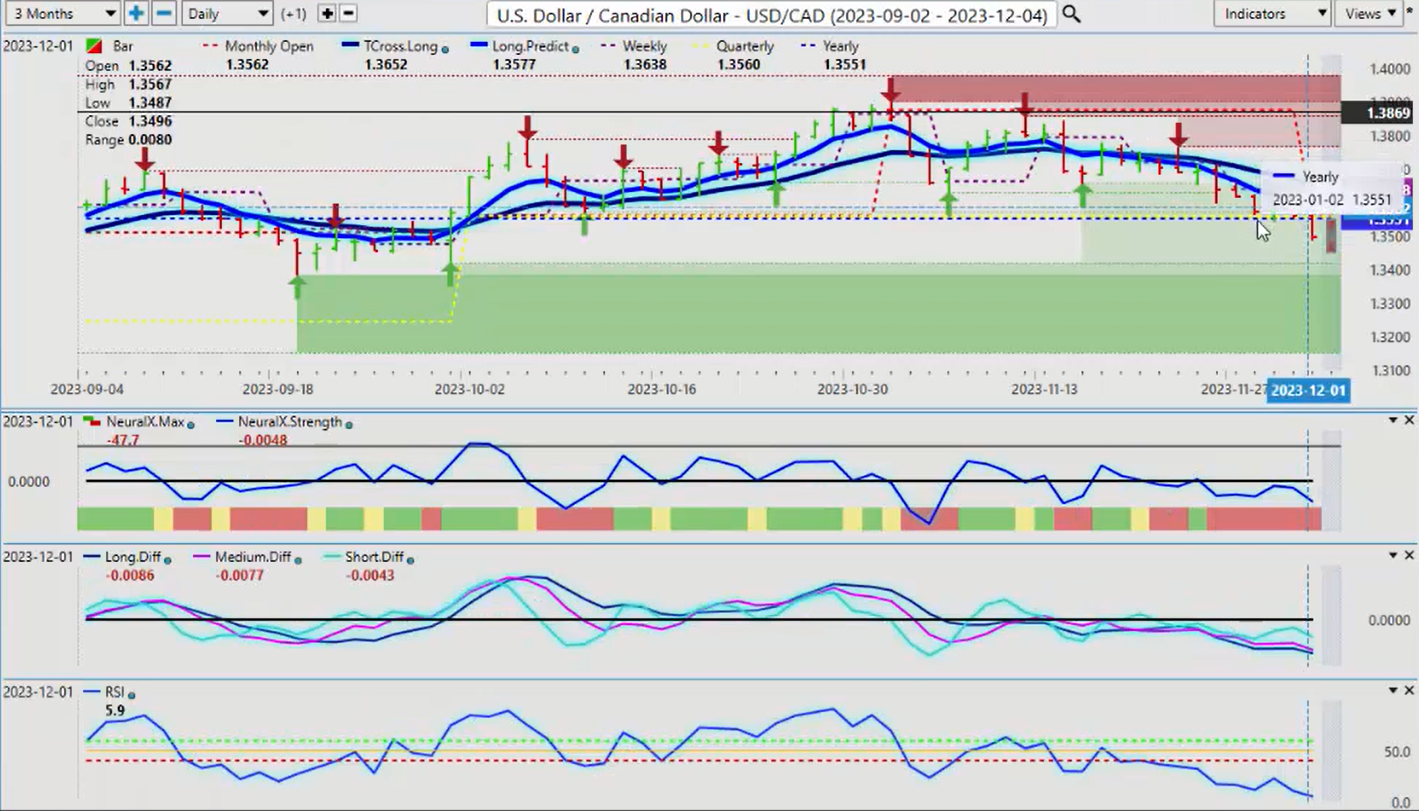
Now when we look at the US Canadian dollar, once again, we’re at a make or break area here. And my view is the Canadian dollar is only benefiting from dollar weakness because the Canadian economy is worse, far worse, in my opinion. I believe the Bank of Canada will have to cut. So we’ve crossed over this, but we did it on a Friday, guys. And again, the GDP coming out of Canada is nothing great. The labor reports are nothing great, inflation’s coming down, oil prices are down. But the Canadian dollar, much like the Aussie and the Kiwi, feeds off of equity market strength. If the S&P is going up, then usually this pair is going down. Aussie/US is going higher, New Zealand/US is going higher. So be careful. But this, again, using the proper anchor points, we can see 13560, 13551. All of our resistance is sitting right there. So if this can’t actually hold below here, then we’re likely going to see a reversal. So keep an eye on that S&P 500 and keep an eye on these two critical areas next week.
13560, 13551. If you do want a short, guys, that’s where it is because this is a better example of how to use the predicted high and low. The predicted high for Monday is 13549. So you’ve got a lot of resistance sitting right there. And US Canada is notorious for a Monday-Tuesday reversal. So if it does go up on Monday, the probability is it could go down Tuesday or Wednesday. But that’s where all the action is going to be right around 13560.
Australian Dollar versus US Dollar
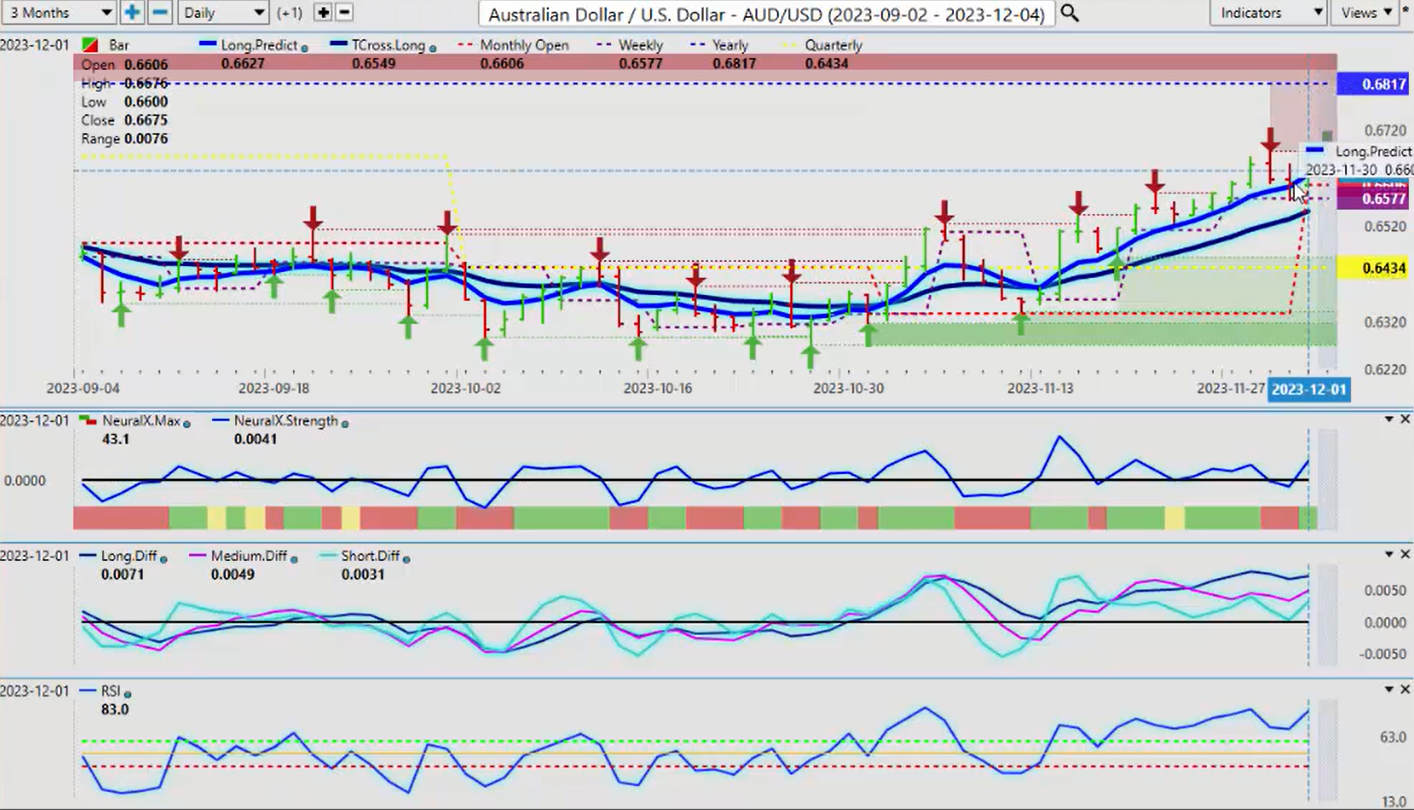
Now, when we look at the Aussie, the Kiwi, virtually identical, very similar to the US CAD, just reversed. So again, when we look at this, let me go back here just for a minute, and I’ll pull that back up so everybody can see where you can hit that apply that right across our entire template here. So the Aussie dollar for next week, what we’re going to see here is the same thing. The Aussie is still below its yearly opening price. So this could be a place of value to sell US dollars because it’s likely going to try and take a run this month at 6817. I would say there’s at least a 60 to 70% probability that we will hit that level by month-end because again, this is an Outlook, guys, not a recap of something that’s already taken place that I’m discussing. We’re looking at future price targets here.
So right now, if we can hold above the Vantage Point T cross long that comes in at 6549, then that is a potential target for us, and the indicators, they are mixed, but they’re still bullish.
New Zealand Dollar versus US Dollar
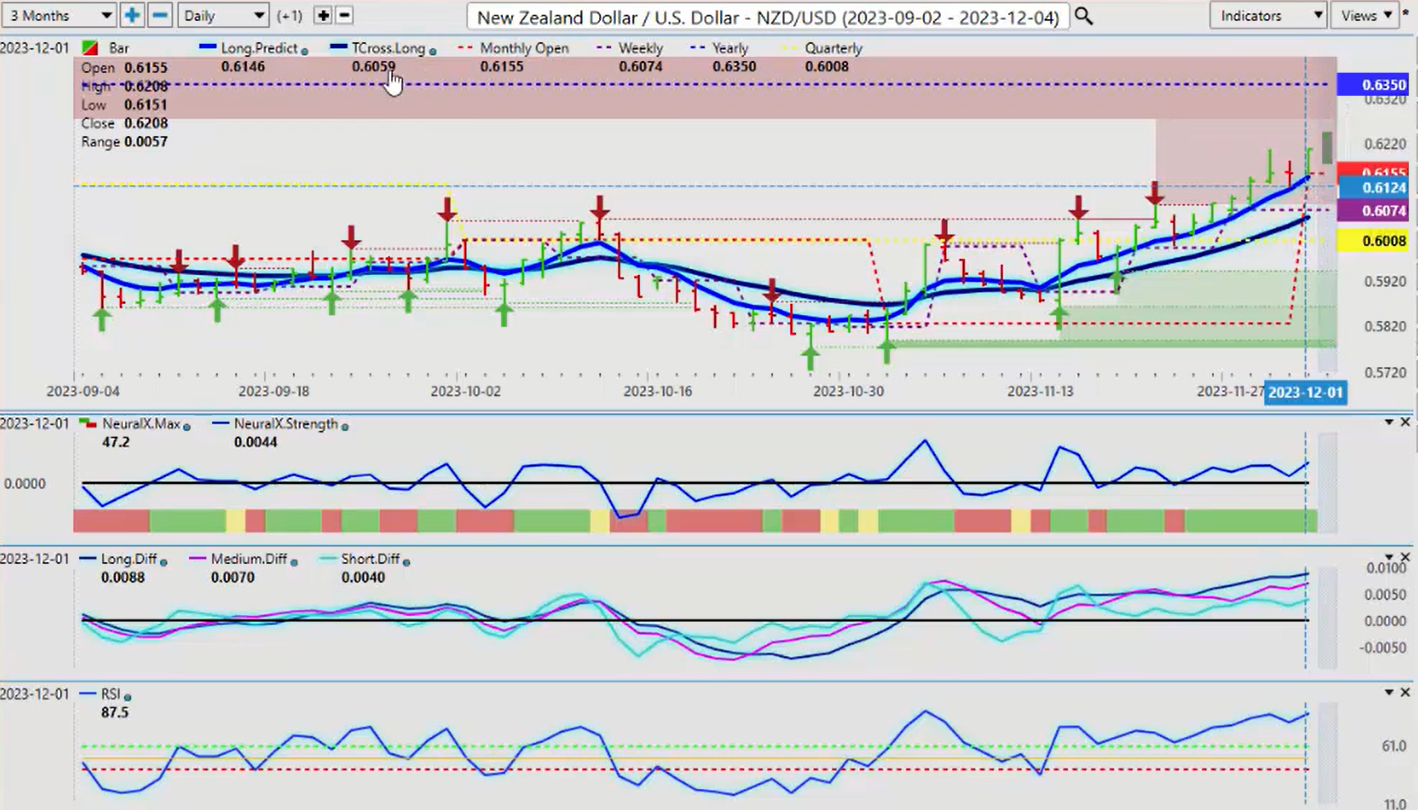
The Kiwi is a very similar, almost identical trade. When we look at this, our long predicted, coming in at 6146, but 6059, that’s your big level. If we hold above that, but it is entirely possible that we could hold above the monthly opening price here also at 6155. And if we do, then again, 6350 is definitely in our crosshairs. So with that said, this is the Vantage Point AI Market Outlook for the week of December the 4th, 2023.