-
View Larger Image
Welcome to the Artificial Intelligence Outlook for Forex trading.
VIDEO TRANSCRIPT
Hello everyone, welcome back. My name is Greg Firman, and this is the VantagePoint AI Market Outlook for the Week of October 30th, 2023.
U.S. Dollar Index
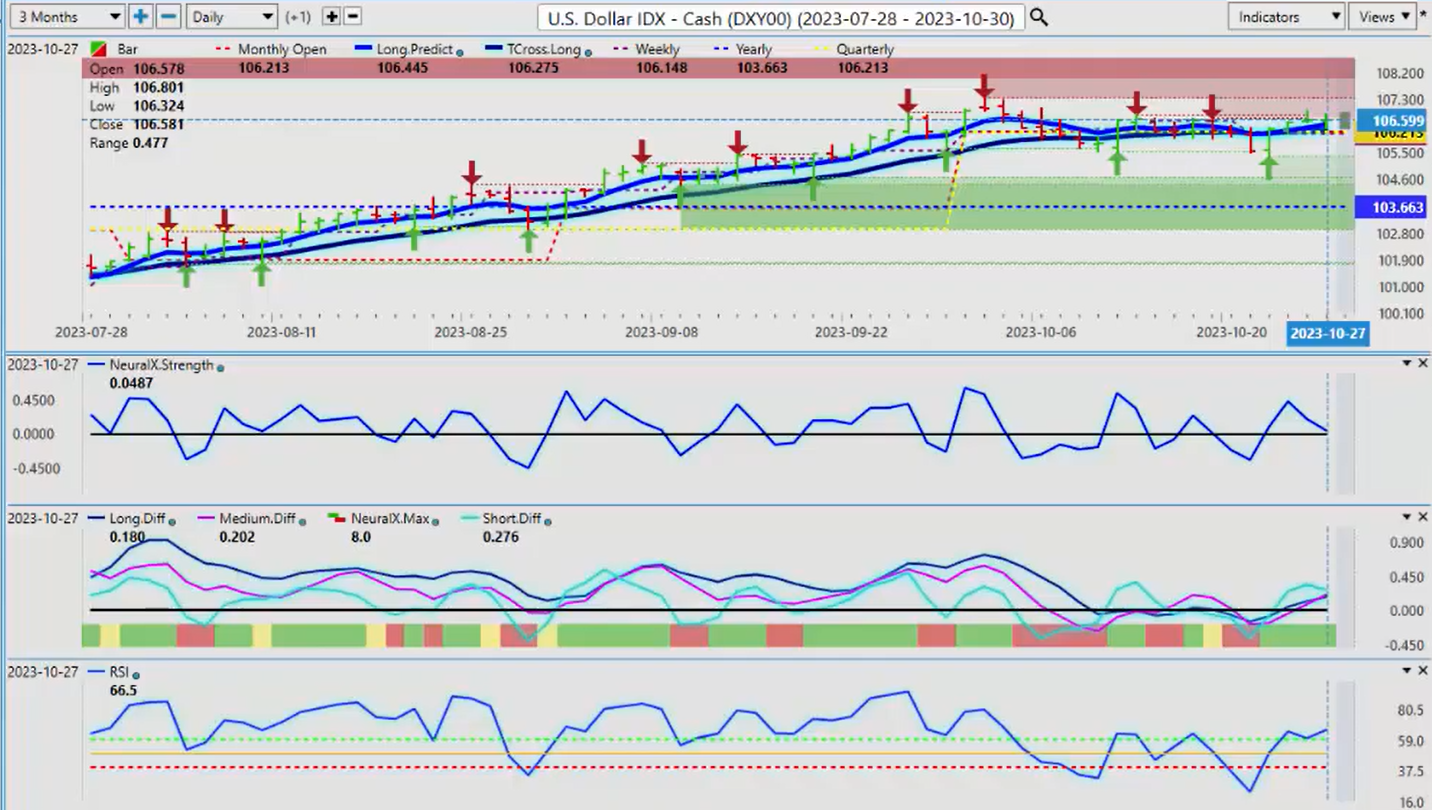
Now, to get started this week, we begin where we usually do with the US Dollar Index. Now, the dollar is hanging in there, but again, we’re approaching a very strong seasonal pattern where the dollar basically loses its luster going into the middle of October or middle of November, excuse me, into December. So again, the dollar really struggling along here for Monday’s start of Monday’s trade.
We can see our neural indexes pointing down, our predicted differences are pointing up. Now, with the normal period of dollar strength that would occur up until, including the week after the non-farm payroll num, so that would be basically a week, this coming Friday, the dollar would normally remain strong up until that. But the most recent labor reports have not been strong at all, despite the U3 versus the U6. So I’m not anticipating a great Labor report, but either way, the dollar is likely to sell off by about November the 7th, so around that area, the Tuesday after the non-farm payroll num. So we watch the Vantage Point indicators very, very closely to confirm that dollar cycle that I’ve talked about on here for many, many years, actually, and we see it every month, and then the dollar mysteriously strong in the first week of the new months and then of the new month and then mysteriously sells off shortly thereafter, even with a good labor report.
So right now, the indicators are moderately bullish on the dollar, but again, I would strongly advise being very, very cautious as we get into the latter part of the week.
Gold
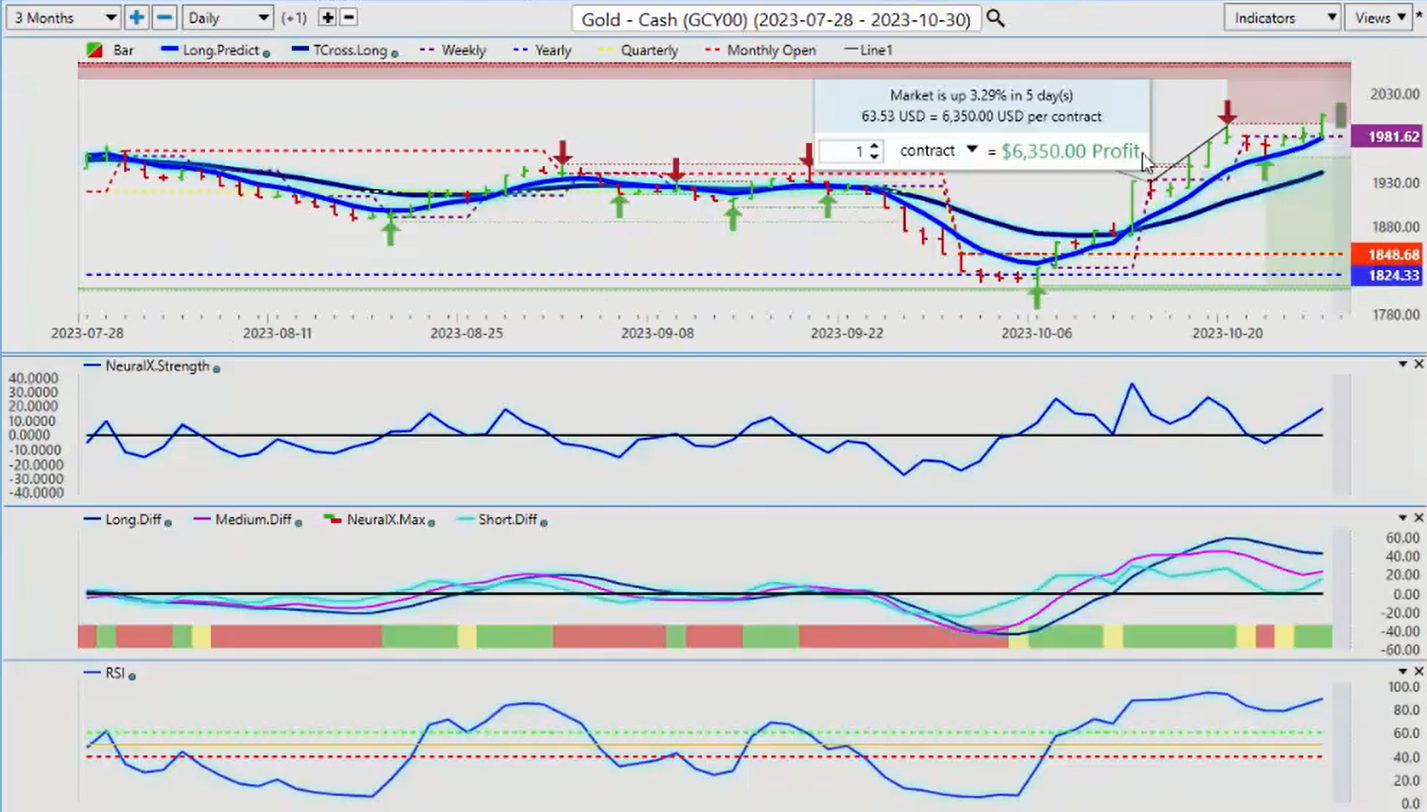
Now, when we do a comparative analysis to Gold here, Gold continues to move higher, but again, we want to be very cautious pouring into long trades on Gold this coming week because of that inverse correlation to the dollar. Now, with the Israeli Hamas war, with the geopolitical issues globally, that’s going to help support Gold into year-end. But in most cases, we do have some kind of significant pullback before the trend resets back to the upside.
Now, this previous week, we can see that we’re running right along that long predicted here, but again, in my respectful opinion, we have to be prepared for a pullback towards the T cross long, which is down around the 1940 area. If that was going to happen, it would be this coming week, but that would be again, then a buying opportunity when we get down here.
Right now, predicted RSI 89.2, but our reverse checkmark or strength is still pointing up, so I anticipate Gold will move higher on Monday, but be very cautious on Tuesday.
The other thing we work on in the Vantage Point live training room and at the live seminars is the notorious Monday Tuesday reversal, which when we look at last week with the dollar, oil, when we look at pairs like US Canada, Euro US, that big spike up and then a spike down, for example, using the Euro, which I’ll talk about here in a second.
But be careful of that, is what I’m saying. Gold is very toppy up here, probably not the best time to be going into excessive Gold long trades. Gold mining stocks, a bit of caution there is recommended. I think you might want to wait a week or two before we start looking at doing that again because again, we want to get past this period of known US dollar strength. It may have come early in this previous week, but I seriously doubt that.
S&P 500 Index
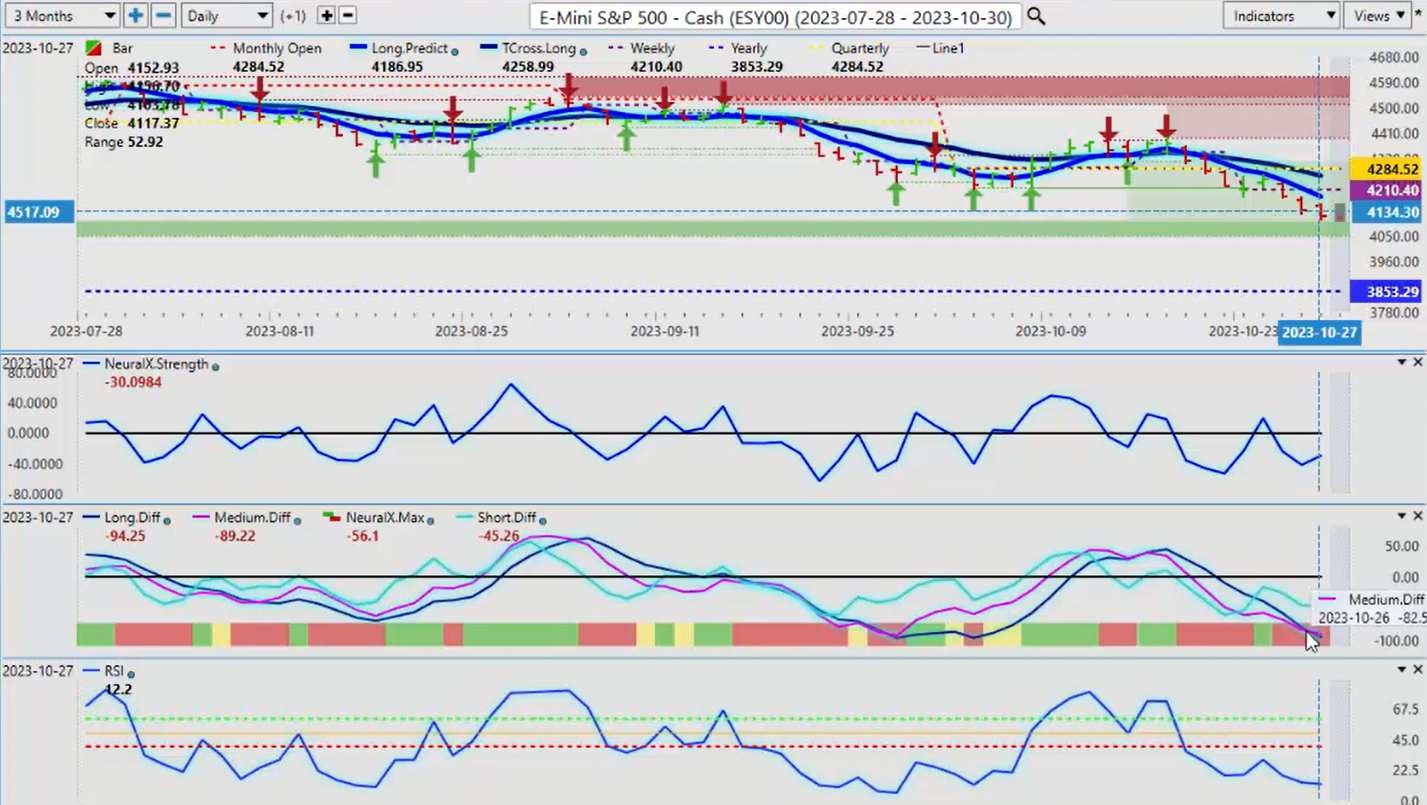
So when we look at the S&P 500, I think we’re looking for one more push to the downside, and then we go higher. We can see that the Vantage Point predicted differences are starting to warn of that right now. They’re basically bottoming out, and we can see that the pink line is trying to cross the blue line. This is a very strong warning sign of a reversal.
And again, just a reminder, when we saw that on Gold before Gold made that move on October the 3rd, we could see that. So this is a very, very powerful contrarian signal, particularly when we combine it with the additional VP indicators. The neural index strength crossing over the T, the long predicted is another excellent way of doing it.
But that particular signal is very seldomly wrong, and if nothing else, it warns us to be careful. We can see on the SPYs, while the average junior trader thinks that the SPYs are ultra-bearish when, in actual fact, they could be getting ready to turn higher. So when I look at that comparison from the SPY to the S&P 500, we see that we have the exact same signal from Vantage Point that is starting in early development. So I suspect that we will have one more push down, and both will turn higher.
Because again, let’s not forget the SPYs. When we move away from a lagging rolling performance model, we can see more clearly the SPYs are again, they opened. If you bought the SPYs at the beginning of the year, you’re still significantly up, 384.37. Unless we break down below that, we’re still looking at buying on a dip here. So again, the Vantage Point indicators are beginning to warn us on that.
That’s the same thing that warned us on the dollar Index going higher and lower on Gold, on the SPYs.
Bitcoin
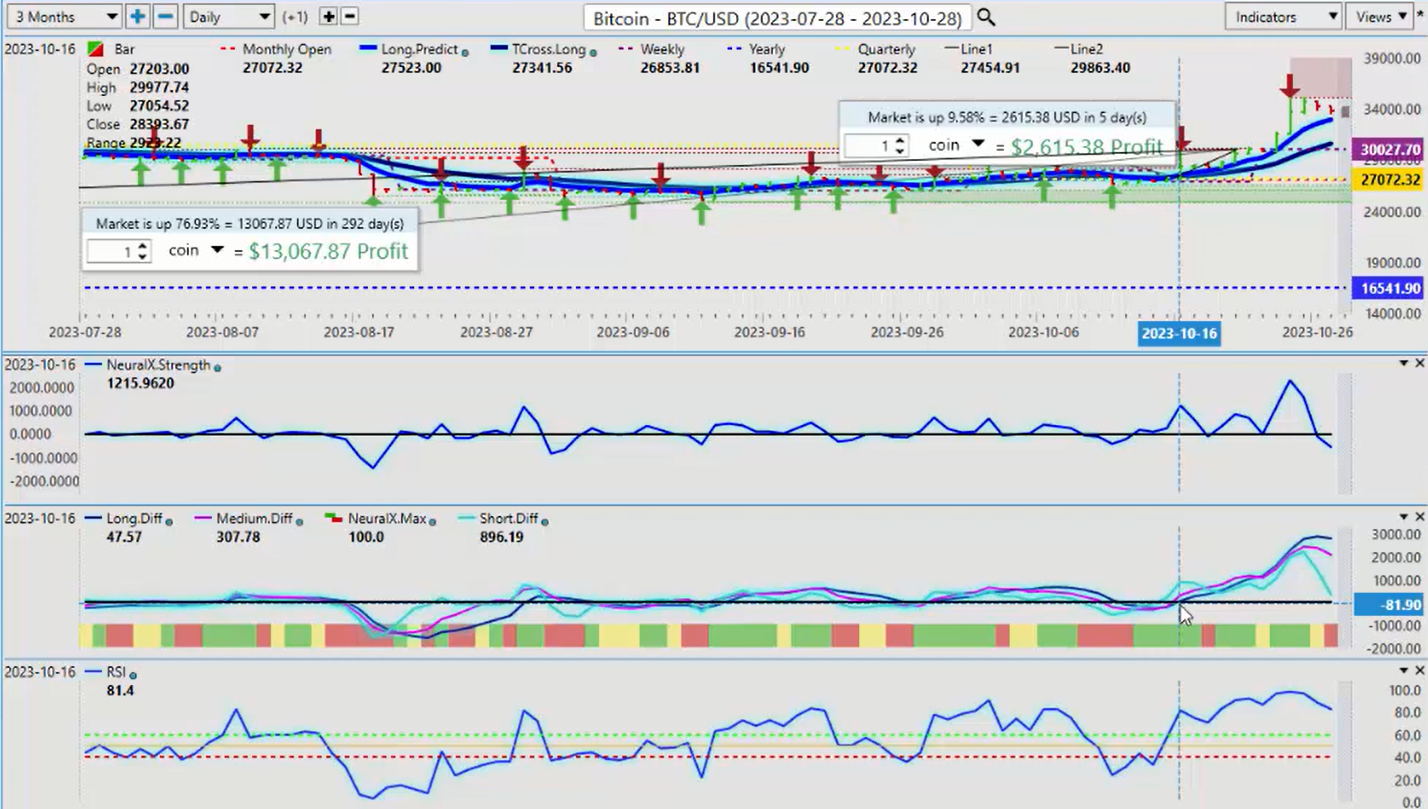
But it also gave a strong warning sign back here on Bitcoin, that Bitcoin basically around October the 16th, which I had discussed in this VP Outlook multiple times going back to August and September that, hey, look, they’re trying to push you away from Bitcoin.
Just the previous week before we had this massive rally on Bitcoin. I can only advise guys just to really ignore what the media is saying. They actually try to label Bitcoin as a terrorist currency, and it’s funny they said that just before a known seasonal pattern is about to kick in. They’re trying to deter you from buying something that they’re probably buying themselves. So again, caution here, guys.
So we’ve had a big push up in Bitcoin. The seasonal pattern usually runs until early to mid-November, and then it kind of flatlines, but it’s still slowly grinds higher into the year-end. But this is again, once again, Bitcoin doubling on the year. Remember back in March, and they’re telling you, oh, don’t buy Bitcoin, don’t buy Gold, only buy dollars. That’s what we heard from the bobbleheads, right?
So we’ve got to trade what we see, not what we hear. Again, when we look at intermarket correlation, seasonal patterns, they carry a lot of weight than and they carry a lot more weight than what the media does, that’s much I can assure you. So the indicators, as the predicted differences rise, they’re starting to roll a little bit down to the downside here, so we should expect a bit of a pullback on Bitcoin this week. But again, there’s science behind why that would happen as we roll into a period, probably the final period of the year at the beginning of the month when the dollar strengthens. They’re going to be talking about what a great Labor report we’re going to have this coming Friday. Look very closely at that U6 number, guys; it’s going the wrong way. And that’s why I believe the dollar struggled after the last payroll number. And that’s why that was my argument on the October 9th presentation. Why Gold is likely going to go higher? Because once they digest that labor report, they’re not going to like what they see, or the narrative that they’ve been sold may not be accurate. So again, these are things we watch for.
So right now, pretty easy to see where that big move up 31,538. Again, this will be our resistance for the week. A new verified zone is formed, so it’ll be a very interesting week. But I suspect Bitcoin will try and pull back somewhere between the T cross long at 30,555 and the long predicted at 32,941. So as long as we’re holding above the T cross long, but once again here, guys, moving this lagging rolling performance model, I could make the argument that we’re buying above the T cross long. And in the fiscal fourth quarter, Bitcoin usually shines, and it did again. I’ve taken this trade, I think every year since 2018 when I started ignoring the Warren Buffets, the media. If they don’t like Bitcoin, then like they say, if you don’t like what’s on TV, feel free to change the channel. But I like what’s on TV here, personally. And sure enough, again, it’s come through. So again, always make sure you’re checking your intermarket correlations, the time of the month you’re trading, and the time of the year you’re trading using accurate performance checks. The weekly, the monthly, the yearly, and the quarterly openings will really open up your eyes to a different way of trading or at least getting that price verification of whether you should be long or short.
Crude Oil
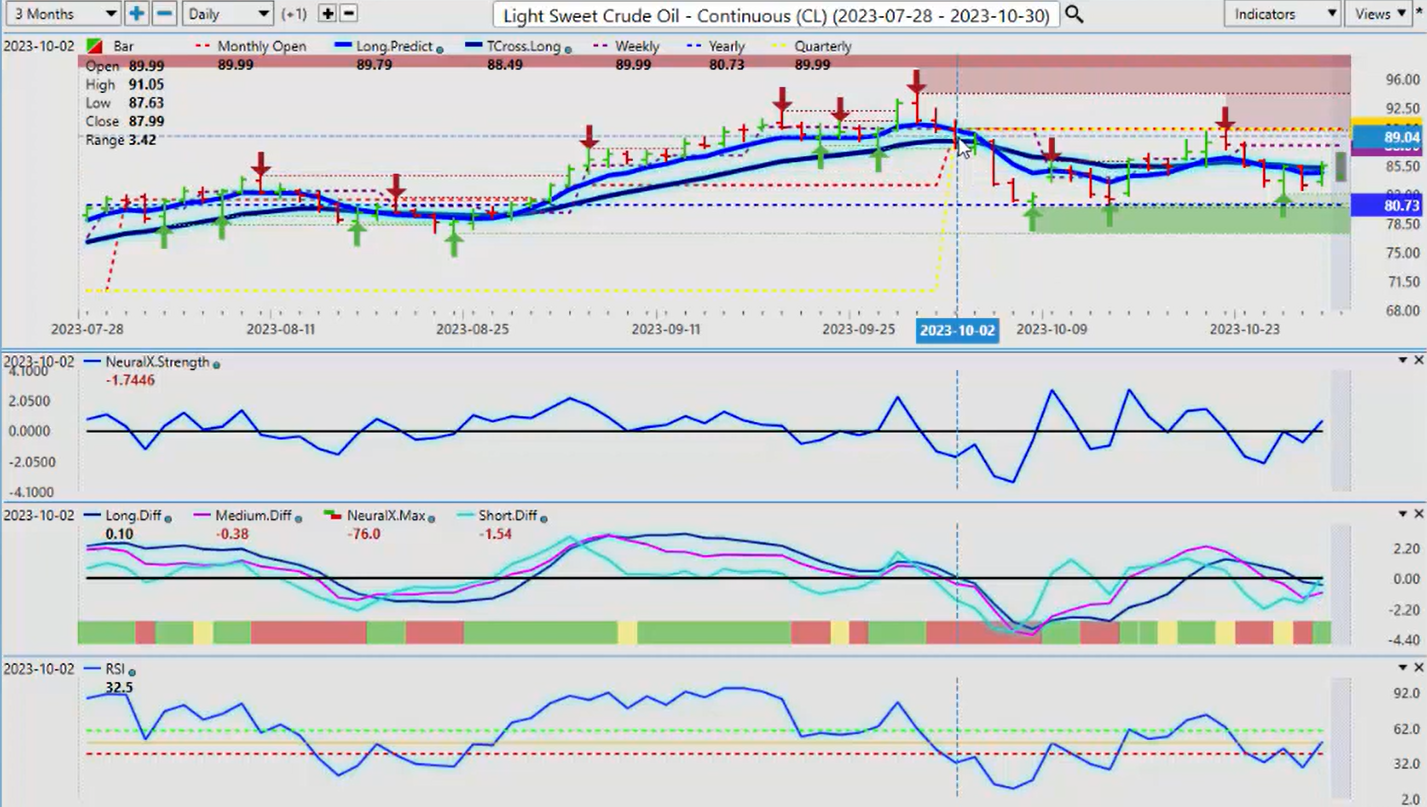
Now, as we look at oil going into next week, oil is losing its momentum. There’s no question about that. And I think that’s a good thing because the last thing we want to do is fund this war with higher oil prices. And again, the Middle East does need higher oil prices to keep things going. So right now, when we look at the structure of this, we’ve been down this entire quarter since October the 2nd when the fourth quarter started. Oil is struggling. We came directly to the monthly and quarterly opening. It’s impossible for me to script this when I’ve already discussed it in the previous outlooks. We must break through $89.99, and we just can’t do it. You can see that if you combine the monthly and quarterly opening price with the Vantage Point indicators, it’s a very, very powerful trade setup. But we’re using price action to validate the predicted indicators. If they both agree with each other, guys, why would we go long here? We would sell. So as we fail at that quarterly opening price, the neural index strength then the MA diff, my favorite one of my favorite Vantage Point indicators, crossed confirmed the reversal. But you can also see we still have buyers down at the yearly opening price, and we’re still positive on the year. So again, I can make the argument on both sides that we’re trading between $89.99 and $81.33. We buy the bottom; we sell the top. Easy peasy. But we follow the VP indicators to guide us through this. So if this thing can turn back up, if our predicted differences can cross back to the upside, I believe that’s entirely possible once we get past the period of known US dollar strength, which would be a week this coming Tuesday. Because again, guys, this is an Outlook, not a recap of something that’s happened over the last two or three months. That doesn’t benefit anybody; we need to look forward, not backward.
Euro versus U.S. Dollar
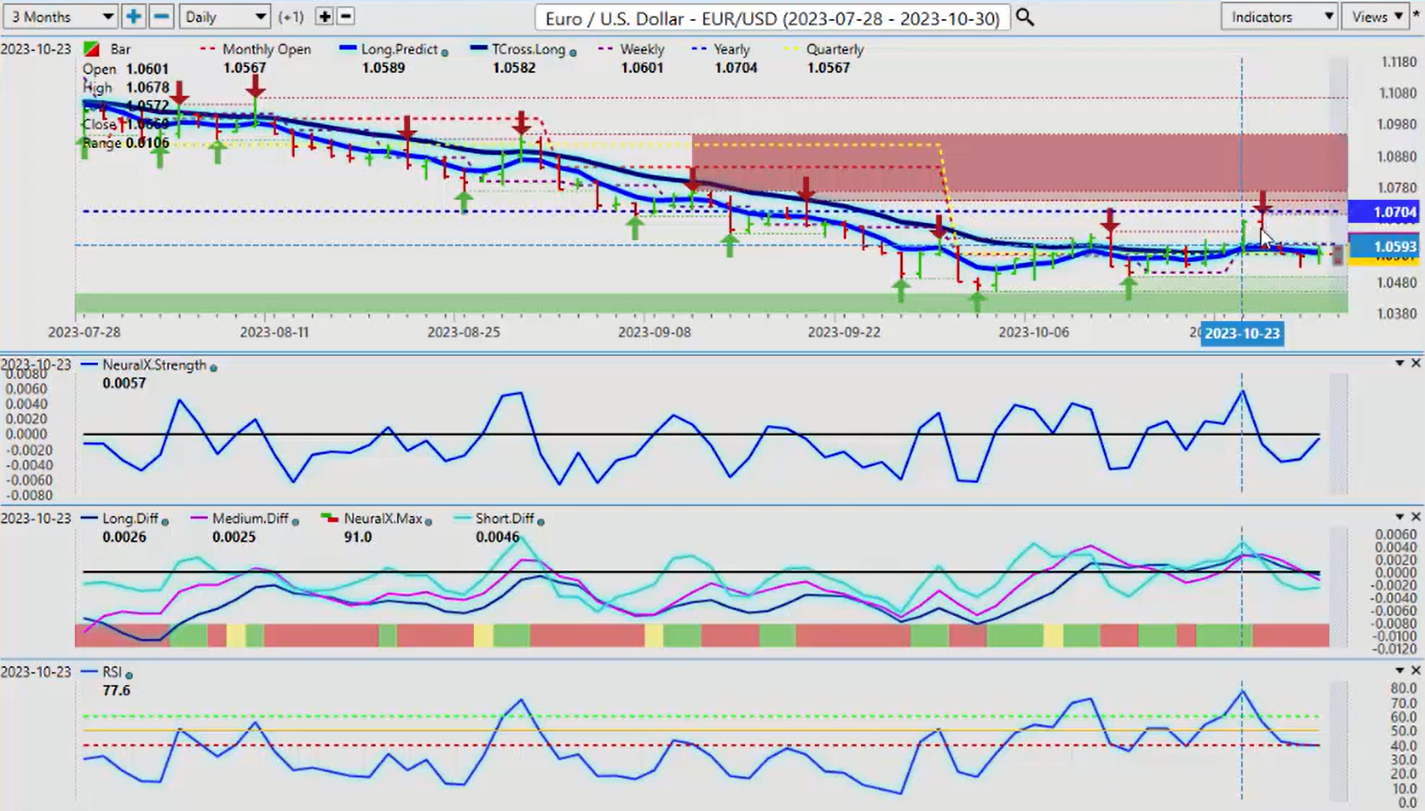
So when we look at some of our main Forex pairs this week, again, we worked on this one very closely in the Vantage Point live training room this past week. And a good example of this Monday-Tuesday reversal that I’ve coined, also with the dollar cycle at the beginning of the month. The Euro makes a big push up on Monday and then just gets absolutely slaughtered the very next day. This has happened across multiple markets, multiple Forex pairs. So I’m simply giving free advice: be very, very cautious with what you trade on Monday. With my own direct client base, I tell them, ‘Look, no trades until after 10:00 a.m. Monday morning. Let this whole thing shake out and see where we’re at.’ So the Euro pushed significantly higher. But again, using a per an accurate performance model of the yearly opening price, that was another death blow that was handed to the Euro. But again, my view is that this downside is on borrowed time. With the ECB softening, the Bank of Canada softening, the Bank of New Zealand softening, it’s just a matter of time before the FED does the same thing, which will not help the dollar, and the dollar will find itself at the mercy of the market, just like these other currencies have. So again, when you combine the indicators, the neural index strength started moving lower as the market on the up Monday, up Monday night update from Vantage Point. The neural index strength was moving down; we had an MA diff cross that was in progress that very day. So you can see the trade setup. Whatever you’re trading, the trade setup remains the same. So the Euro has taken a big hit. But now you’ll notice it’s starting to turn back up. But the predicted differences are down, the neural index is down. But again, using the predicted RSI with a 60/40 split, if we break down below 40, then we’ve got downside momentum. So as you can see, we don’t have that yet. And again, I believe that this verified zone down at this low, down around the 104.30 area, is likely to hold.
U.S. Dollar versus Swiss Franc
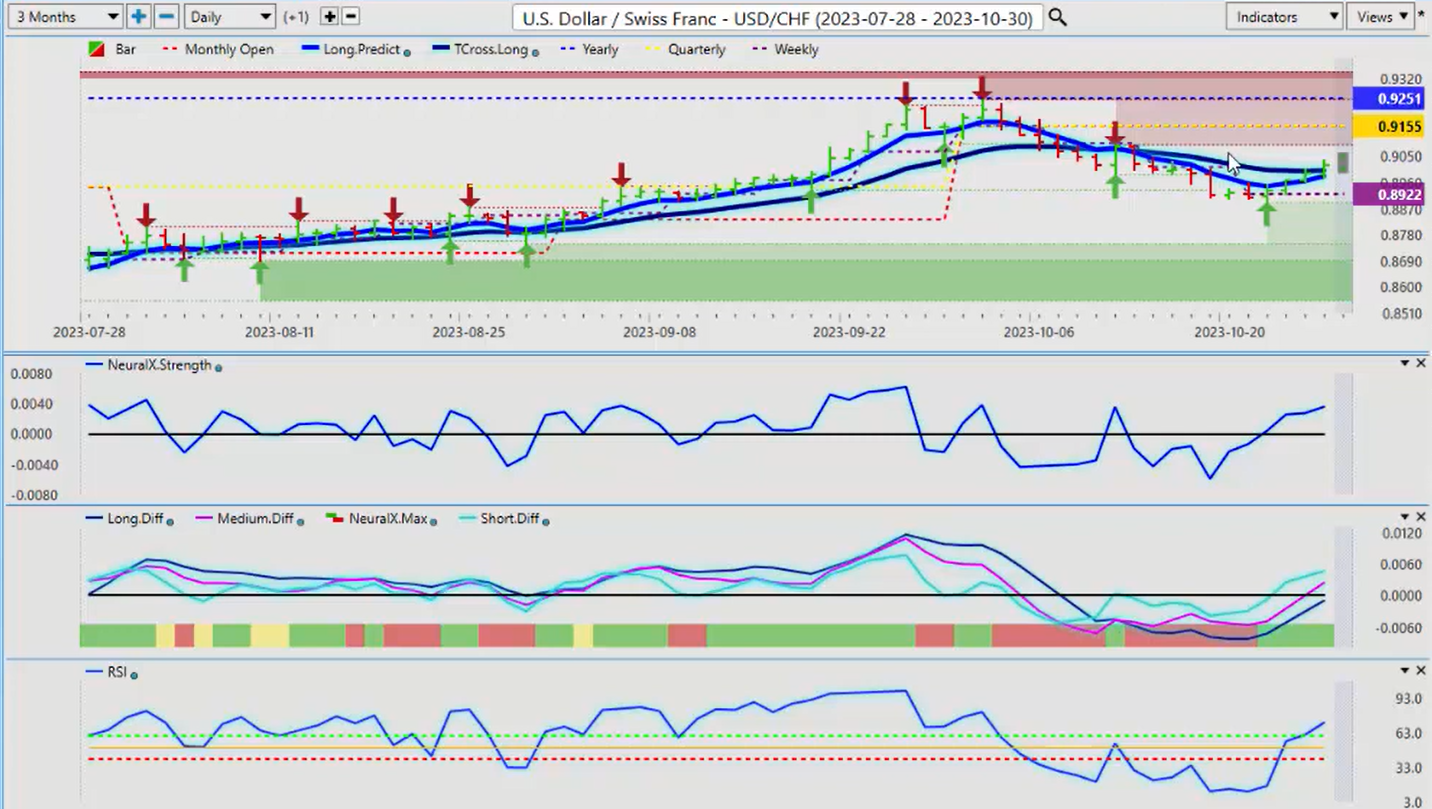
Now, with the dollar index moving higher this past week, we can see that the US Swiss Franc has benefited. The Swiss Franc has weakened, finally. But I don’t believe that this is a long-term trade here, guys. Right now, there’s a very dark ominous cloud hanging over this pair. You’ve got 91.55, the quarterly and monthly that is going to reset obviously on Tuesday or Wednesday. But 92.51. You can see when we come up to the yearly opening price.
This is why we want to avoid rolling performance. I don’t care about 365 days or 30 days ago or 5 days ago. I need proper anchor points to make sure I’m checking the performance. The performance is that the US dollar has not done well against the Swiss Franc, that’s a fact, not fiction. If you bought it on January 1, you’re still losing money. If you did buy it on January 1 of this year and you were waiting to get out, you had the opportunity to reverse your trade and go short off the current yearly opening price, that yearly opening, again, 92.51. So right now, we are likely to see this pair move higher, but it’s got an expiry date here, guys, likely by mid-November or a week this coming Tuesday. The dollar is likely to start losing ground. We also have the Fed this week. Is the Fed going to hike? Probably not. I can’t see any reason for a hike personally, but I don’t work for that bank, for the Federal Reserve, nor would I. But we shall see. But again, the indicators are still saying a little bit more upside, so be careful on this one. Again, on the Monday-Tuesday because what we see again, you can see it for yourself here, guys, hard down on Monday-Tuesday, Wednesday, Thursday, Friday, straight up. So this Monday-Tuesday reversal, be mindful of it.
British Pound versus U.S. Dollar
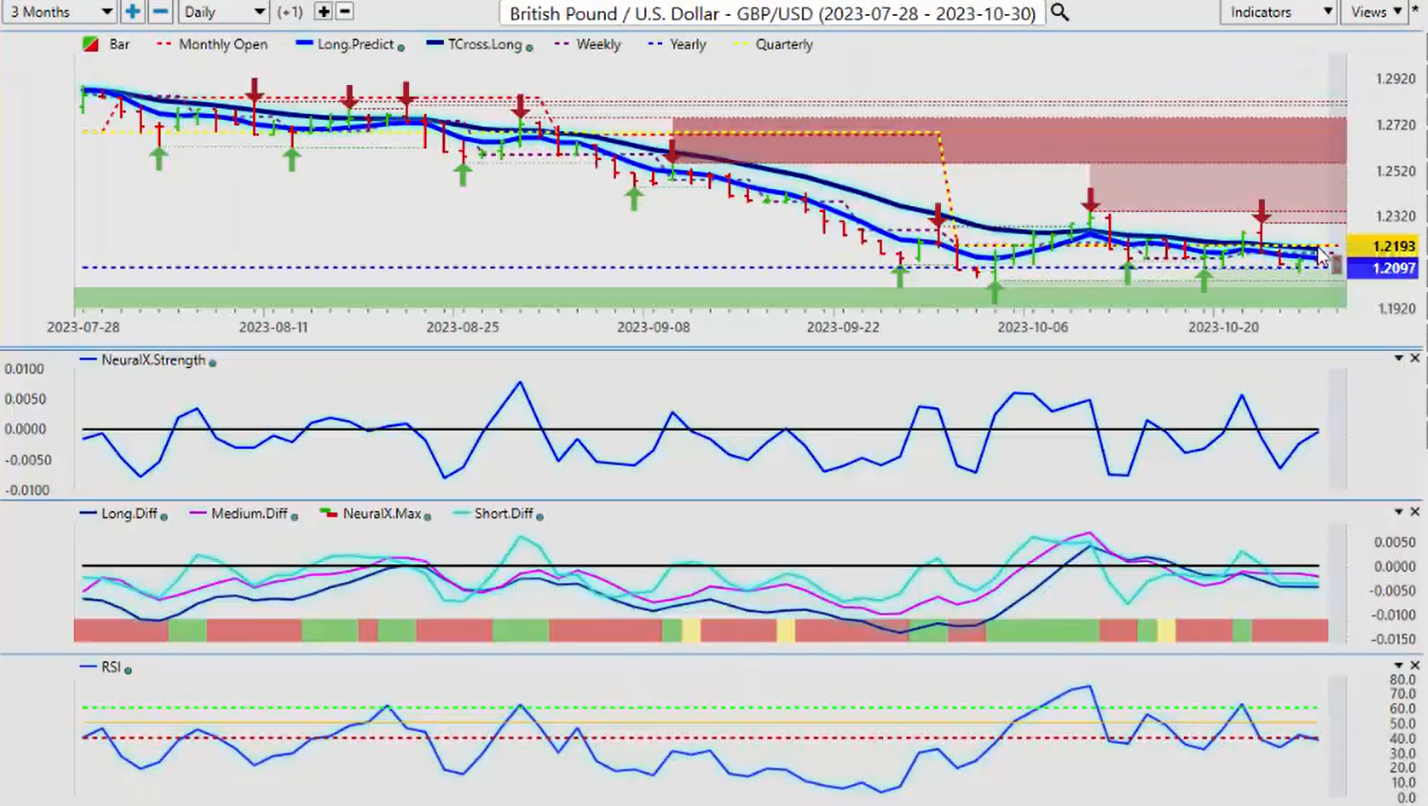
When we look at the British Pound US Dollar going into next week, the one thing they all have in common here, guys, we’re either buying or selling US dollars. So in the coming week, in most cases, leading up to the non-farm payroll number in the Fed, the dollar usually strengthens. It’ll be very interesting to see if that pattern remains with a lot of negativity around the Fed, including me. I’ve been very vocal about what I think of these interest rate hikes, but I think they are coming to an end. So right now, we’re looking at that yearly opening price on the British Pound, that’s coming in at about 1.297. So we’re very close to this. I would respectfully submit that within the next week, we would be looking for longs on this pair in year-end. We just have to get past the dollar strength here. We do have some momentum to the downside; we are still bearish. But again, the neural index strength is pointing up. So the question remains now, how far can we get below the yearly opening price? But can we stay below? You can see we’ve tried multiple times going back into September to break down below that current yearly opening price, and every time there was an excellent buying opportunity. But in my respectful opinion, if the seasonal patterns remain true, I can’t remember a calendar year on record where I bought dollars. I’ve always bought gold. I’ve never bought US dollars in the month of December, a number of different reasons for that. But at the end of the day, the yearly opening price at $1.297, be very careful with shorts down here.
U.S. Dollar versus Japanese Yen
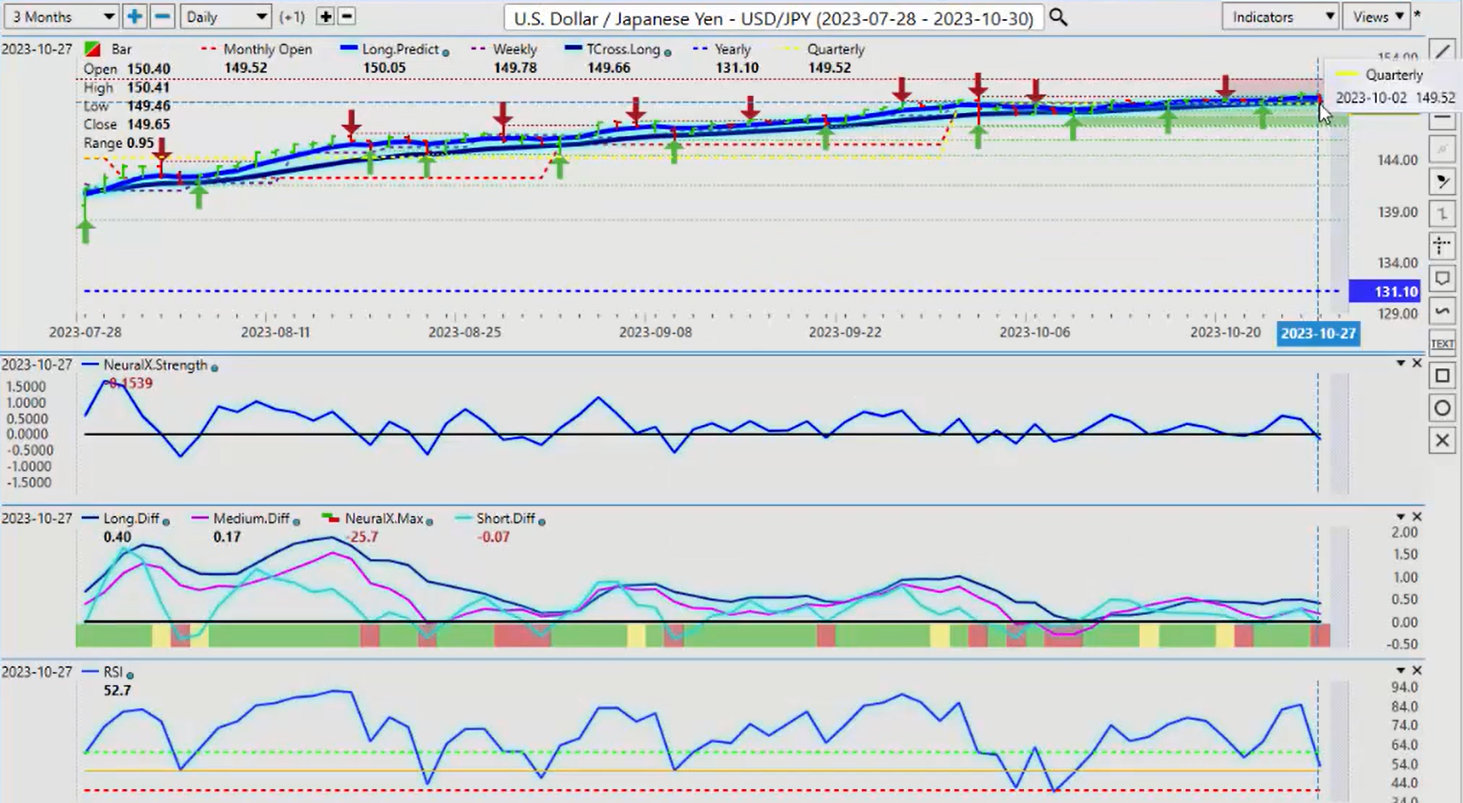
Now, as we look at the Dollar Yen pair, once again, has retaken that 150 level but struggling to hold up above here. Still very much sideways, closing down on the week at 149.65. When it looked like it was going to make its break. So that quarterly opening at 149.52 is which matches the current monthly opening, but that’s going to change on November 1. So always make sure that you attach that to your chart. The point in time indicator from Vantage Point will do that automatically; we’ll reset that monthly opening. But the quarterly price is the one where we really want to watch at 149.52. Keep an eye on that level to see if we… Or an alternative strategy, I can give something to the bulls and something to the bears. If you believe that this is going higher, then you would be looking to buy 149.52. But if you believe that the dollar is going to follow its normal first quarter – remember, it’s the first quarter, not the fourth quarter for the US fiscal year end that was October 1st – the US fiscal first quarter usually doesn’t fare very well, not very well at all. So if you believe that this could go lower, then you would put your sell limit orders below 149.52. And the second we break down below here, but something is going to happen here, guys. You can see we’ve been running sideways on this thing since the beginning of the… almost the entire month. Not exactly the most bullish setup, despite what the media is saying. Again, be very… Yes, it’s a carry trade, I don’t disagree. But in this particular week, in most cases, it would favor the US dollar. But again, that’s got an expiry date of a week this coming Tuesday. But I believe it could come early. Christmas could come early here with the Fed. If the Fed reverses and says, ‘Okay, that’s it, I think we’re done. I think we’ve hit… I think we’re okay with the inflation.’ But the Fed is spinning these unemployment numbers. That’s my biggest issue here, because if I look at the U6 number from that last report, or you can go back and look at the October 9th weekly Outlook, and you can see how I make my argument there. And that look, this U6 is going the wrong way. If that unemployment rate is actually true, then it would have gone lower, but it didn’t. So again, there’s not a lot of buyers up here right now. So I believe that the short side by mid to the end of this month will take hold, and we’re going to see some profit-taking in the carry trade too. Remember, guys, it’s a two-way trade in the Forex. When they go long dollar-yen, they buy dollars and they sell the yen. But when they close that trade, what are they doing? They’re buying those dollars; they’re buying that yen back, and they’re actually selling US dollars.
So if you have any kind of a mass exodus out of the carry trade, this pair could drop hundreds of pips within minutes. So the Vantage Point indicators right now are currently warning of exactly that. So be careful with this one, but I believe there is a short pending on it.
U.S. Dollar versus Canadian Dollar
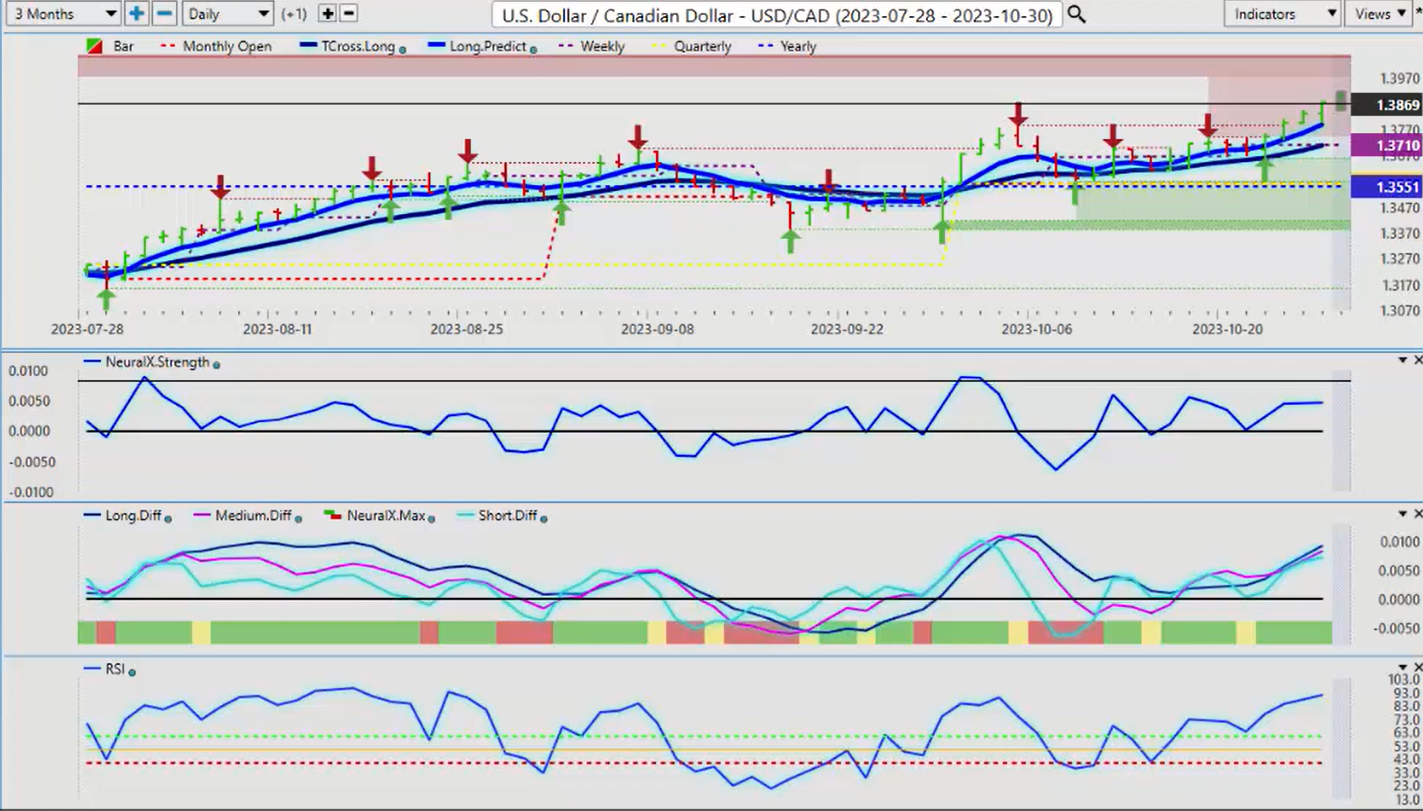
Now, with the US-Canadian pair, once again, the Bank of Canada not doing much to help the Canadian dollar here. But I believe the damage has already been done with these rate hikes, the real estate market cooling off, oil prices cooling off a little bit. But when we look at it right now, again, we are high; we’ve closed extremely high in the week. This pair is one of the most notorious pairs, and there’s another good example of it right there. If I zoom into this chart so you guys can… I get a lot of questions about the Monday-Tuesday reversal on the pairs, which pairs, how often? It’s every week, guys, and this pair does it 90% of the time. So you can see that we close down on the week or on the day on Monday. The bulk of the trading volume was down; we closed below the opening, setting up a bearish signal, only for this thing to go screaming higher the rest of the week. So I would caution everybody, just some free advice, to wait this thing out and watch, be careful of what’s actually going on with it right now. The indicators are actually running flat on the neural index strength; the predicted RSI is at 90.8. So another few days of strength on this pair, and then we start to turn lower. But on a side note, I do believe… looking at the poll numbers of the current leadership of Canada, that there’s going to be an election here, and I think the market smells blood. I think the sharks smell blood in the water here too, looking at the poll ratings of Trudeau; they’re pretty bad. So I think that the coalition here could be in its early stages of a breakdown, and there could be an election, and that could further weaken the Canadian dollar. So we’ll wait and see how this one plays out.
Australian Dollar versus U.S. Dollar
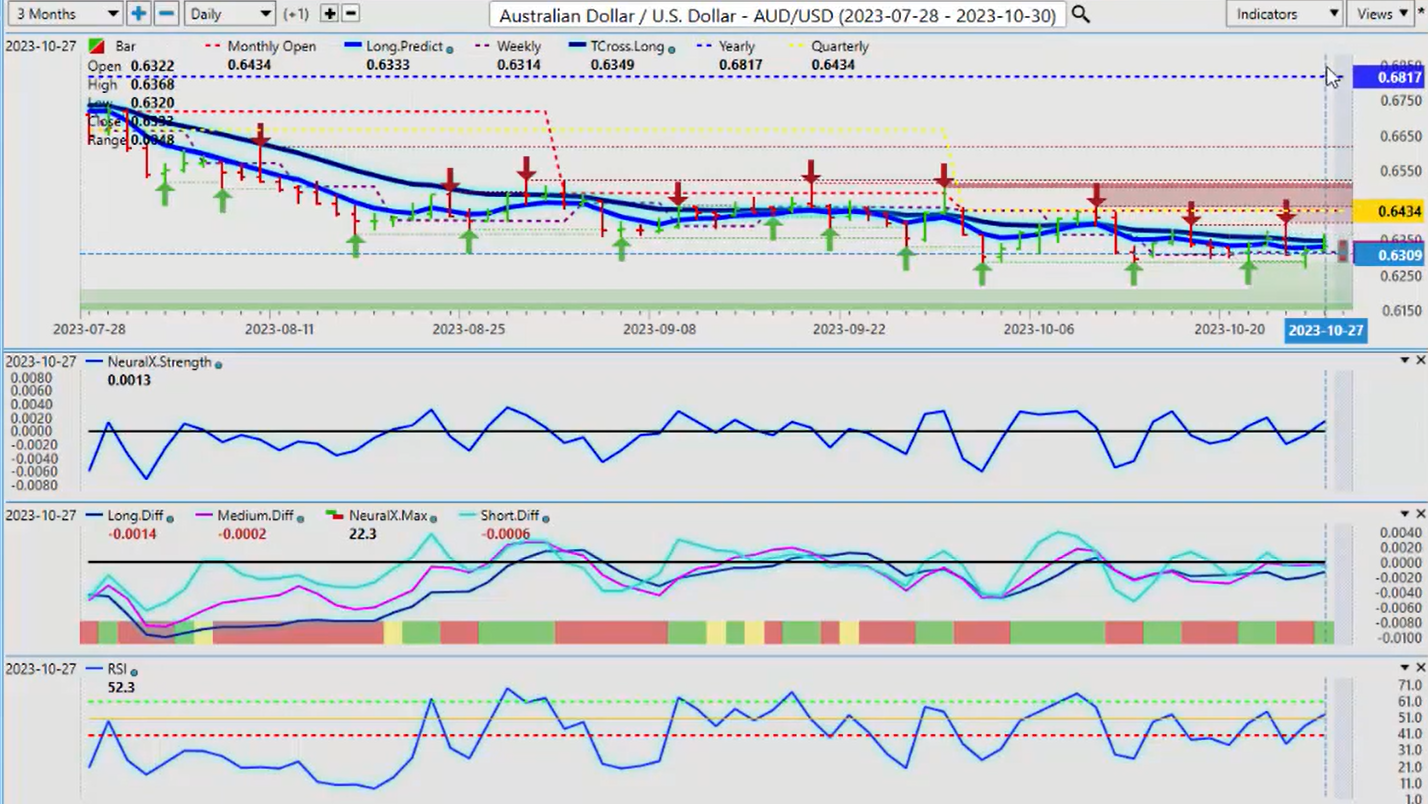
Now, the Aussie currency for next week, once again, with the Aussie, we can see that it remains strongly bearish on the year. The yearly opening price, 68.17. The quarterly opening is at 64, but 64.34. Just remember that that’s going to change on Tuesday on November 1, and the monthly opening is going to probably be down here somewhere. I’m guessing probably around 63.62.50. So then we’re going to have to maintain that downward momentum, and I believe that is going to be very, very difficult from mid-November into… actually probably mid-February. So look for a buying opportunity on this pair. Right now, the Vantage Point software is already picking up on this. The predicted RSI is rising; the differences are rising; the neural index strength is going back up. But we need momentum here in this market, and I don’t believe it’s going to favor the Aussie. But this trade is directly tied to the S&P 500. So it’s not just one trade, guys. The basis of advanced intermarket technical analysis is that one trade or one move in one market will affect another. So if that S&P turns around, which I suspect it will within the next week or two, then these currencies will follow.
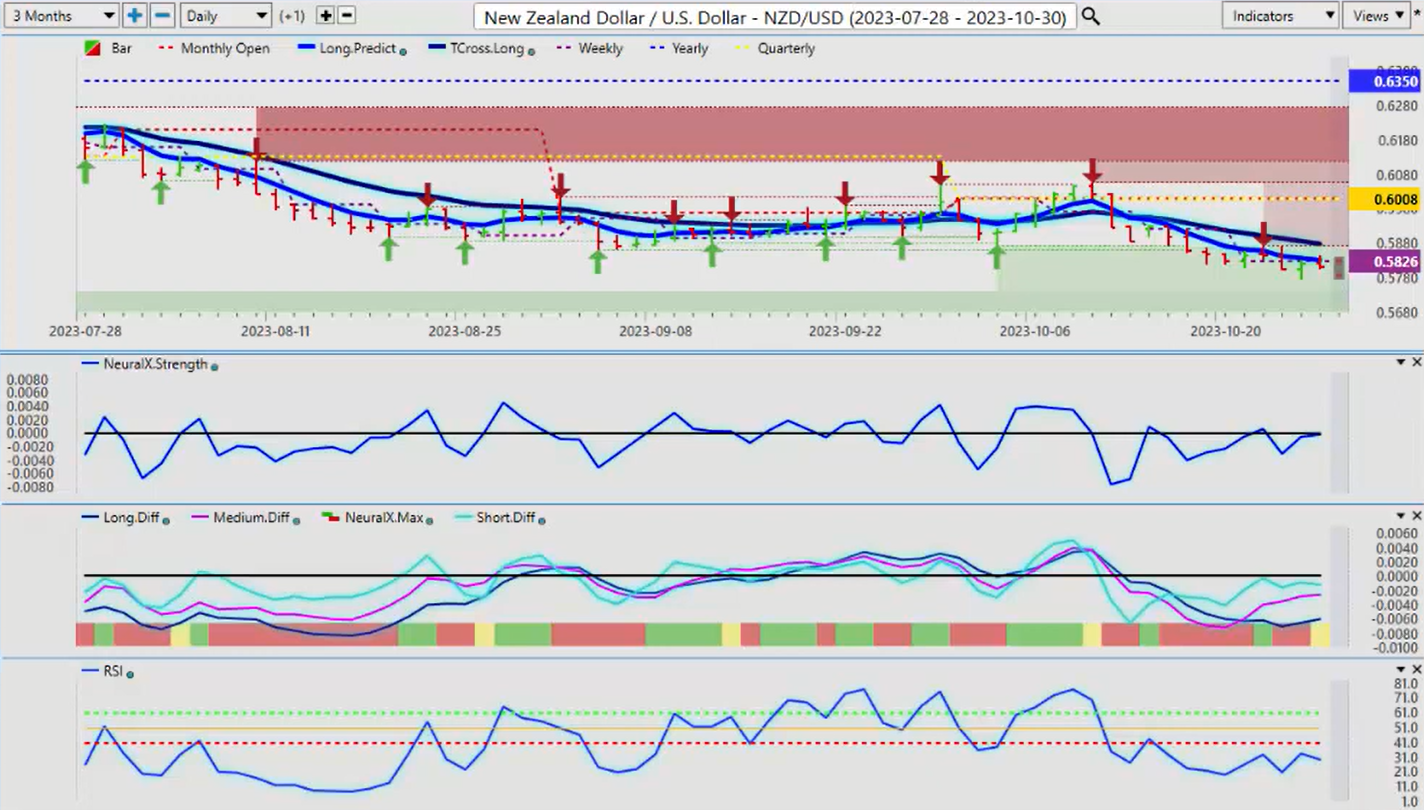
New Zealand Dollar versus U.S. Dollar
US-Canada lower, Aussie-US higher, New Zealand-US higher. We just need to get things settled, calm down a little bit in the Middle East. I’m not sure if a ground invasion will do that or not, but I think it’s possible; we’ll see. But we need to get more of a risk-on sentiment in the market, and that will help these currencies, and it will help the global stock indexes. With that said, this is the Vantage Point AI Market Outlook for the week of October the 30th, 2023.