-
View Larger Image
Welcome to the Artificial Intelligence Outlook for Forex trading.
VIDEO TRANSCRIPT
Hello everyone, welcome back. My name is Greg Firman, and this is the Vantage Point AI Market Outlook for the week of September 11th, 2023. Now, to get started this week, we’ll look at the true performance of the equity markets and how to avoid bull and bear traps in these particular markets with the Vantage Point software.
S&P 500 Index
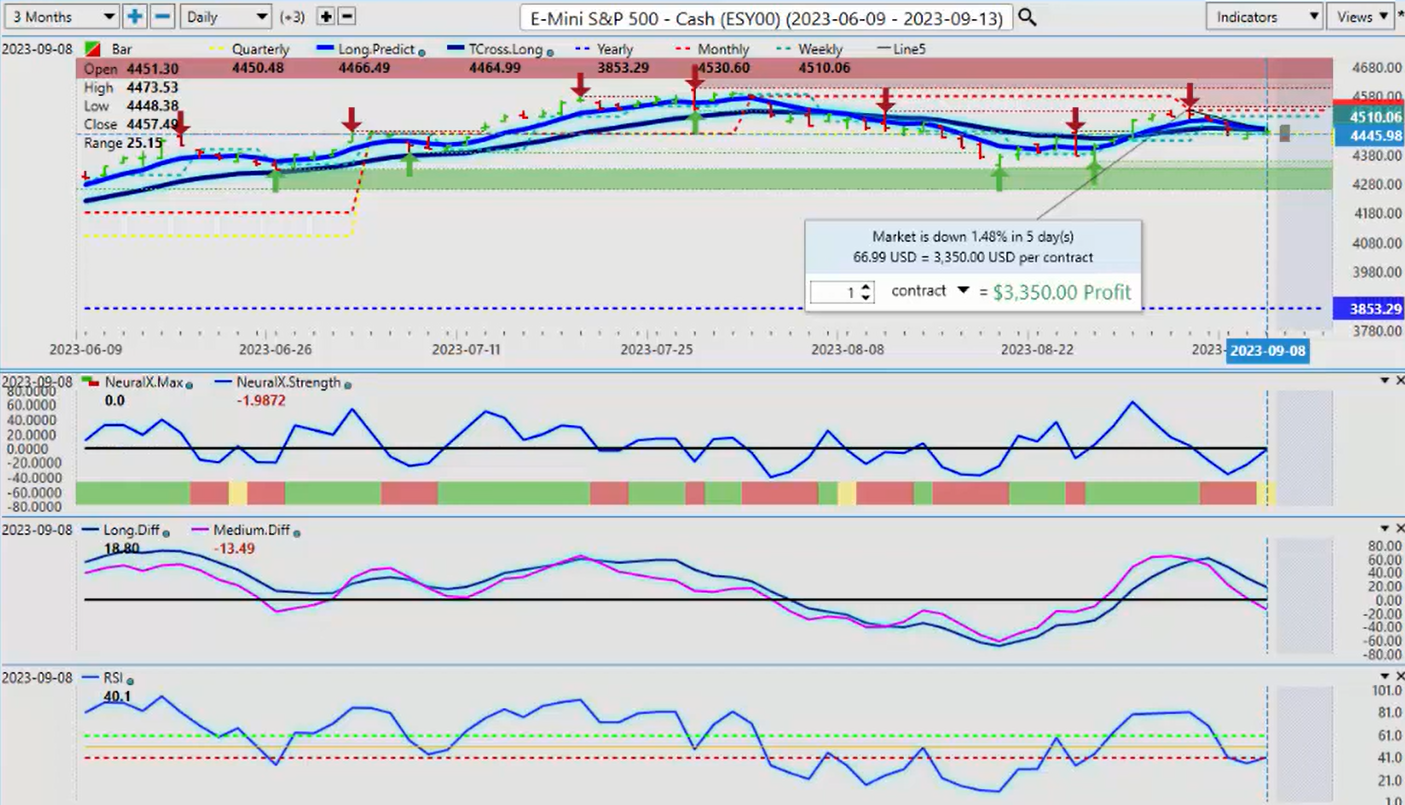
Now, what we can assess here is that the S&P 500, or the SPYs, which is the exact same trade here, had a very, very bearish month in the month of August, and this has continued into the month of September.
Now, as I’ve been discussing in these outlooks and in the Vantage Point live training room about not using rolling performance (random 5 days, random 30 days back) will always lead to lagging information. So when we look at the S&P 500 and how we’ve started the month of September, there’s very little difference as of yet in comparison to August. There was no bullish momentum coming into the market. There were end-of-month flows correcting higher. We start the month, and we immediately move lower by 1.48 percent.
Now, the Vantage Point Neural Index, again, Neural Index strength in my respectful opinion has been deadly accurate. With this, as the market’s moving higher, we can see that the Neural Index strength is actually moving lower. So we do have some signs of life here, but again, using the proper anchor points or pivot points, the current monthly opening price, the current yearly opening price, and more specifically, the current quarterly opening price, that level coming in at 4450, we’ve barely closed above that, but we’ve had a little bit of a reversal on Friday, but very, very small.
Now, our MA Diff Cross also a very strong warning sign at the very beginning of the month that this was going lower, not higher, and there was not bullish sentiment coming into the market. So when we do a comparative analysis of this, and we look at, for example, the SPYs, which mirrors the S&P 500, we see the exact same thing. We’ve got a corrective move at the end of the month of August, but when we look at the accurate measurement of the August performance, you can see it was quite poor. And then September, we used the proper current monthly opening price.
The last thing we want to do here, guys, is go back 30 days from some random point or 5 days from some random point, because this is what often happens. You get caught in a bull trap. So, as we can see here, now, for next week, for the SPYs, we need to stay above 442.92. Now, when we do a comparative analysis on that with, for example, with stocks, if we look at Miracle Grow, we’re down. Again, what often fools the retail trader is they think bullish momentum is coming into the market. But as we can see, when SMG is rising, the Neural Index strength is basically hovering right along the zero line, warning us that we have little to no momentum.
We start our new month, we’re below our quarterly opening price, we’re below our monthly opening price. And again, a quick drop or a significant loss of 7.95 percent. When we look at the Amdocs, the DOC stock, we see the exact same thing has happened. We have a very bearish month of August. We start the new month, and again, we basically have that false bull trap of a stronger move, only for it to turn and immediately move lower, 2.5 percent.
Tesla Motors, another great example of this, a very poor month in the month of August, and then we drop immediately, 4.76 percent. So in no time at all, the trader finds himself down 15-18 on three or four stocks, and then when he adds the index of the SPYs or the S&P 500 to that, that’s another 2 percent down in this bull trap.
So again, we have to be very, very cautious about rolling performance because it’s a lagging indicator, guys. When we use the Vantage Point software, the point-in-time indicator clearly identifies the current weekly, monthly, yearly, and quarterly opening price, and then automatically adjusts this so we can avoid these bull and bear traps. But again, that’s just an example of how using the proper anchor point will help you make better trades. And again, lagging rolling performance is very similar to a simple moving average versus an exponential moving average. That’s the way we want to look at this.
But the one thing we, the main thing we want to look at is that the SMG stock, the DOC stock, Tesla Motors, and the SPYs is all basically the same trade. That’s the primary basis of inter-market technical analysis. Not if either they’re all good or they’re all bad. And in this particular case, they’re all bad. So again, we want to avoid that by using the proper anchor points.
U.S. Dollar Index
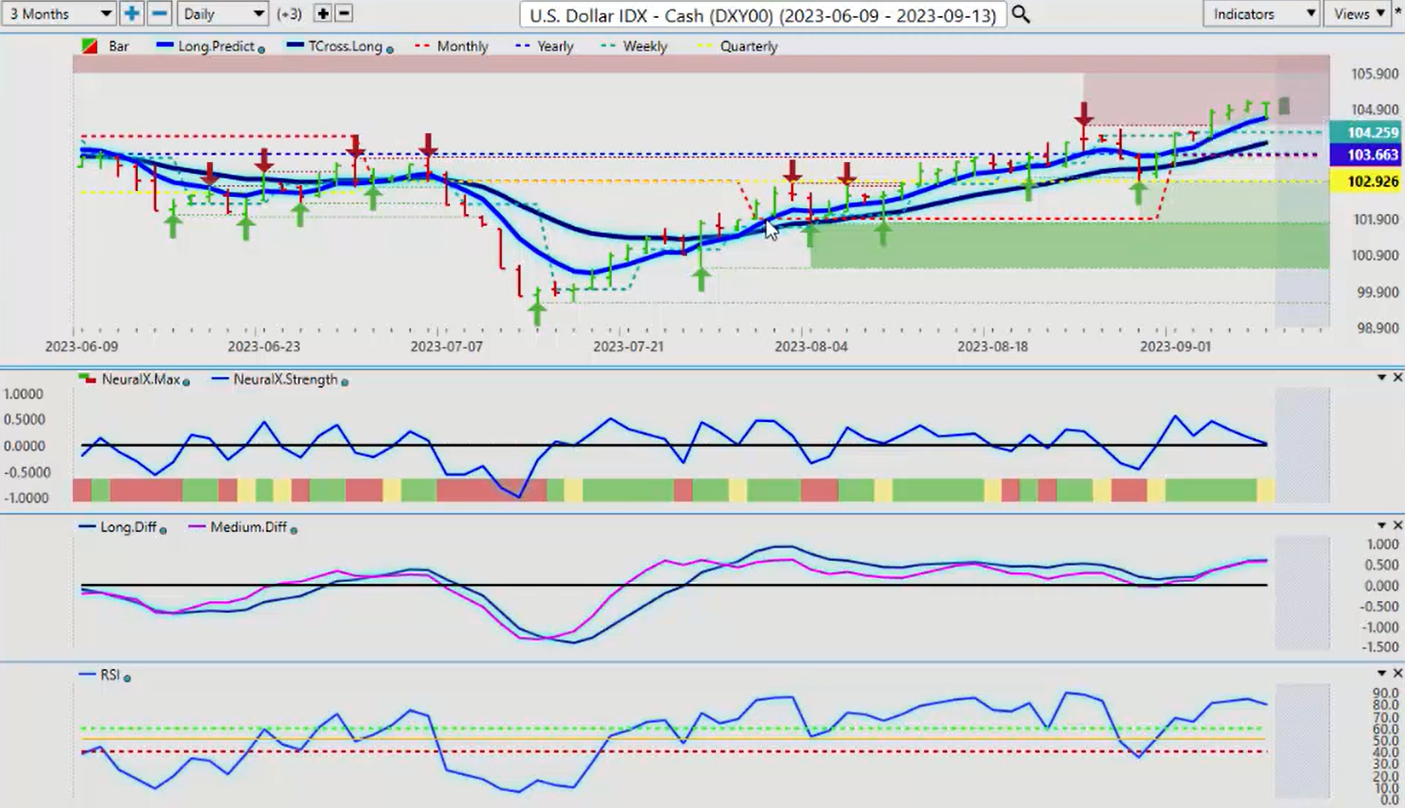
Now, the inverse correlation to that would, of course, be the US Dollar Index. When we look at how the dollar index, first of all, the dollar had a very good month of August, and that has, again, started off the same in the month of September. Now, nothing goes straight up and nothing goes straight down, and that’s why we look closely at the Vantage Point indicators. But we can assess that the dollar index is up virtually the same amount that the SPYs and the S&P 500 are down. So on both of them, we have a cautionary sign on the dollar index.
Now, it would be perfectly normal for the dollar to pull back. We would – that’s where we use the Vantage Point long-predicted and the T-cross long. This is not a standard blue line crossing a black line. It’s the two most powerful predicted moving averages in the software, the long-term crossover without the black line and the triple MA cross using only the T-cross long. This gives us accurate pivot levels or retracement points without the use of Fibonacci and all of these other tools that are highly questionable.
So again, that T-cross long is 103.97. But as the dollar crossed over the quarterly opening price, that’s where we saw the value in buying dollars in mid-August.
Gold
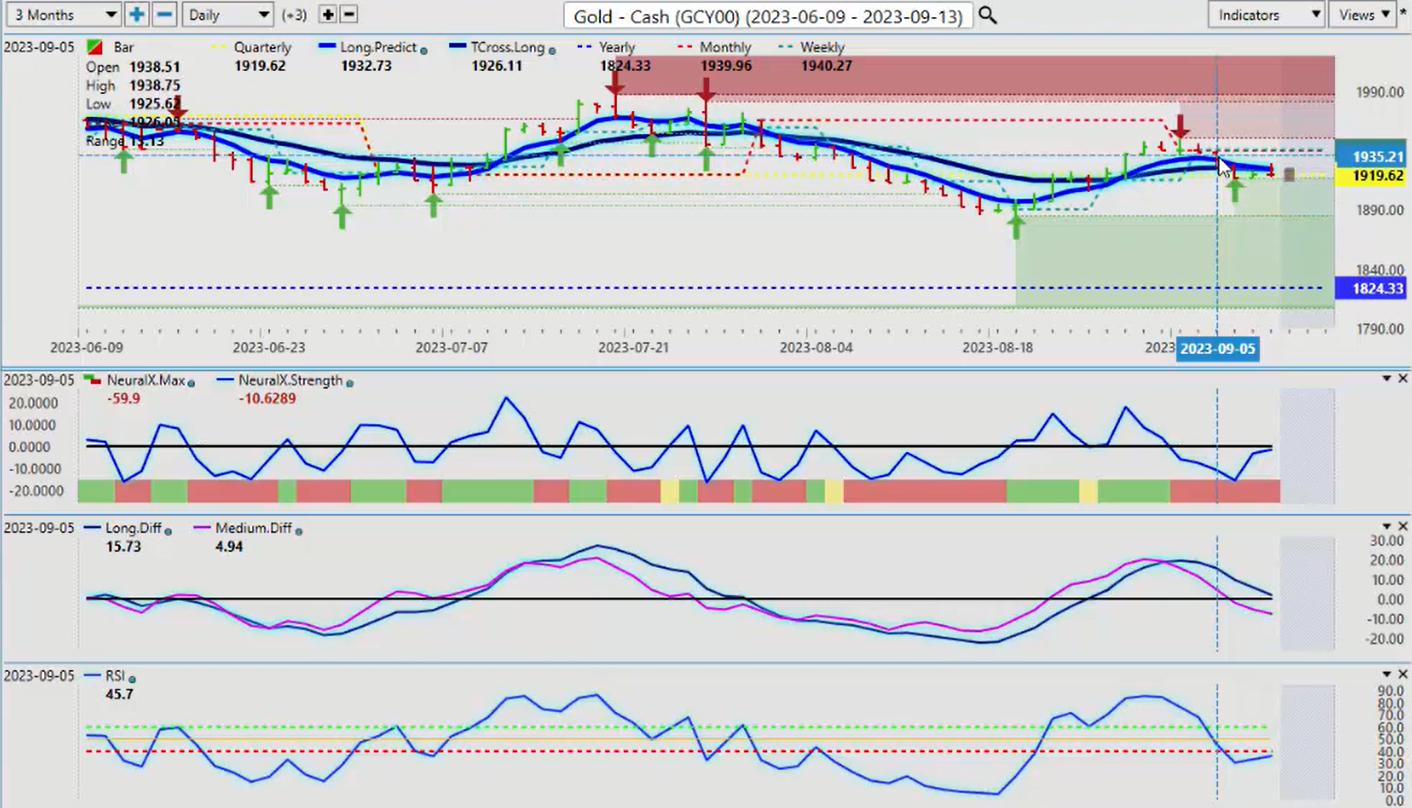
So again, when we look at additional markets here and we look at gold, when you’re using the current anchor point once again, guys, we don’t want to go back and pick five random days, 30 random days, 365 random days because you’re going to get a different pivot level.
So the current quarterly opening, the current monthly opening, and we can see clear as day here, guys, that in 1939, 1940, to begin the month, begin the week, we were using that level as a potential entry point. So again, if I took five random days or 30 random days, I wouldn’t see that level. And that’s why Vantage Point wisely chose to use the current monthly opening, the current weekly opening, the current yearly opening, and an accurately quarterly opening based from January 1st to December 31st. So we always know where these markets are.
So again, gold showing a bit of signs of life, but in my respectful opinion, gold will not reverse until probably sometime in October. October. But for now, we’re likely to see more downside.
Bitcoin
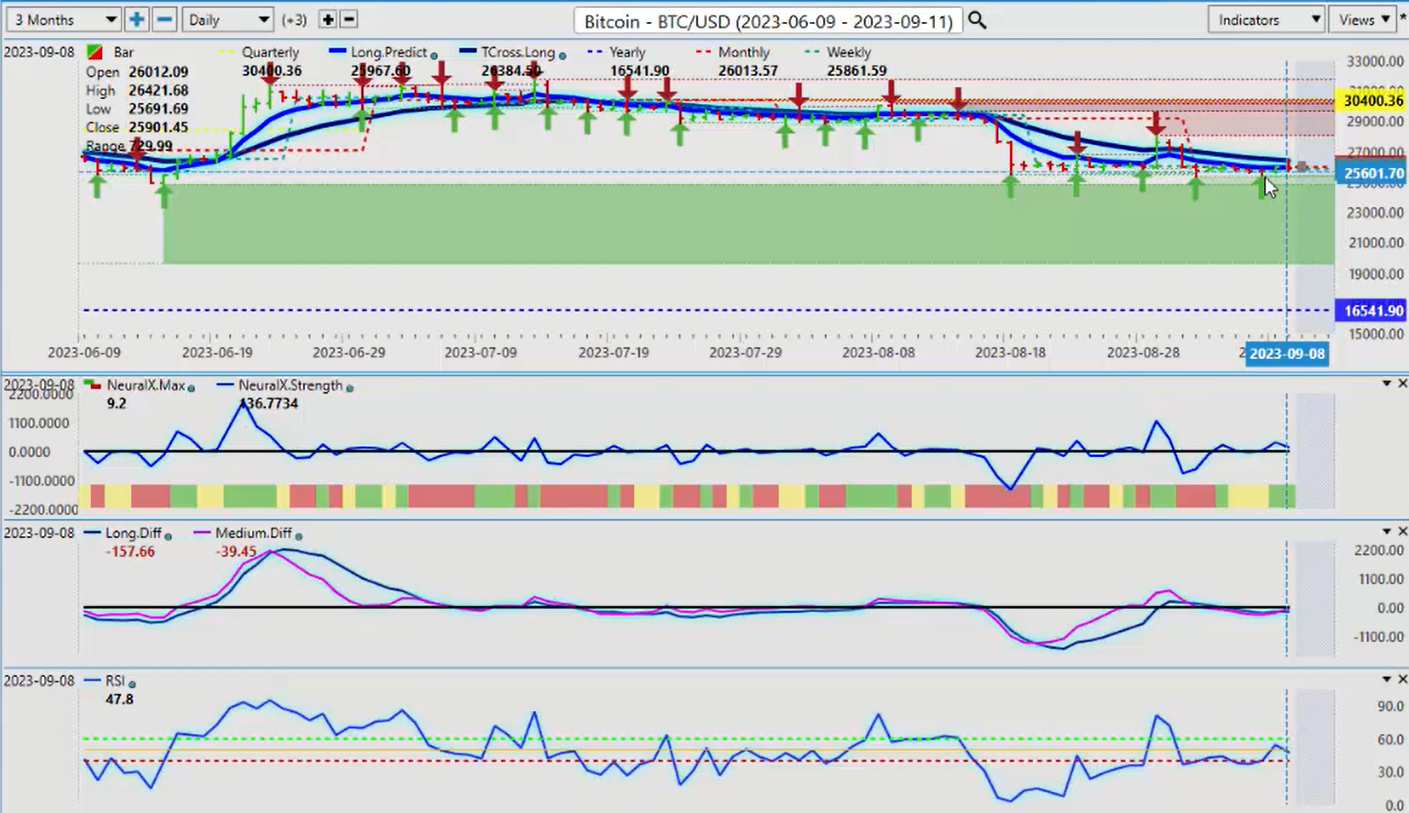
So again, if we look at Bitcoin and its correlations, again, we want to make sure, because remember, it was back in March and January where they all told us that, ‘Oh, don’t buy Bitcoin. It’s going to go to 7,000.’ No, and the Vantage Point live training room, it was projected that Bitcoin would return to a very minimum the 25,000. Markets exceeded my expectations by getting over 30,000.
Bitcoin will come into a very strong seasonal pattern in late September, early October. But right now, we can assess we have absolutely no sellers on this. Our neural index strength is holding above the zero line, but just barely. So again, not a lot of momentum at this time. But soon, guys, in about three weeks’ time, we should see Bitcoin buyers come out of the woodwork here because it’s a seasonal pattern.
So again, we don’t want to go back a random 365 days. We want to look at seasonal patterns that identify it from the month, the quarter, even the day, what something does on the day. But these year-over-year seasonal patterns in Bitcoin have been very, very strong between late September and early November. So that’s what we would essentially wait for for some kind of additional movement.
Crude Oil
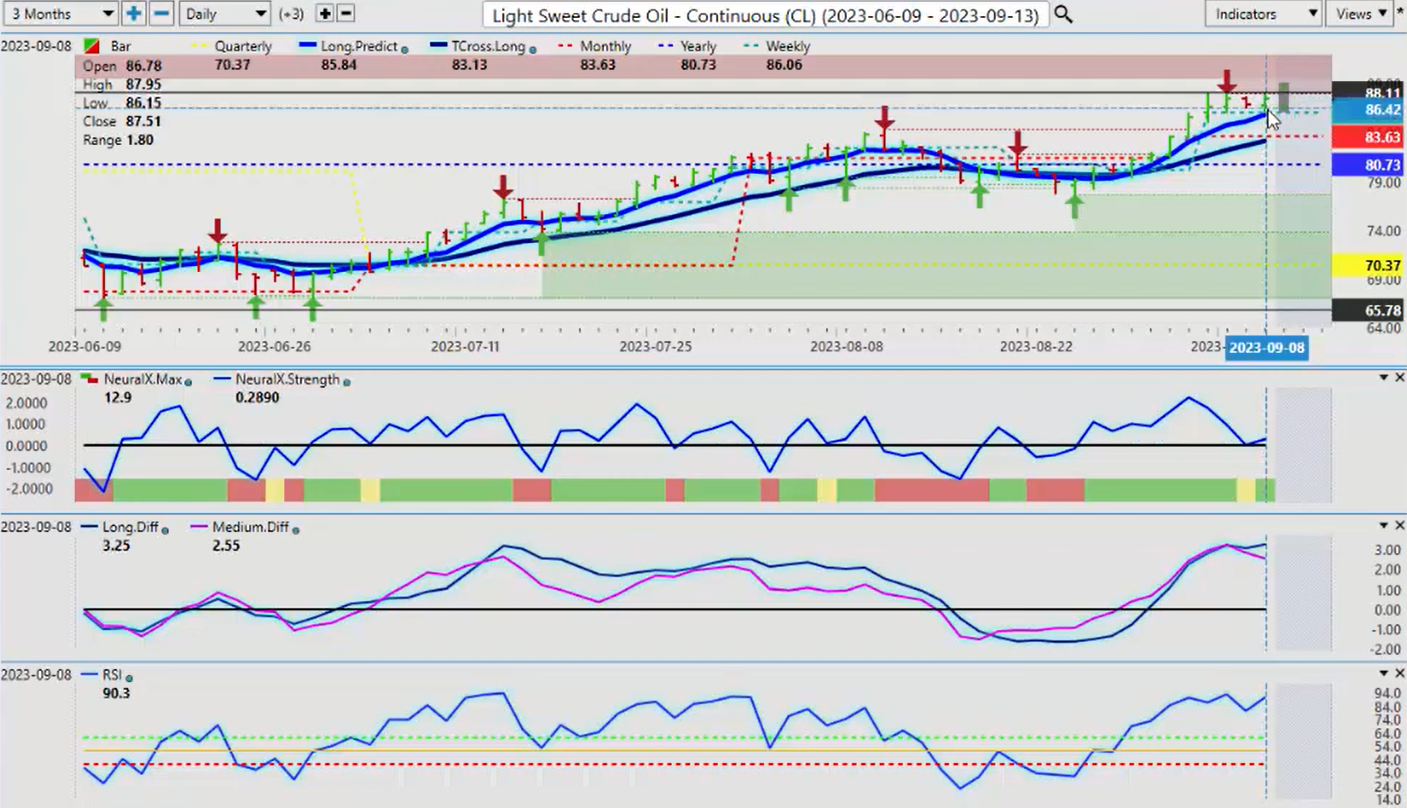
Now, with light sweet crude this week, once again here, guys, we can draw right onto our Vantage Point software. But what I can assess here is that we’re running out of buyers up here. We have spent four days sitting at this high point coming in around 88.07. So for oil to break out to the upside at this particular level, at this particular time of year, will be very, very difficult. So again, be very, very cautious of a bull trap up here, because summer driving season is coming to an end. Oil’s very seldomly does well in the month of October.
And each day that goes by, we get closer to October, November, where again, we’re going to run out of buyers. So right now, we have a very mixed signal here. But on a breakdown of our long-predicted at 85.84, we would very quickly, again, in my respectful opinion only, target 83.18. We use these Vantage Point predicted moving averages as levels to buy and sell from, but also to tell us who’s in control, the bulls or the bears.
So again, right now, our quarterly opening is 70.37. Oil is having a fantastic quarter, but the further we move away from 70.37, the more likely it is we’re going to retrace to that. That has absolutely nothing to do with waves, Fibonacci, all of these things, guys. We’re simply moving into a seasonal pattern, time of year, where basically, it would be very, very unlikely for a firm break to the upside. But I would suspect we will get one more final move to the upside to flush out anybody that’s thinking about going short. So whenever you see a day coming up in the next few weeks where you get a big move up in oil, that’s your opportunity to go after that particular short.
Euro versus U.S. Dollar
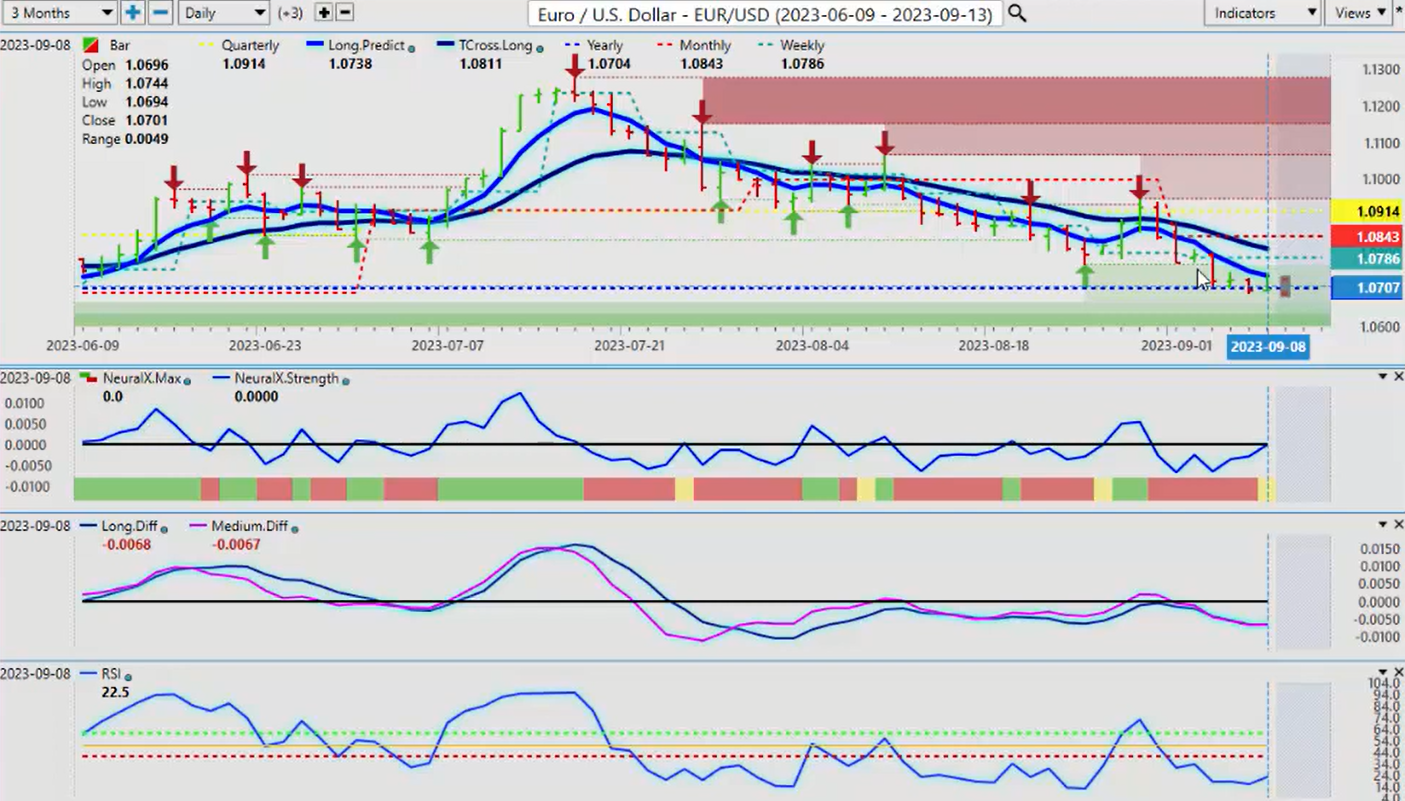
Now, when we look at some of the main Forex pairs going into this week, again, this was highly predictable that the Euro was going to go lower. Now, case in point here, guys, this entire past week, we have been hung up on this invisible support level, that the average trader never sees, the current yearly opening price. The last thing I want to be doing is measuring the last random 30 days, the last random five days with a rolling performance model because it’s incredibly misleading and again, incredibly lagging. So what we look for here is, can we break down below the yearly opening price, 107.04? This is the key level you want to watch either way.
In my respectful opinion, the strength and the seasonal strength in the dollar will start to subside potentially as early as the first or second week of October. But again, if the Euro cannot break down below 107.04, then there is a very, very strong possibility of a significant reversal back to our T-cross long towards 107.38, but more specifically, 108.11, which I think is likely before the next leg down, if we even get another leg down in 2023. We’ve got the ECB, I believe next week, that will be volatile to say the least. But this is where our Neural Index strength comes into play here, guys. We’ve got the yearly opening price at 107.04, and we have a rising Neural Index strength that is now approaching the zero line. That’s going to cross. That has triggered a cautionary sign on the actual Neural Index. So when you’re looking at both of these two indicators together, then shorts would be – this is a classic bear trap, guys. So again, what we would look for is a sustained break of 107.04 before we would add additional shorts. But shorting down here because the media tells us to be very cautious about that, okay? And again, know your levels, guys. That’s the main thing I can say.
U.S. Dollar versus Swiss Franc
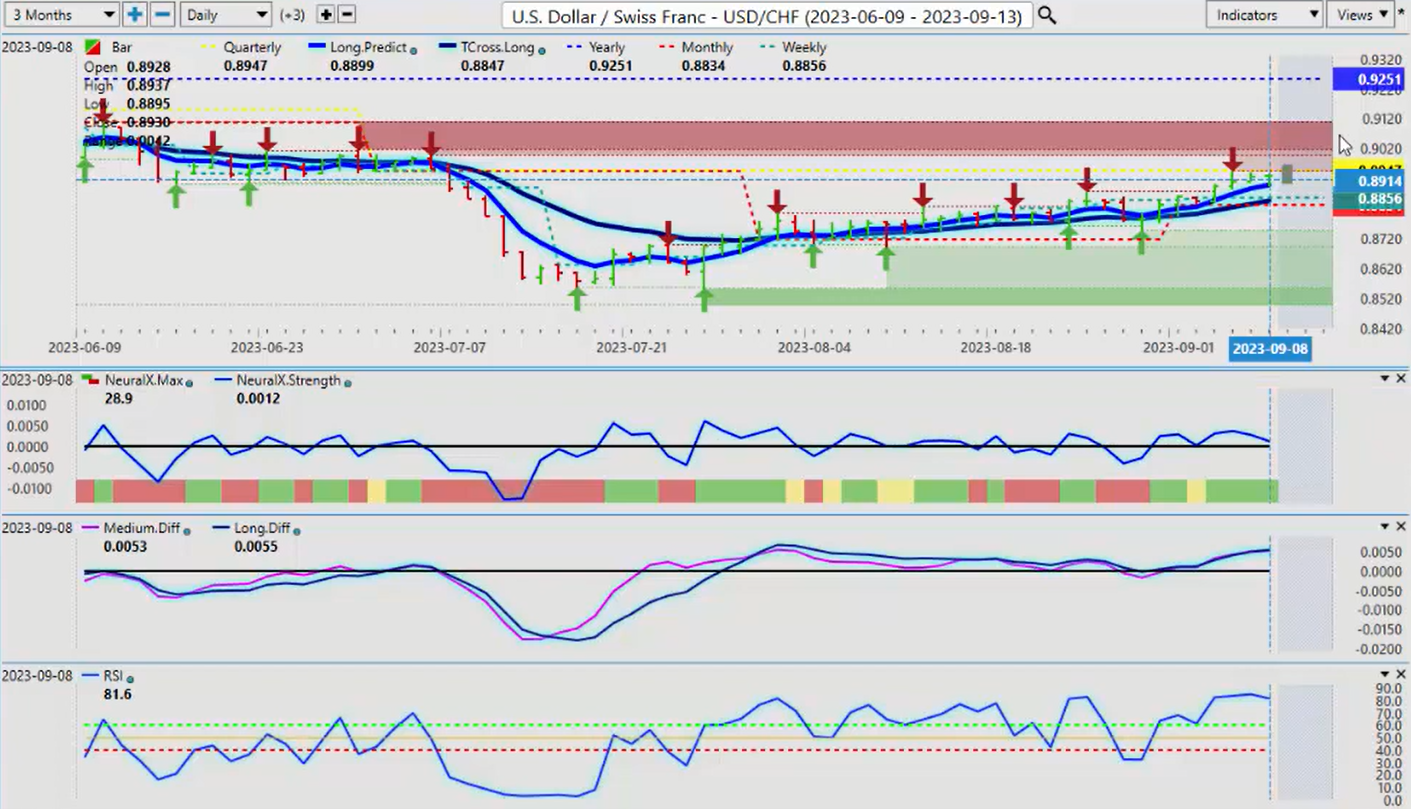
Now, the US Swiss Franc, again, a very, very good long trade, as was suggested last week. We are likely going to move towards the quarterly opening price. Now, with the Vantage Point Point in Time Indicator, that gives me a target point that I need to clear, 89.47. So again, looking at this from last week’s presentation, and more specifically looking at the current monthly opening price, not a lagging tool that’s five days, 10 days, 20 days, 30 days, 365 days. I need to know what it’s doing right now, and this is the structure of the dollar, the current monthly opening price. So we need to break free and clear of that if we have any hope of targeting 92.51.
The Vantage Point Neural Index Strength, it’s going the wrong way, warning us of potential a corrective move in the dollar, not a new trend, guys, a corrective move. There’s a big difference between those two statements. So again, again, we’ll watch the Neural Index Strength and see if we can break down below the zero line.
British Pound versus U.S. Dollar
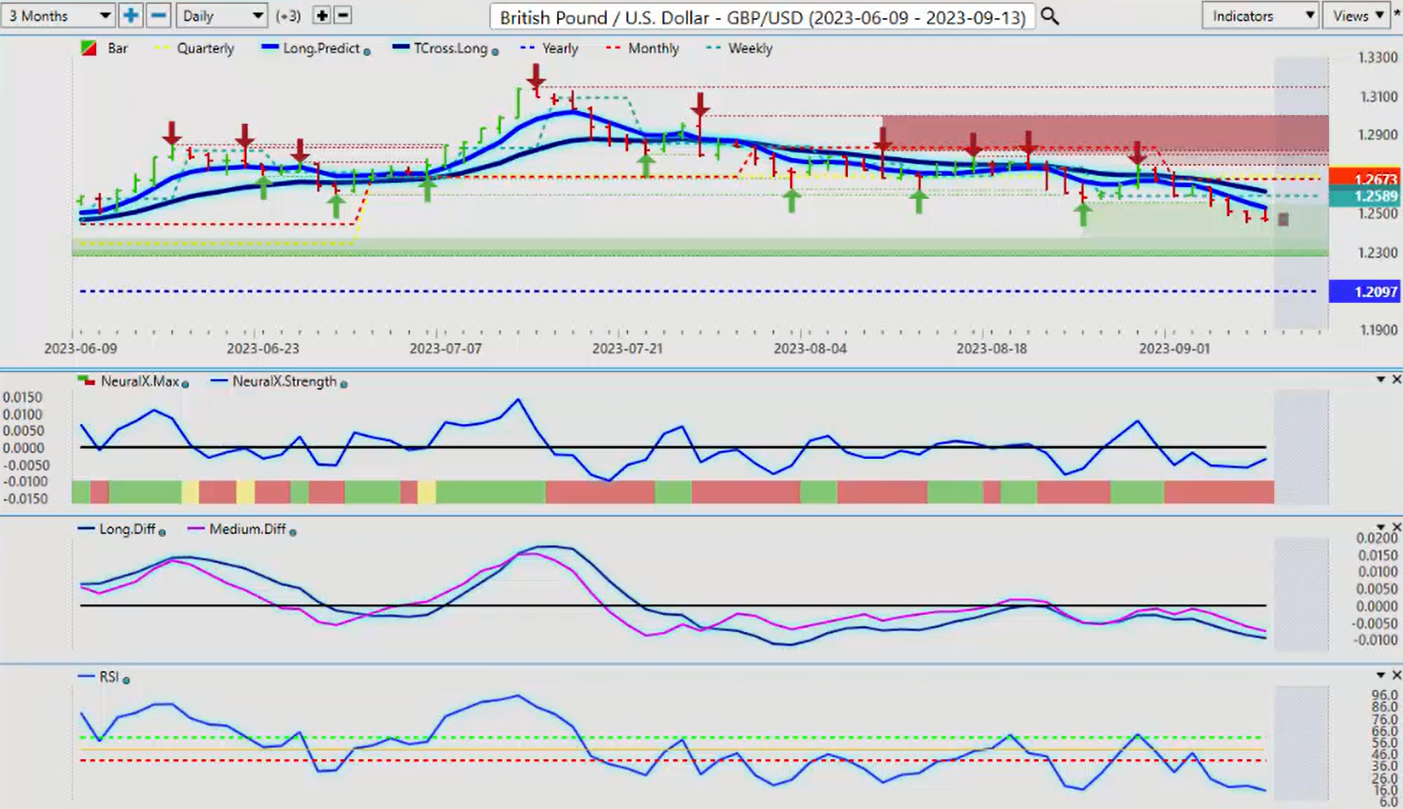
The British Pound US Dollar, these trades have all one thing in common. Very much what I wanted to show you with the SPYs, the S&P 500, and those stocks that I showed you at the beginning of the presentation. They’re all the same trade, guys. In the Forex Market, we’re either buying or selling US Dollars. Don’t lose sight of that. Okay? They are not independent currencies per se. For the most part, they are, I will concede, but for the most part, you’re either buying or selling dollars. We’re in a phase of buying dollars in the month of September. We just have to get through some corrective moves. So right now, we’ve lost some very significant levels, and yet again, a good comparative analysis by using the current monthly opening price, the current quarterly opening price, those levels are 126.86 and 126.73. All of our resistance was there. Here you will never get an easier trade than this, guys, as long as you’re using the proper anchor points and putting any type of rolling performance model to the sideline where it belongs. It’s a lagging tool because, again, one could argue this was bullish if I went back 90 days, but there was nothing bullish about it.
Right? And again, the seasonal pattern of the dollar is what we follow. So for now, a bit of movement in the Neural Index Strength. It’s warning, again, we could be correcting a little bit higher. But in order for this to reverse, guys, we need to move above the monthly and the quarterly opening price. And in my respectful opinion, that is unlikely until mid-October, sometime in October, because, again, the US dollar, the US is in its fiscal fourth quarter, which will end October the fourth. The first after that, that is the green light for us to start looking at selling dollars. But prior to that, very, very dangerous.
U.S. Dollar versus Japanese Yen
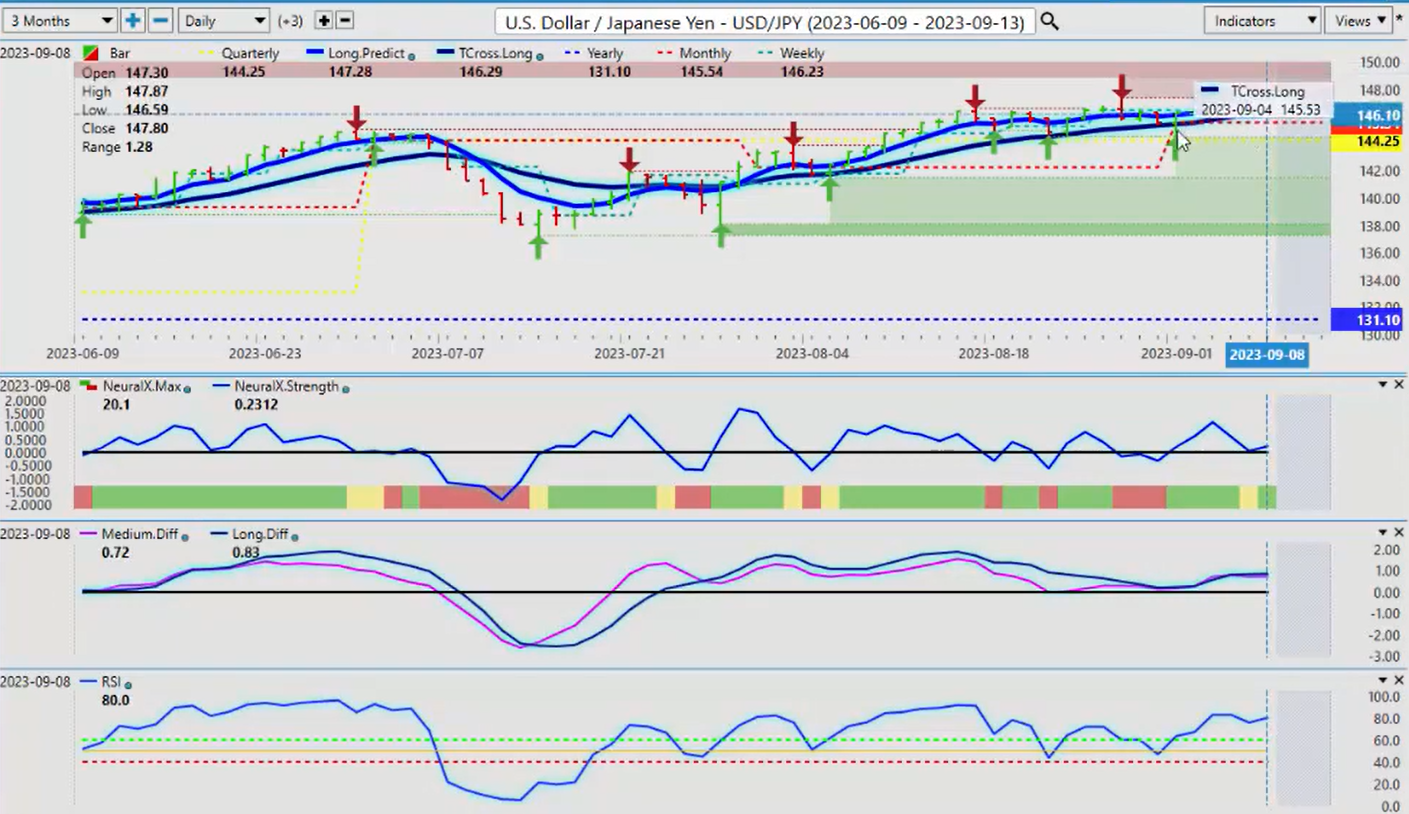
The dollar yen for next week, the dollar yen continues to advance. Again, using a current monthly opening price, we can see that the market used that as a pivot point to extend higher. That was supported by the VP indicators. We could not break down below the 40 level on the predicted RSI. We didn’t have the momentum. The Neural Index Strength accurately picked up on intraday weakness, but that’s not a long-term signal. In this particular case, once again, we’ve come down with the Neural Index Strength, hit the zero line, and we’ve bounced off of that. As soon as that did that, we rallied on Friday. But I will caution everybody that there’s a lot of rumors around, about the Bank of Japan intervention. And I believe those rumors to be true. The Bank of Japan really has a cake in their face for intervening around the beginning of 2022, when the Fed went into this crazy rate cycle.
But that really is now hurting Japan. So intervention or a risk-off scenario, more conflict between US and China, US and Russia, that could send dollar yen down. And that could end the carry trade. I don’t think it will based on current interest rates, but it could prompt some profit-taking in that case. You could see a very sharp drop. So make sure you’re looking at your monthly opening price, that coming in at 145.54, and of course, that all-important current quarterly opening, 144.25, which I believe will give way by mid-October or maybe November. That’s when this will be challenged at that particular time.
U.S. Dollar versus Canadian Dollar
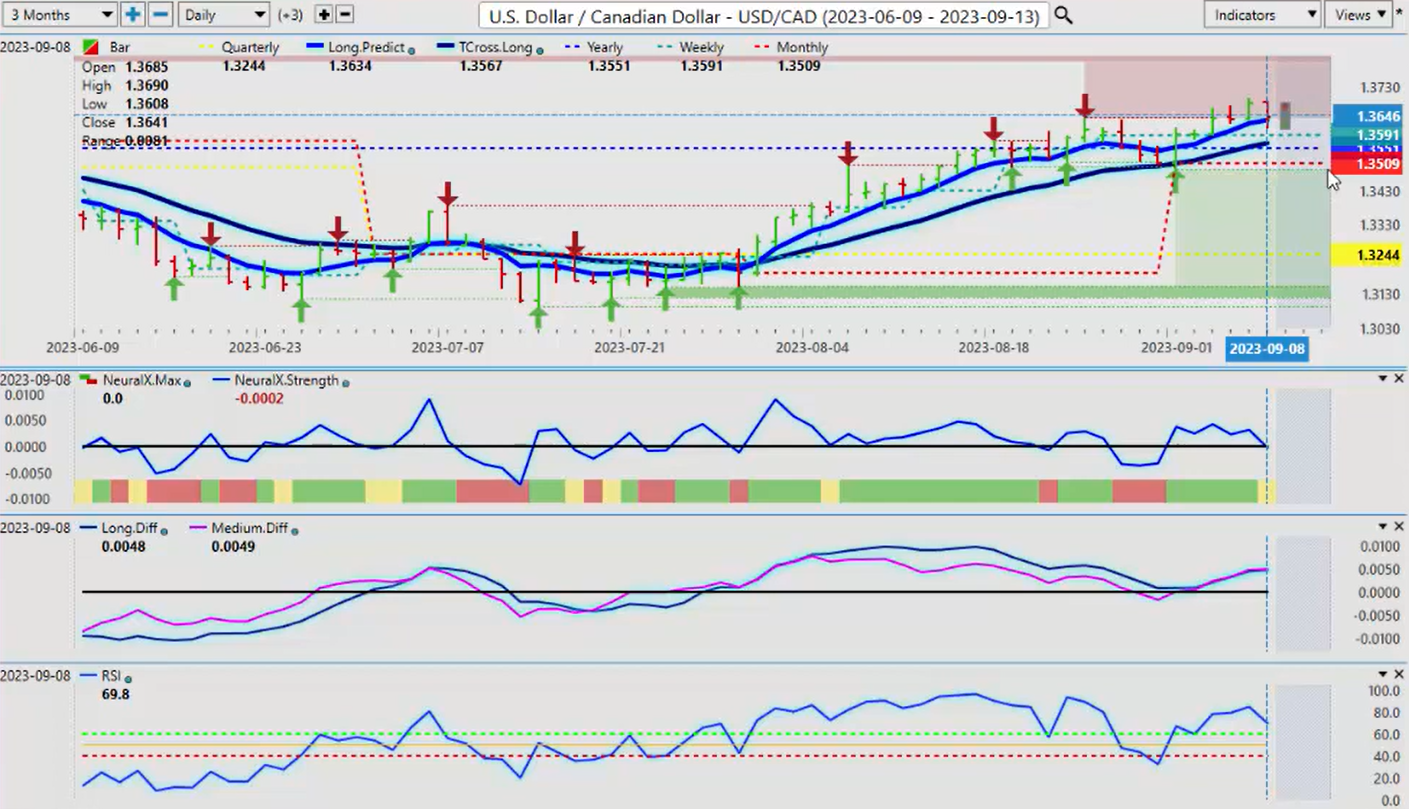
Now, our main equity-based currencies are obviously performing pretty much as well as most of your stocks. They have not been doing very well at all, with the US Canadian being at the top of that list. Now, a little bit better data coming out of the unemployment situation in Canada, but it’s getting a rather hostile environment here in Canada with the Bank of Canada because the common folk have had just about enough of them hiking rates the way they’ve been doing it, flip-flopping back and forth.
So again, I believe, in my respectful opinion only, I should say, excuse me, is that we need an equity market rally. We need an oil rally to favor the Canadian dollar. And I’m just not seeing that at this particular time. But that could happen, at least on the equity side, by mid-October. But again, we remain firmly above the current quarterly opening price, 132.44. We’ve got staggered support at the monthly, that’s coming in at about 135.09. We then go to the yearly opening price, the most critical of the group, that one approximately 135.51.
And then even, as you can see here, this past week, using the point in time and the weekly opening price, intersecting with the Vantage Point Long Predicted at 135.86. Not that trading is easy, guys, but this one was pretty easy. We were doing this every week in the Vantage Point live training room. Monday, Tuesday, reversal, Thursday, profit-taking, based around a five-point plan. Very, very cool stuff, guys. You just need to know what you’re looking for to understand how the primary trend, which was down in the month of August, is continuing on.
Australian Dollar versus U.S. Dollar
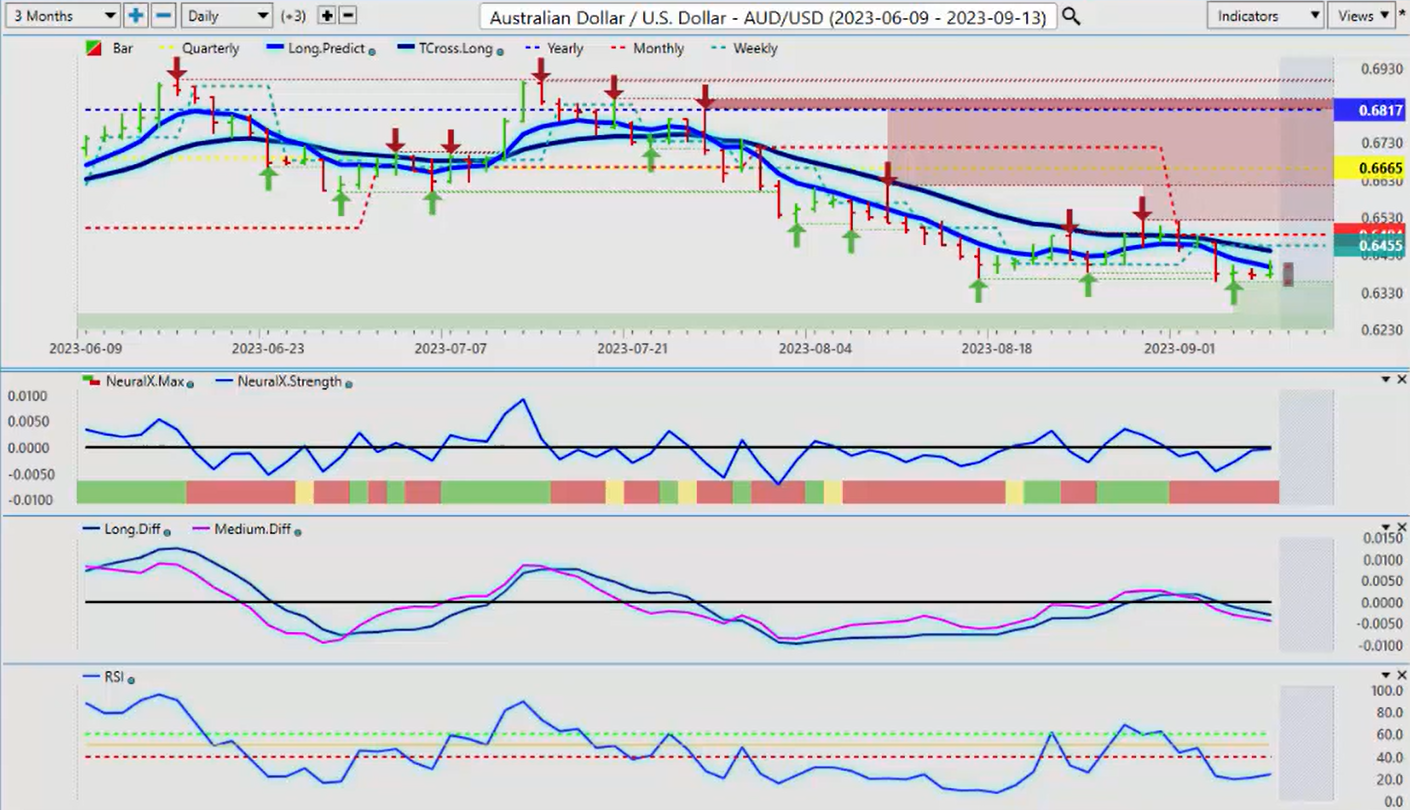
So in my respectful opinion, the Aussie will need the stock markets to rally, the Kiwi will need the same. So we’ve had a retracement point here, but before I buy the Aussie, guys, another easy way to do this is simply set up buy limit orders above the monthly opening price, 60.484, because that means we’ve cleared the T-cross long, the next hurdle would be the monthly opening price. But as you can see, based on an accurate current opening, I could care less, guys, what this did 30 days ago or 90 days ago or 365 days ago.
I need to know what it’s doing right now, and this is the structure of the Aussie currency. Below the yearly opening price, below the quarterly opening, below the monthly. So again, if I’m going to buy this, I need a reason to buy this. And at the current time, sadly, I don’t.
New Zealand Dollar versus U.S. Dollar
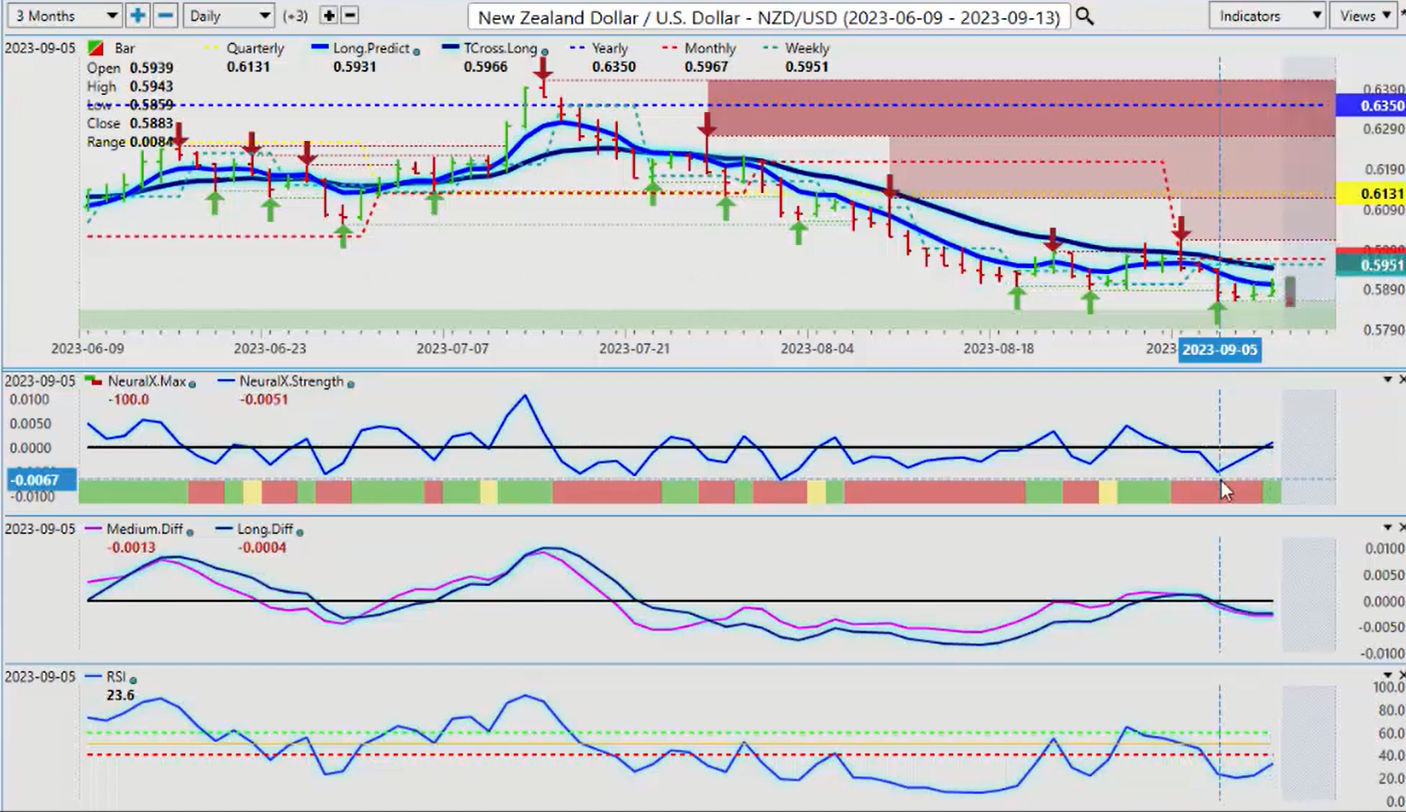
But I will, Aussie US longs, New Zealand US longs, will be very good trades as we move into the fiscal fourth quarter, into the actual fourth quarter, into October, November, and December. The same thing applies to the New Zealand US dollar. But we do have heavy support building down here. And again, I’ve had a chat with a number of you guys on the website here, and I totally agree that the Neural Index Strength is a fantastic indicator because, again, when you combine that with the verified zones and say, ‘Okay, I’m running out of sellers down here,’ so it tells me I’m going to correct higher, the natural retracement point would be the monthly opening price and the Vantage Point T-cross long, both of which are sitting around this 59.67 area.
So as long as we know these levels, we can trade them. So with that said, this is the Vantage Point AI Market Outlook for the week of September the 11th, 2023.