-
View Larger Image
Welcome to the Artificial Intelligence Outlook for Forex trading.
VIDEO TRANSCRIPT
Hello, everyone and welcome back. My name is Greg Firman, and this is the VantagePoint AI Market Outlook for the week of August the 21st, 2023.
SPDR SPY ETF ($SPY)
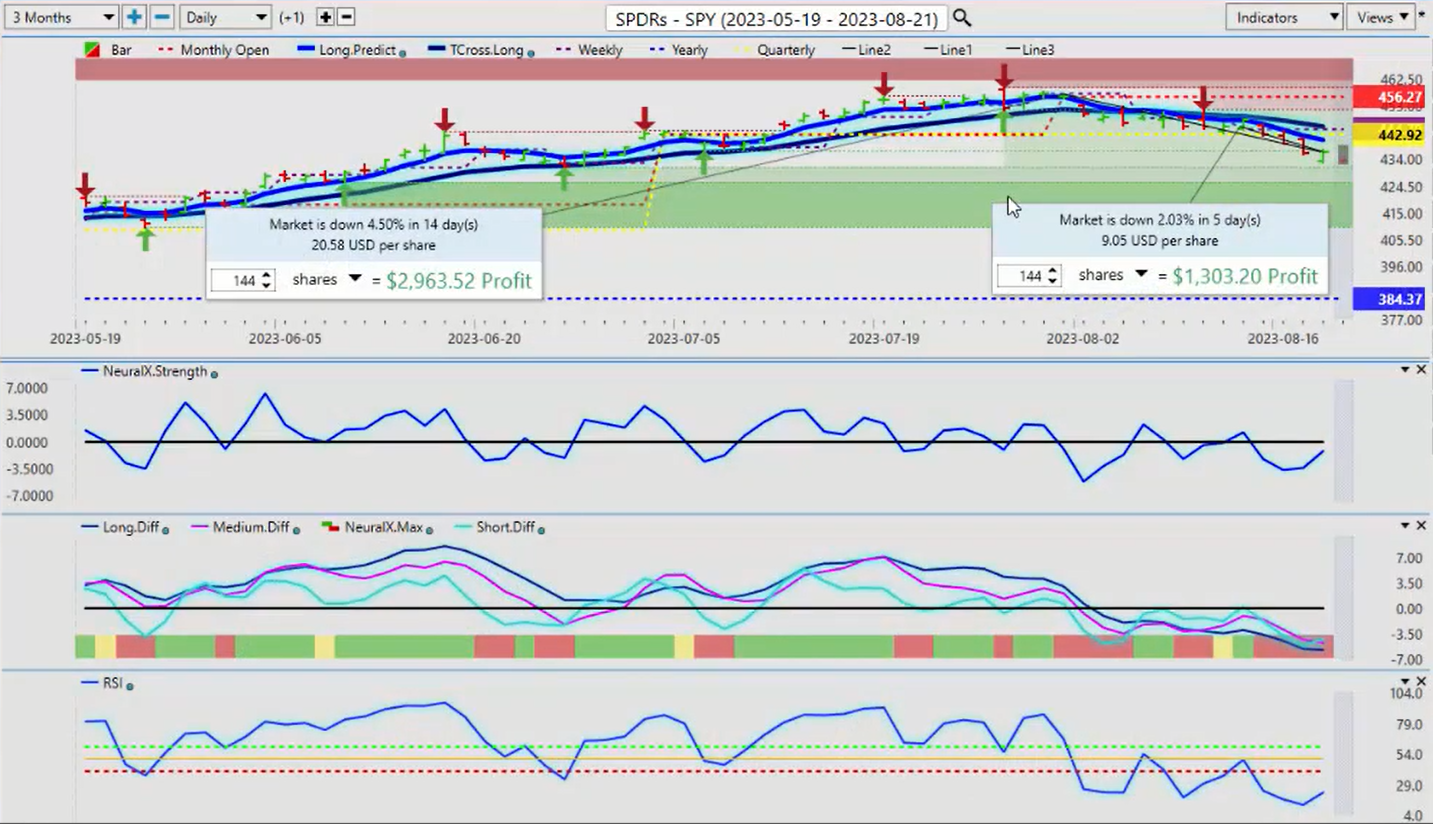
Now, to get started this week, we’ll look at an accurate view of the performance of the SPYs, the S&P 500 without the rolling performance model. We want to make sure that we’re using the correct anchor points measuring our current yearly opening price, our currently monthly opening price, weekly, but now, even the quarterly opening price is going to play a significant part in our trading.
So as we can see, the market on the SPYs for this past week is actually down 2.03%, not 1.73%. The market is currently down on the month, 4.5%, not 3.94%. So we want to make sure we know exactly what the performance on the SPYs and the S&P 500 is in the month of August. Now, my concern with equities here, number one, we had a significant, I think two trillion … A very large number in options expiry on Friday, which I believe has had a negative effect, to some degree, on here.
We worked on that in the VantagePoint Live Training Room, but my bigger concern is we have crossed over the quarterly opening price at 442.92. This is now intersecting with the VantagePoint long predicted and the T-cross long at 440 and 445, so this is all very significant resistance at the current time. If the S&P, the SPYs, and the equity markets, in general, are going to move lower, then we would need to hold below these particular levels, but again, this is an outlook here, guys, not a recap of something that’s already happened, where this video is being done on Saturday morning here on August the 19th, just to point that out. So those key levels need to hold if stocks are going to move lower. This basically is the S&P 500.
U.S. Dollar Index ($DXY)
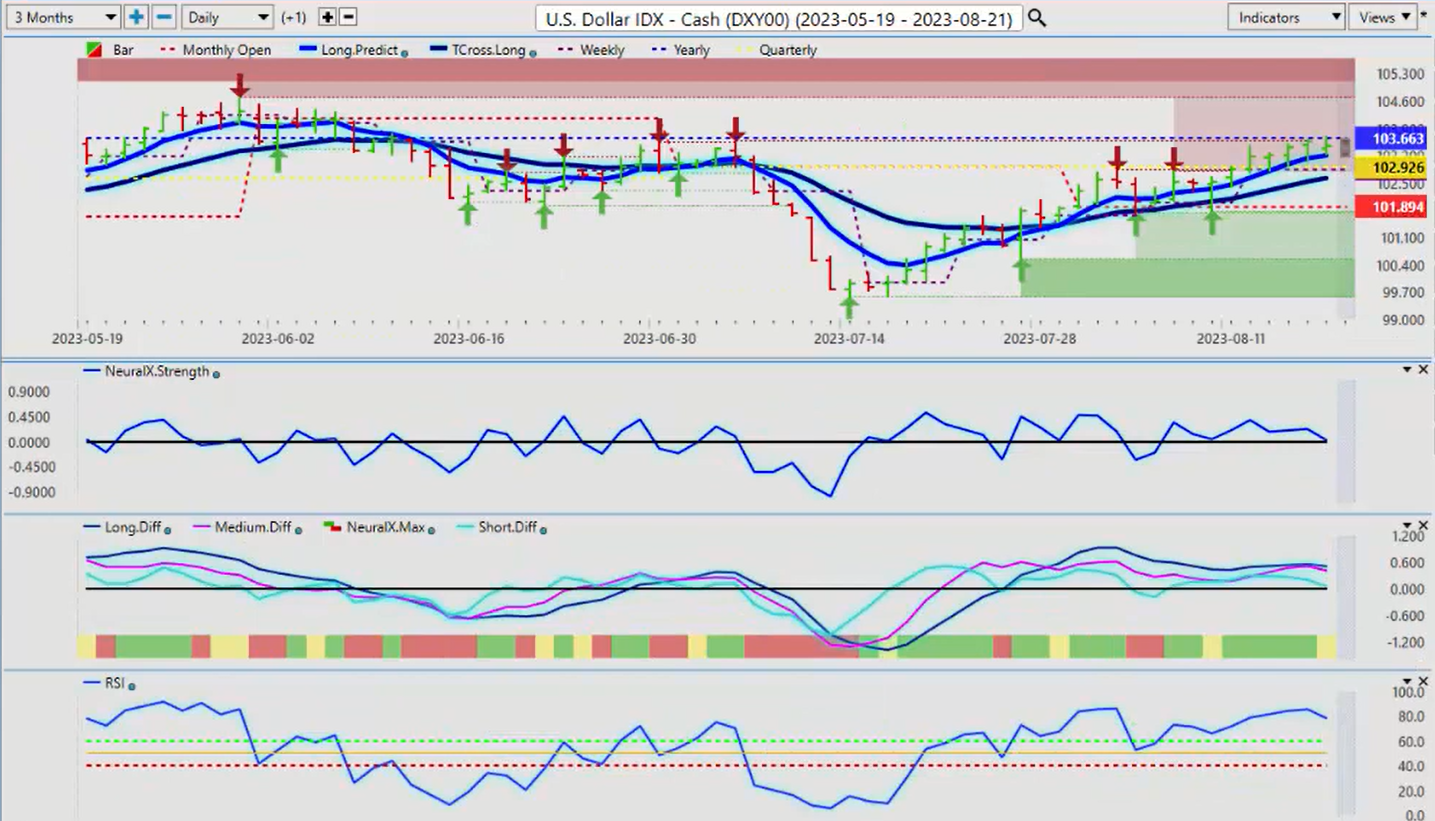
Now, when we cross-reference this to the Dollar Index, once again here, guys, using proper anchor points, rolling performance is a lagging model here. When we look at this right now, the Dollar crossed over the quarterly opening price on August the 14th. However, as you can see from this past week, we have hit made multiple attempts to break through the current yearly opening price. If we look back six months, nine months, it’s not relevant to anything, guys. We look back at the beginning of the month, the beginning of the week, the beginning of the year, so we don’t want to get caught in that narrative back in March of this year, where they told you, “Only buy dollars, don’t buy gold, don’t buy Bitcoin, don’t buy any of these things,” and then the dollar tanks.
Because of that rolling performance model, we don’t want to drag anything from 2022 into 2023. We want to stay current. So right now, usually, a very strong seasonal pattern forms in the dollar. Again, in my respectful opinion only, I believe it’s tied to the U.S. fiscal year. So this is actually the fourth quarter for the U.S., which will end, I believe, on October the 1st.
Then, the U.S. starts its first quarter then. So again, the dollar usually is strong up until about mid-October, and then we start to see it turn down. So the probability that the dollar moves above the yearly opening price is high, but the VantagePoint indicators are not completely on board with that. The predicted differences are pointing down, our Neural Index strength is pointing down. It hasn’t crossed the zero line, but on an up day, the indicators in VantagePoint are going the opposite way.
So in most years, I’m not really looking for that big dollar rally until actually the first, second week of September. After we get back from Labor Day, we still have the dollar cycle, the dollar buying at the beginning of the month, but this may be a little bit early, but the main thing you want to look at here is, again, the current quarterly opening price, 102.92. That is a key level. Our VantagePoint T-cross long is coming in at 102.62, so we know where all of our support is. As long as we’re holding above that level, the probability that the dollar takes out the year that the current yearly opening price at 103.66 is extremely high.
Again, a little bit of a corrective move at the beginning of the week, and then we’ll see where we go, but the closer we get to September, the stronger the dollar usually is, but remember, those fiscal years are slightly different.
Gold
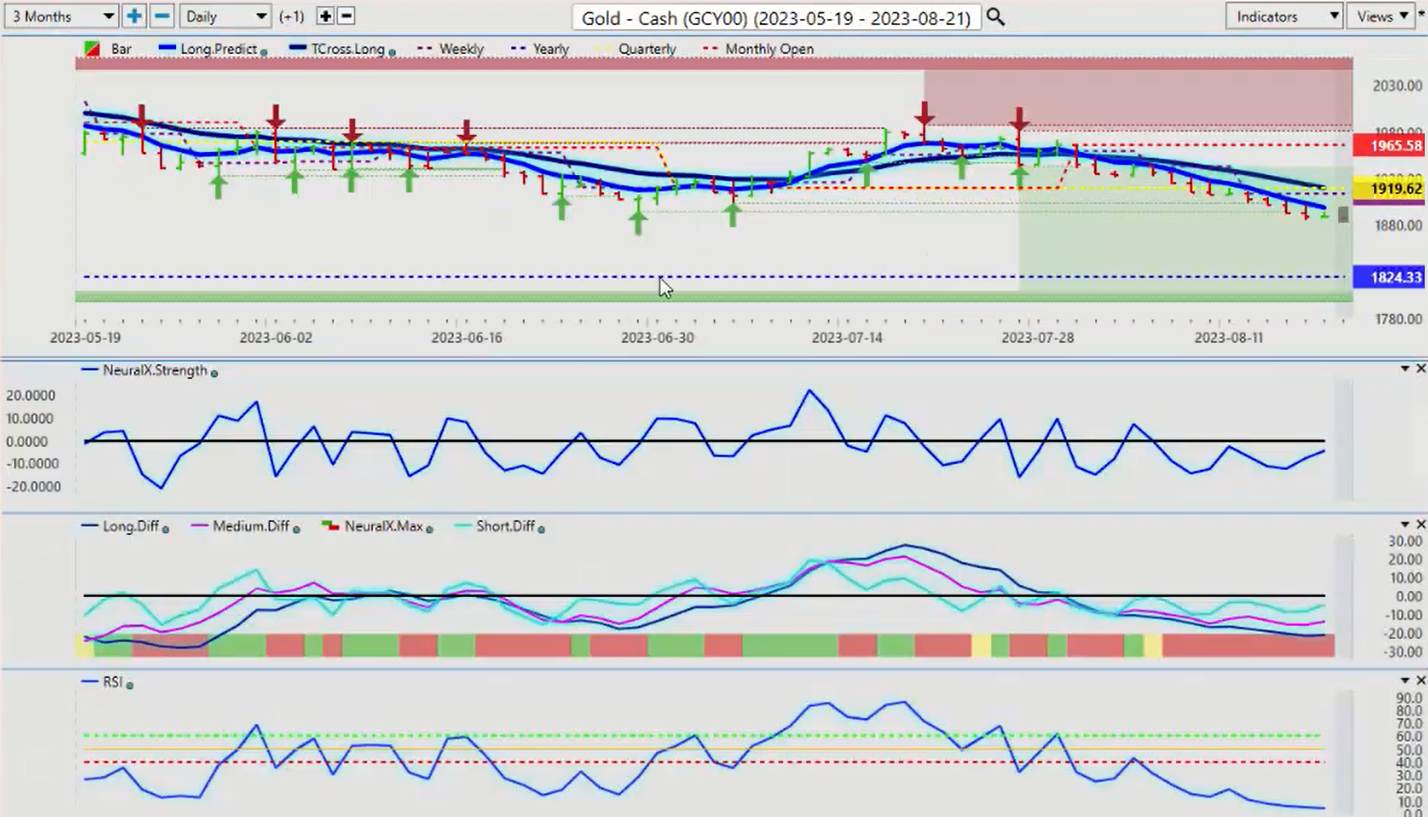
So that would likely put pressure on gold. Now, once again, when we look at the indicators here, guys, again, moving away from the … Yes, you can look at three months, random days, but when you’re looking at a random five days, a random 30 days, a random six months, it really is misleading. When we look at this now, this past week, VantagePoint gave us that sell in gold up here at the current monthly opening price.
I wasn’t overly concerned until we lost the quarterly opening price, that coming in, again, at 1919. So we’re pushing down below there, but I believe gold will hold above 1824, the current yearly opening price, because again, I don’t want to confuse anything in 2023 with anything that happened in 2021, 2022. It was a one-off year, guys, and even during that year, the seasonal patterns still remain strong. So right now, it looks like we’re starting to see a little bit of a turn possibly in gold. Now, gold and the dollar can rally together at the same time, but usually not for very long.
So for now, you can see that each day this past week, we have banged into the VantagePoint long predicted. This is what we’re looking for. That’s a daily potential entry point for shorts, but if we break above that, then again, T-cross long provides that secondary resistance, that coming in at about 1919, but again, make no mistake, gold is still in an uptrend on the year here, guys. It’s positive on the year, so when they tell you that gold is bearish, gold is this, at least you have a proper anchor point to argue and say, “Well, wait a minute, gold’s positive on the year and the dollar’s not, so which one is the better play here?” Again, that seasonal pattern usually supports gold by November.
So we’ll continue to monitor this, but for now, 1919, that quarterly opening price with the T-cross long, intersecting at the same level. If you’re a gold buyer, but you want to wait until this thing turns around, then you would simply tag limit orders above the T-cross long and the current quarterly opening. This is the advantage of using proper anchor points and moving away from this rolling performance model.
S&P 500 Index
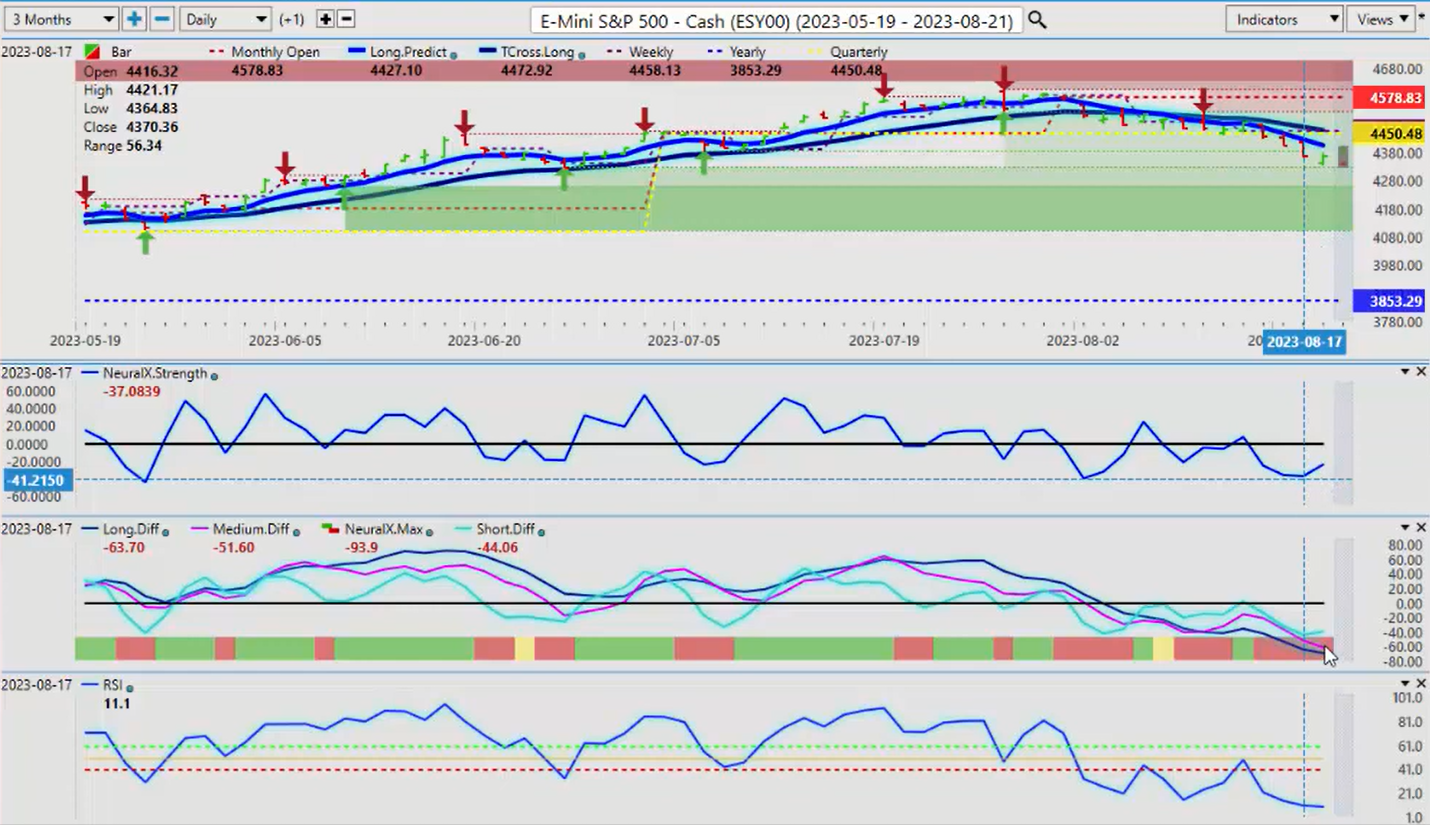
Now, again, I’ve pretty much covered the S&P. It is the SPY trade.
Same trade here, guys. The S&P is falling the same as the SPYs are. Again, we’re going to come into some verified support down here, going back to the 26th of June. That level would come in at about 4328. Again, my bit of a concern that I do have is on Friday, is those massive option expiry, so we could see stocks gently or slowly turn back up next week into the end of the month.
We’ll continue to monitor it, and I will, again, point out that on the Neural Index strength, while the Neural Index is negative, the Neural Index strength is sloping and pointing back up. That is usually a strong warning sign. It’s not an indicator I would disregard. Just because it’s below the zero line doesn’t necessarily mean that that’s the direction, so definitely keep a very close eye on that.
Bitcoin
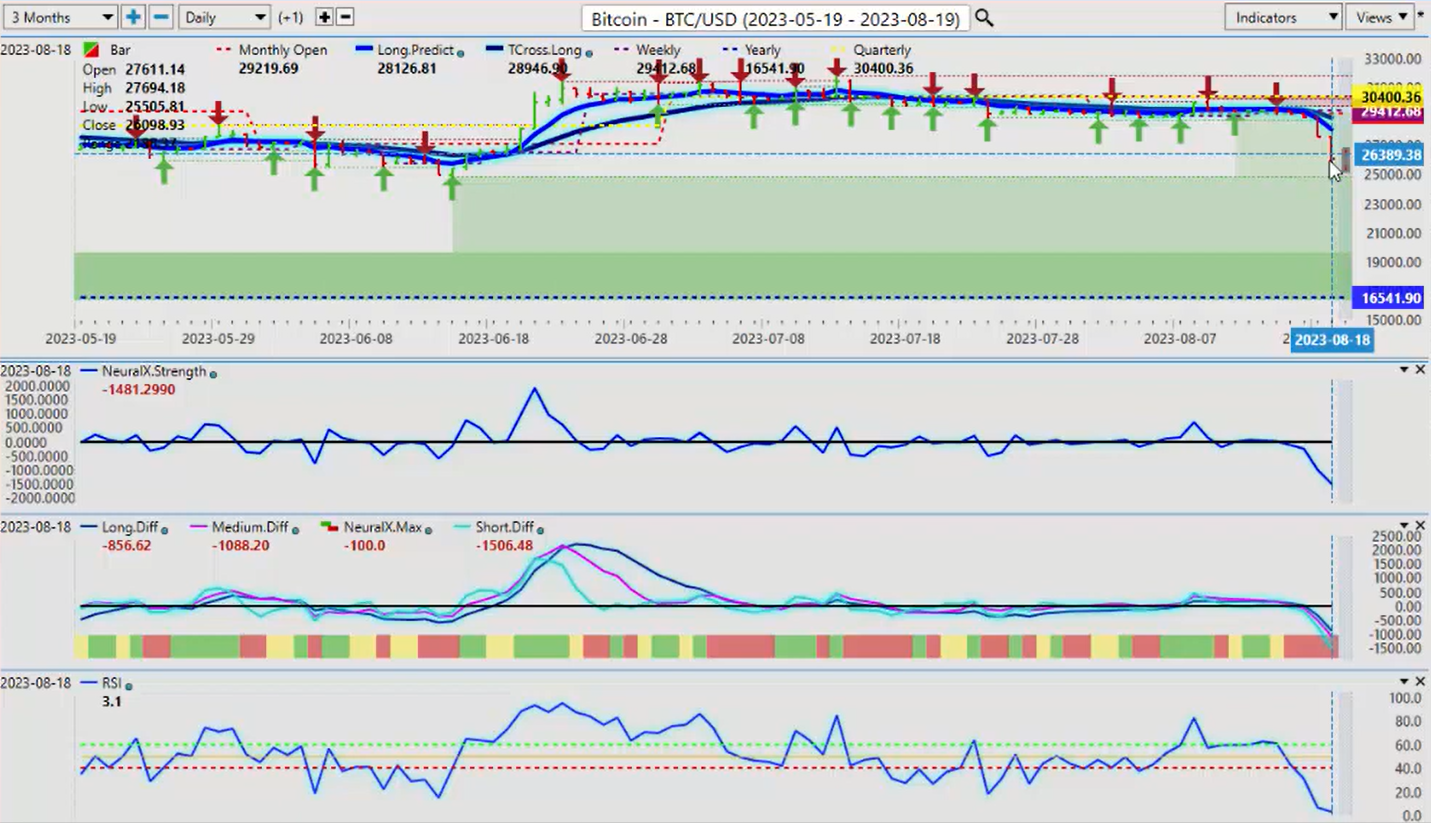
Now, with Bitcoin, Bitcoin is doing what we anticipate it would do, is move lower prior to that known seasonal pattern, which usually starts around mid-September.
So likely a good buying opportunity coming up in Bitcoin in the weeks ahead. Be mindful of this, because again, it is a strong seasonal pattern. I will point out too, that looking at, speaking of patterns, when we look at Bitcoin in the previous years, when it’s been down 50% or more, the next three years have been up 80% or more each one of those calendar years. So again, remember how they told us in March that Bitcoin was going to be at 8,000? Bitcoin had no trouble moving above 30,000.
So again, guys, we need to trade what we see on these charts, and patterns, and seasonals, and maybe disregard 80% of what some of the media is telling us because it is becoming problematic. Bitcoin, on the predicted RSI is at 3.1. So a reversal here, guys, I would argue is imminent.
Light Sweet Crude Oil
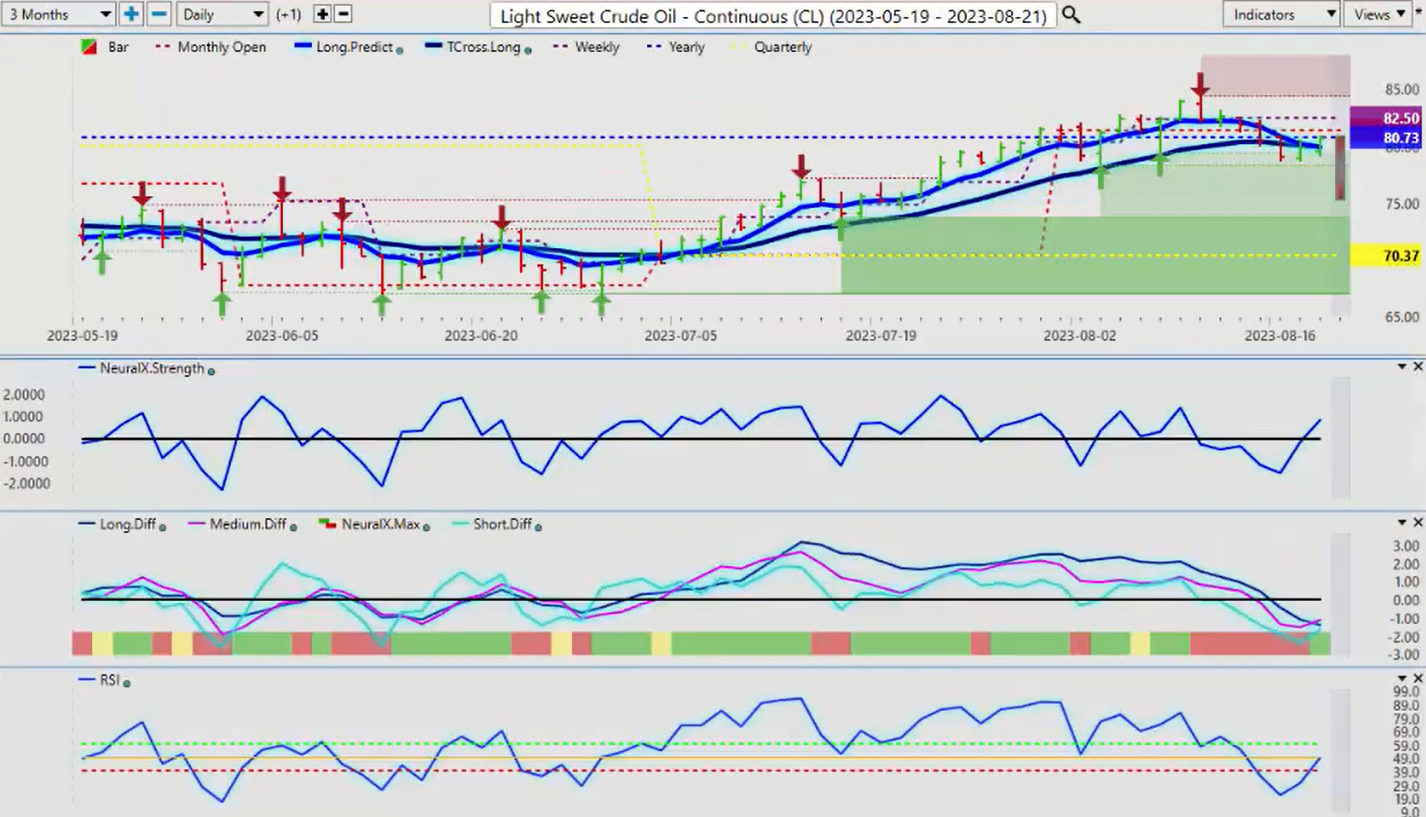
When we look at Light Sweet Crude Oil this past week, taking a real beating on the Fed minutes, a lot of things going on with that, but it’s still managing to hold its own here. We’re above the quarterly opening price at 70.37, but we’re still struggling right around that yearly opening price.
Again, guys, when you’re talking about rolling performance, looking back random three months, six months, nine months, a year, it really is misleading because you don’t have these anchor points to tell you, “Okay, is it positive or negative on the year currently?” Well, the yearly here is 80.73. We’ve closed at 80.66, so it still carries a slight bearish tone to it, but if you bought oil or sold oil on January the 1st of this year, you’re basically flat, right? So this is where we see the advantage with the software, is it tells us to get into these short-term buys and sells, that could last for anywhere from a week to three months, but again, looking at the first quarter in oil … Again, I will stress this to you, guys, with a demonstration of the power of those proper anchor points, right off the beginning of this quarter in June, you could see that oil just sat there on that quarterly opening price and advanced From there.
Once VantagePoint confirmed that the quarterly opening price was going to hold, this opened the door to a very big move, right? So the natural retracement point without Fibonacci, Wave’s, any of this stuff, guys, we look at these points and say, “Okay, resistance is building here,” but I believe the oil, the correlation to the equity market, that oil has taken a hit with the SPYs and the S&P 500, and that could very well reverse next week. That’s entirely possible now that those options expire has been dealt with, right? So again, we’ll watch the T-cross long at 79.94, and of course, the yearly opening price at 80.73. Now, when we look at some of our main Forex pairs, the Euro, again, a very, very good opportunity for shorts this past week.
Euro versus U.S. Dollar
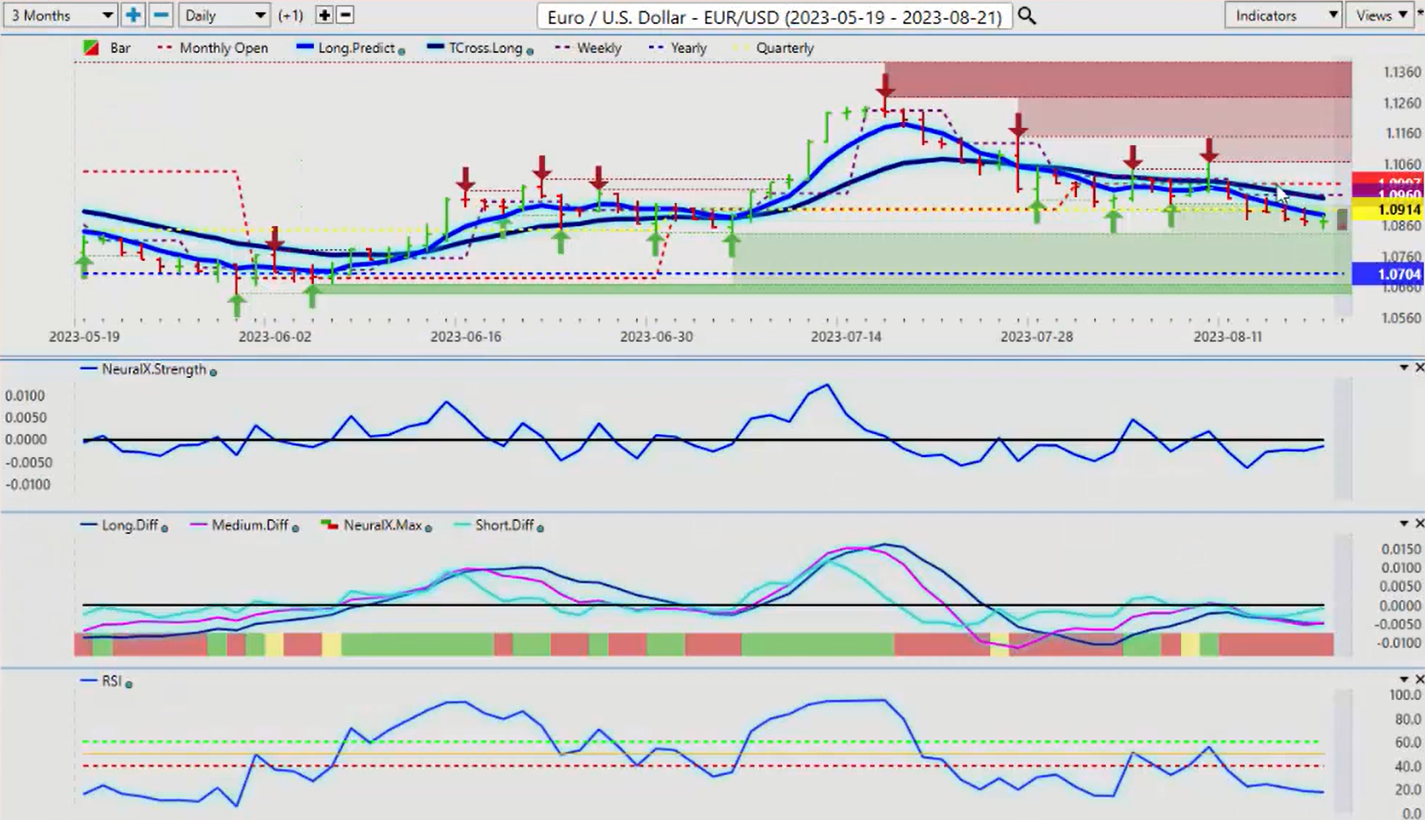
Again, right off the … When we go back five days, you can see that the Euro, using that weekly opening price and the VantagePoint indicators, one could sell right off the very open on Sunday night and close on Friday, but I believe it’s also a very strong way of doing things, is selling into that long predicted and the T-cross long. Whichever strategy you choose, the main thing is use the proper anchor points. The Euro is negative on the month. It’s negative on the week.
This is a predictable move in these currencies, but we are still, I will point out, guys, we’re still positive on the Euro at 1.0704, the yearly opening price. So if we’re going to see buyers coming in, it very well could be soon. The indicators, once again, that Neural Index strength, starting to point up, but again, this is, in my respectful opinion only, the Euro very seldomly does well between mid-September and mid-October, and I will put the dollar cycle on that, I will put the U.S. fiscal year-end on October 1 on that. There’s a lot of reasons why that’s happening, and that creates a seasonality. Seasonalities are very strong in our trading, so be careful of a corrective move, but I think any correction hire will be contained by the VantagePoint T-cross long at 1.0948, and the accurate monthly opening price of 1.0997.
The last thing we want to be doing here, guys, is measuring from the 19th to the 19th and going back 30 random days. It tells us nothing and it’s extremely lagging. So again, it’s up to the individual trader. If you can make that work, that’s great, but I would definitely make sure you know exactly where you are, because rolling performance is very similar to, I would say, a simple moving average versus a predicted or exponential moving average. That’s the way I would look at this, guys.
U.S. Dollar versus Swiss Franc
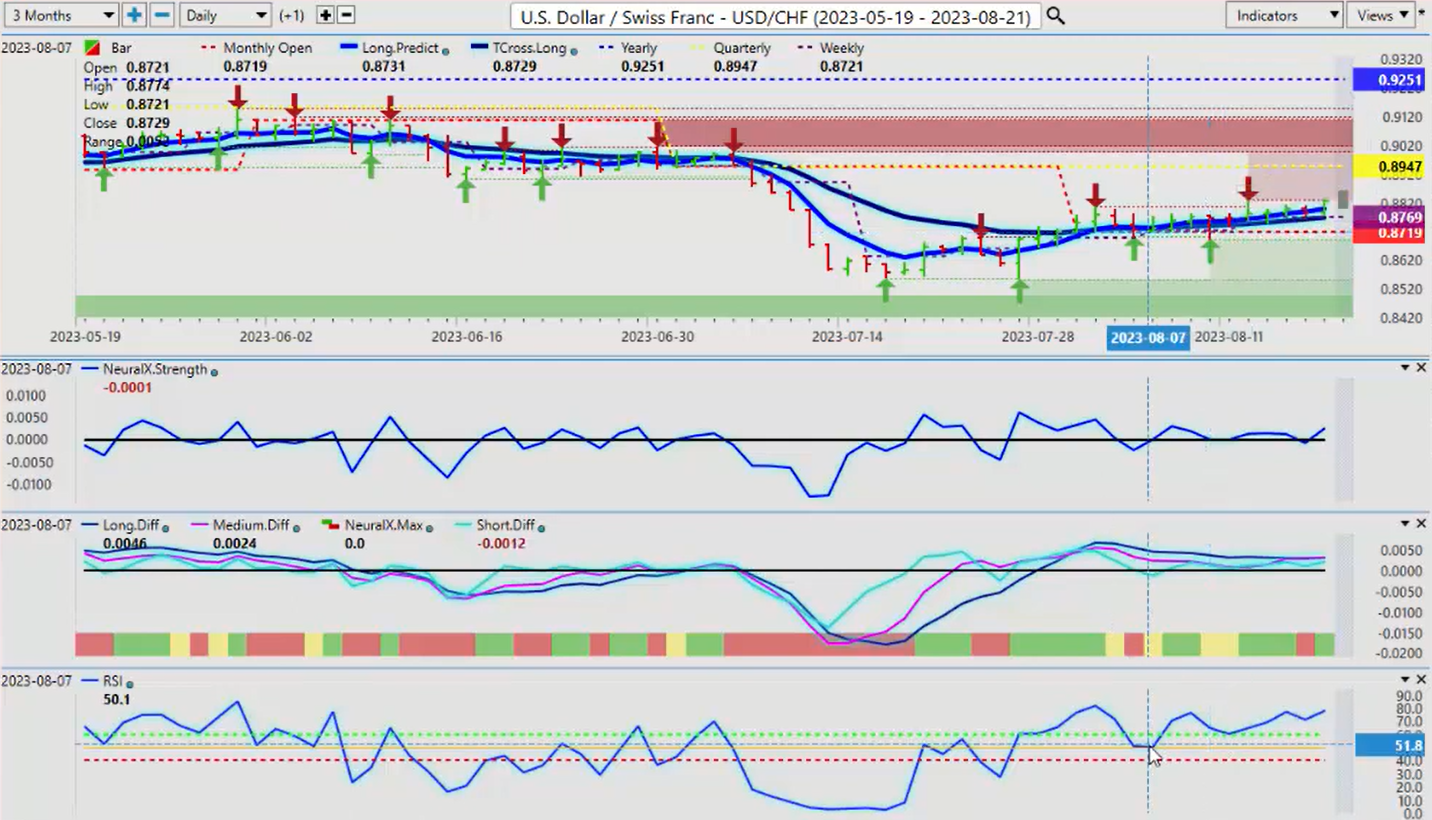
Now, with the U.S./Swiss Franc, again, a long trade is building here. As you can see, the accurate monthly opening price every single day, touching that monthly opening price, if you traded off the monthly opening price in the month of August and use the core VantagePoint indicators, looking at the predicted RSI, unable to break down below the 50 or the 40 level, and it’s starting to rise. It’s showing us momentum is moving higher. The Neural Index strength, you can see, was red here, but the slope is starting to turn back up. So what we would like to see is, first of all, we want to stay above the accurate monthly opening price at 0.8719.
We want to hold above the T-cross long at 0.8768, and again, we want to stay positive on the month so we can challenge the quarterly opening price at 0.8947. Now, the dollar has lost a lot of ground to the Swiss Franc over the last few years, but I believe that by mid-September or sooner, maybe as early as next week or the week after, we will at least come up and test 0.8947, then we would look to target the next level of 0.9251, the accurate yearly opening price.
British Pound versus U.S. Dollar
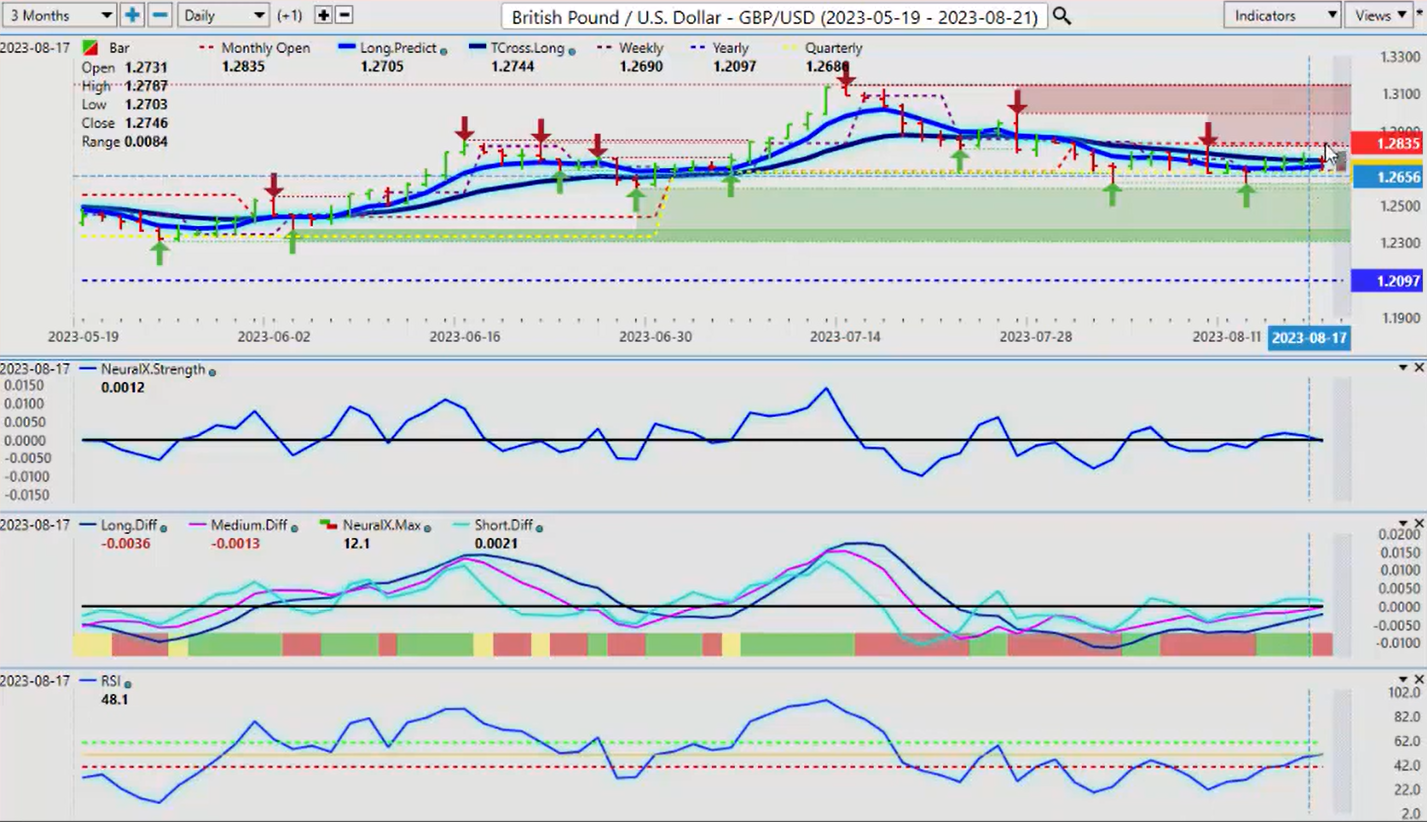
Now, again, with the Pound/Dollar struggling here, but it’s holding along the VantagePoint T-cross long this entire week, but we remain negative on the month. Now, the quarterly opening price here, again, is 1.2686. So you can see that very stubbornly, we’re staying right on that quarterly opening price the entire week.
So again, when we talk about leading versus lagging, a current quarterly opening, a current weekly opening, a current monthly opening price, these are leading. Rolling performance, going back, random 30, 60, 90 days is lagging. I get a lot of questions on this. That’s the easiest way for me to explain it. We want to use leading indicators, not lagging, right?
So right now, the Pound, if you believe that the dollar will continue to strengthen here, then our T … Right now, we don’t have any buyers at the T-cross long, which is coming in at approximately 1.2744. We would have to break above that, but then, you have the monthly at 1.2835, which would be a premium entry for a short trade as we await the pending dollar strength in mid-September to mid-October, maybe early November at best. But again, if we lose that quarterly opening price, the current quarterly, at 1.2684, then you could have a significant breakdown on the British pound. One could argue, you could set up limit orders below an accurate quarterly opening price at, say 1.2650.
You could set up a sell limit order, because again, this is an outlook, not a recap of something that’s already happened.
U.S. Dollar versus Japanese Yen
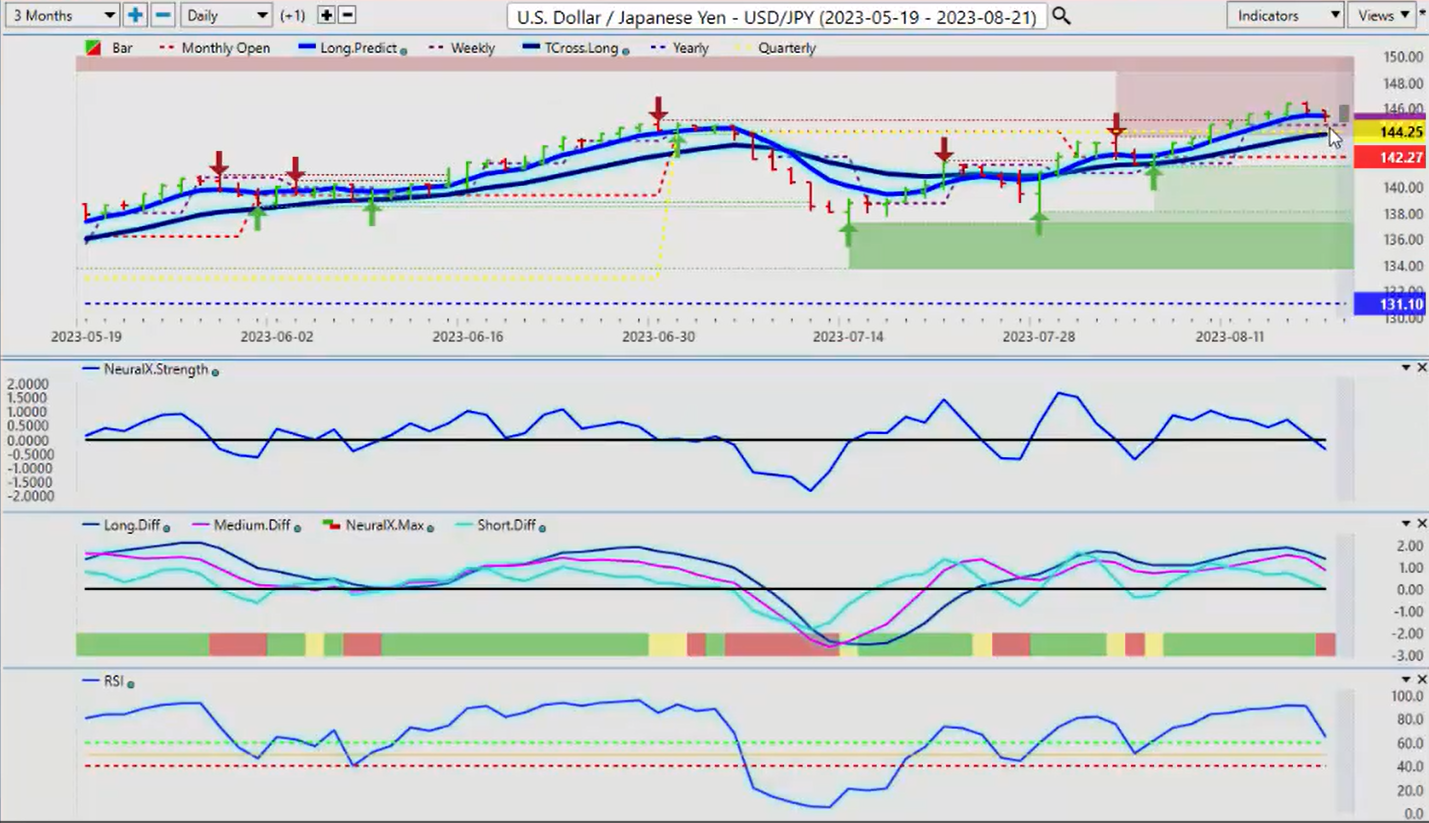
Now, when we come down here and we look at the Dollar/Yen, the carry trade really puts the dollar in control of this, but if this carry trade comes unwound, a global risk-off event with Russia, with China, there’s multiple risk-off events that could happen. The Yen would strengthen very quickly. So I always caution with my own direct client base to be very cautious with this pair, and any of the Japan cross pairs, because that’s the biggest fear here, but right now, we remain firmly above the yearly opening price, the monthly at 142.27, but we’ve crossed over that quarterly opening price, and now, the current quarterly opening price is intersecting with that VantagePoint T-cross long at 144.02. That’s the area you want to watch, guys.
If you believe that this pair can go higher, that’s where you would be buying. If you believe it’s going to go lower, then you set up your sell limit orders below the quarterly opening and the T-cross long. The indicators right now are T-cross long is pointing down, predicted differences are pointing down, Neural Index is red. So I would respectfully submit that this is likely just a corrective move, because if the equity markets turned back higher and it was the options expiry causing that volatility on Friday, then this is just a retracement lower, the S&P, the SPYs go higher, the Dollar/Yen follows that.
U.S. Dollar versus Canadian Dollar
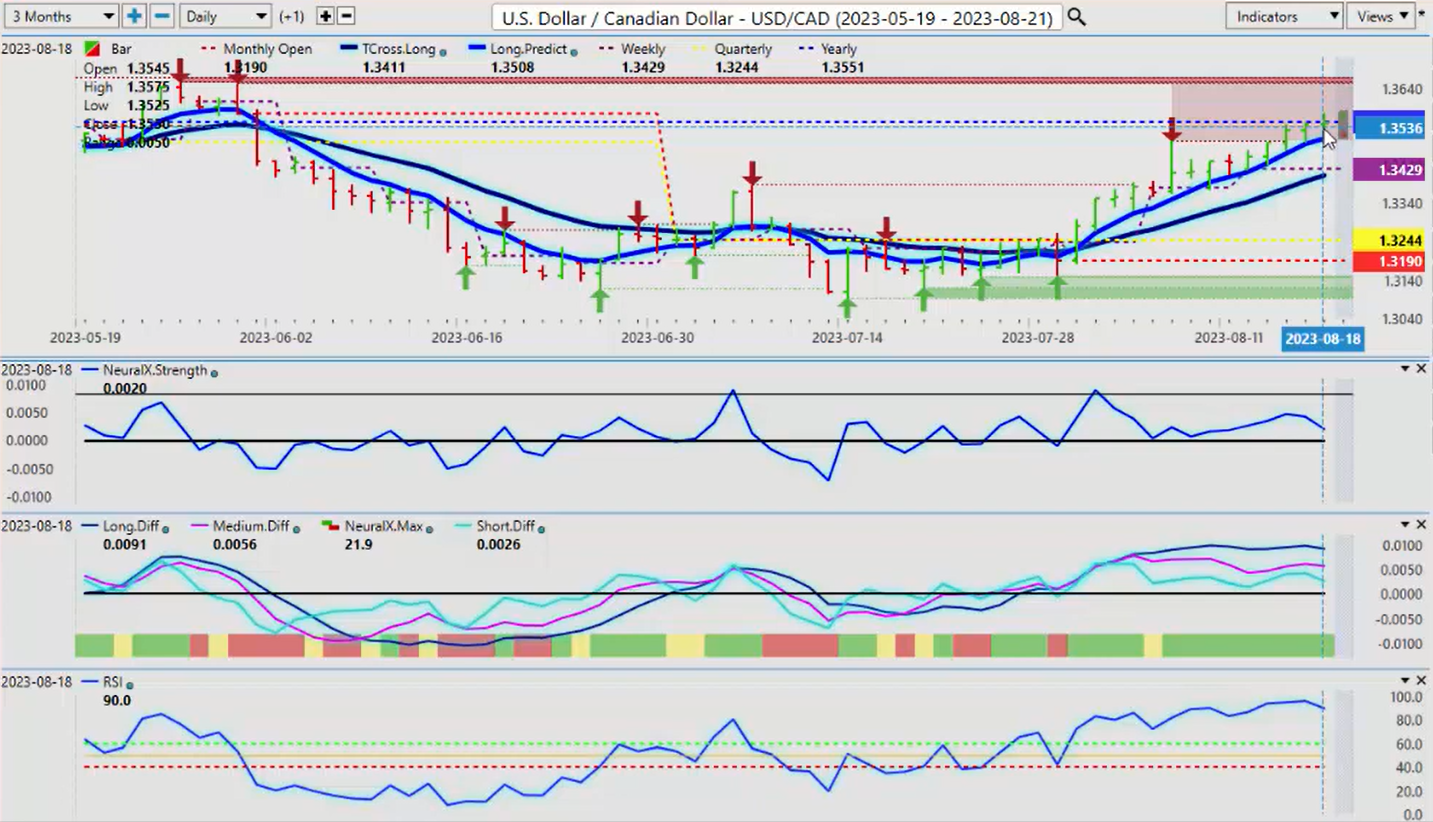
Now, the U.S./Canadian pair this past week, again, slightly hotter inflation data, but once again, we see the value of using proper anchor points.
U.S./Canada has stalled three days in a row. There’s been multiple reports out of Canada, Bank of Nova Scotia, RBC, and they just haven’t been able to figure out this currency, and what it is, is it’s driving higher based on the dollar strength, and the equity markets and oil struggling, but again, we’re hitting the yearly opening price at 1.3551. We would have to clear this to keep buying. So if there is a bull trap forming, this is where it’s going to be, guys, so be careful up here. The indicators, if the Neural Index strength starts to turn down, which it is, but the main thing I can advise is that we have the proper anchor point.
This is, for most, guys, it’s invisible resistance that they will never see at 1.3551. So again, there is resistance there and it is significant. So again, even if we get a corrective move in the dollar, we should get a corrective move in the CAD, sending this down … I would like to see it break below the long predicted at 1.3508, and then I would target the T-cross long at 1.3411.
Australian Dollar versus U.S. Dollar
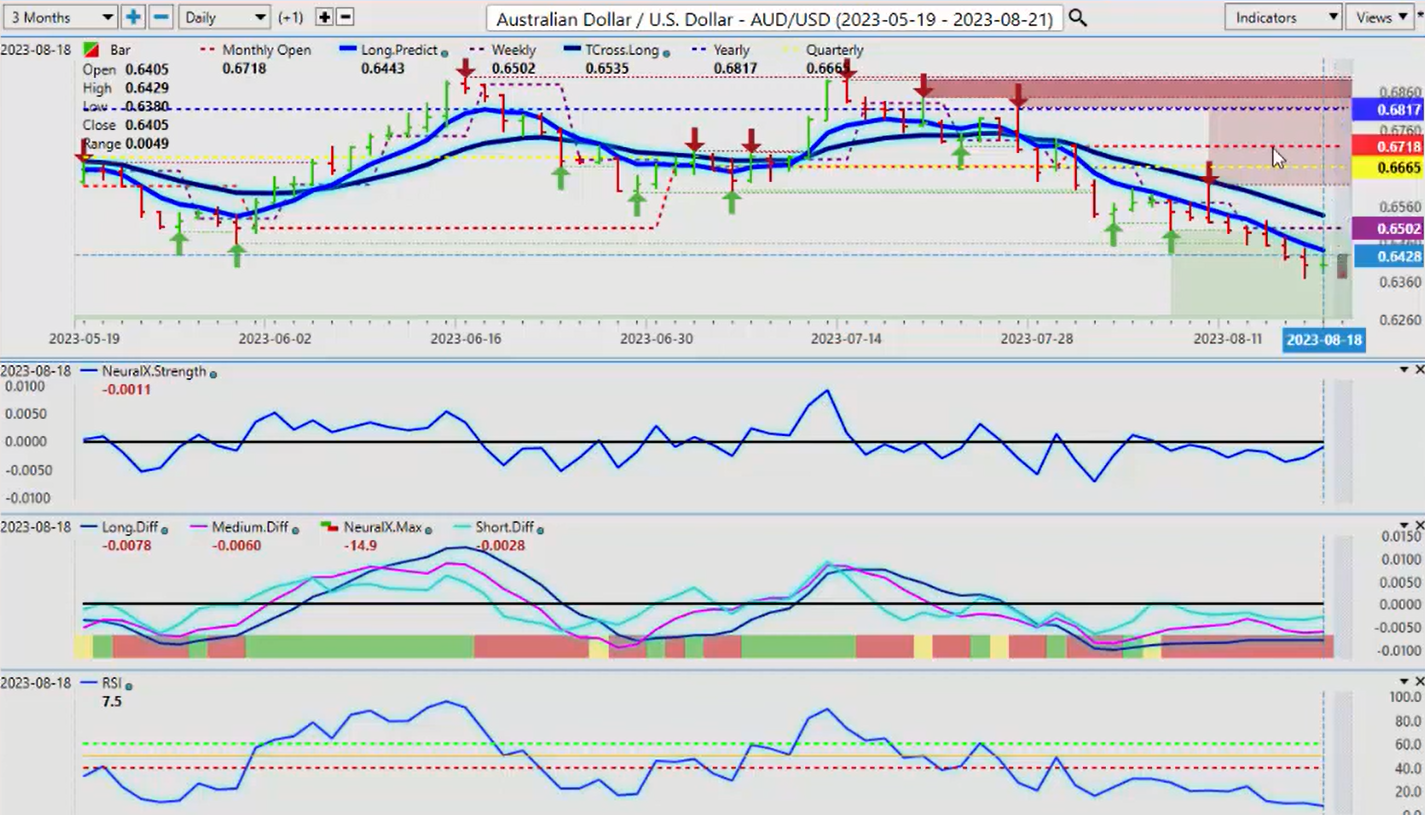
Now, the Aussie and the Kiwi, again, much like the Canadian dollar, if the stocks are in trouble, the CAD’s in trouble, the Aussie, the Kiwi, they’re all in trouble, and that can bleed off into Aussie/New Zealand also, right?
But once again, I think we’re getting a little bit overdone here, but statistically speaking, the yearly opening price, 0.6817. We start the month right here, the accurate monthly opening. When you see somebody saying, “Okay, this is on a monthly,” well, no. Where did you start that? Did you start that at the beginning of the month, the middle of the month, the end of the month?
New Zealand Dollar versus U.S. Dollar
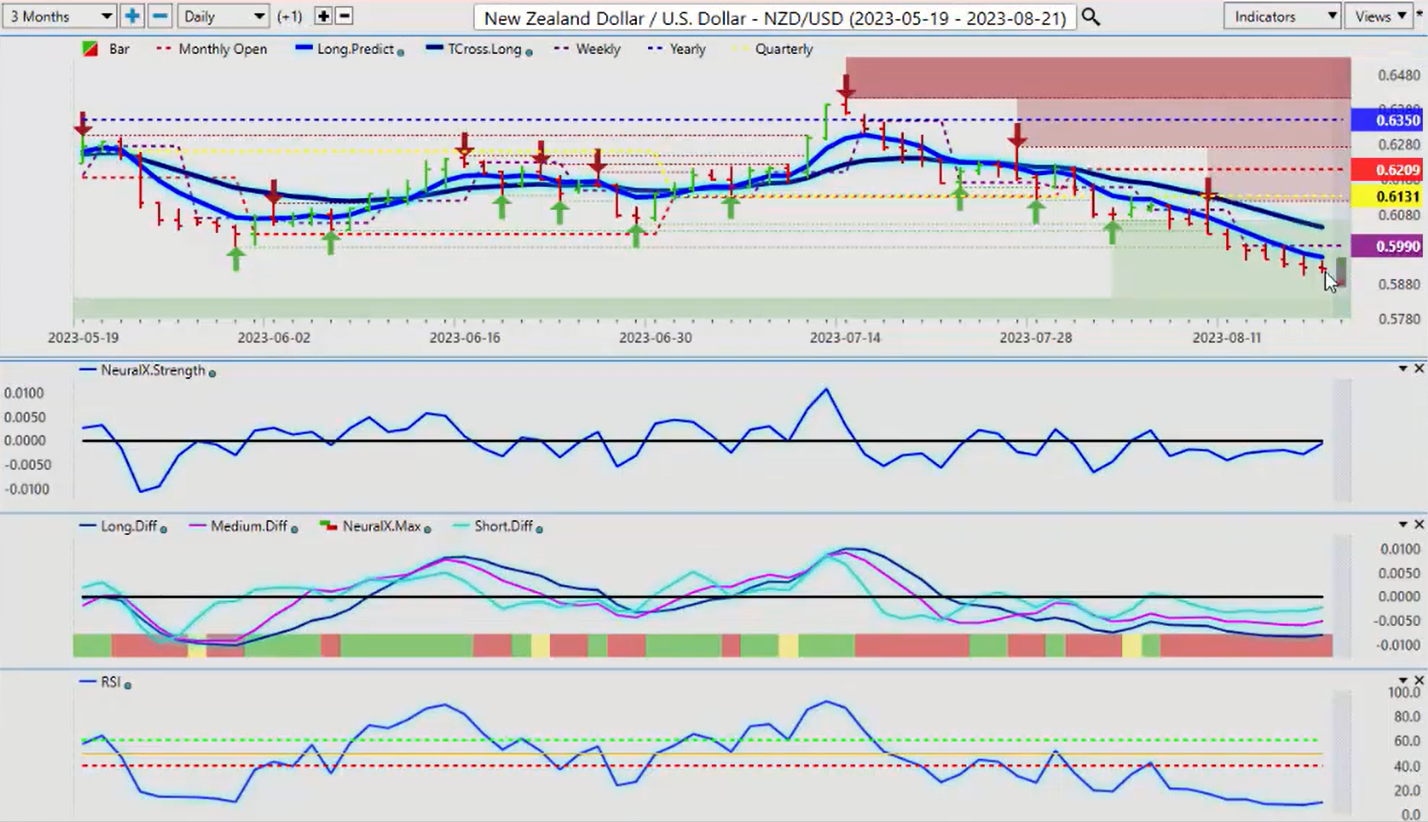
These are random points, guys. When you anchor this to the monthly, you can see that once we moved down, we also crossed over the proper quarterly opening. We came back up and retested it on the 10th and went down again. So right now, if you’re going to be a buyer of this, we must clear the first VantagePoint hurdle, which is the long predicted, 0.6443. We then target 0.6502, but I don’t think you’re going to see a lot of strength in the Aussie unless we have a big move down in the dollar and we’re already preparing for a higher dollar next month in September.
So be careful with this one. The Aussie, very little difference between these two, but again, we must clear these hurdles. I believe we will get some sort of corrective move before Labor Day, and maybe even slightly after Labor Day, but after that, we then start to lock in on arguably some of the best trading in the year between mid-September and mid-December. So with that said, this is the VantagePoint AI Market Outlook for the week of August, the 21st, 2023.