-
View Larger Image
Welcome to the Artificial Intelligence Outlook for Forex trading.
VIDEO TRANSCRIPT
Hello, everyone and welcome back. My name is Greg Firman, and this is the VantagePoint AI Market Outlook for the week of August the 7th, 2023.
SPDR SPY ETF ($SPY)
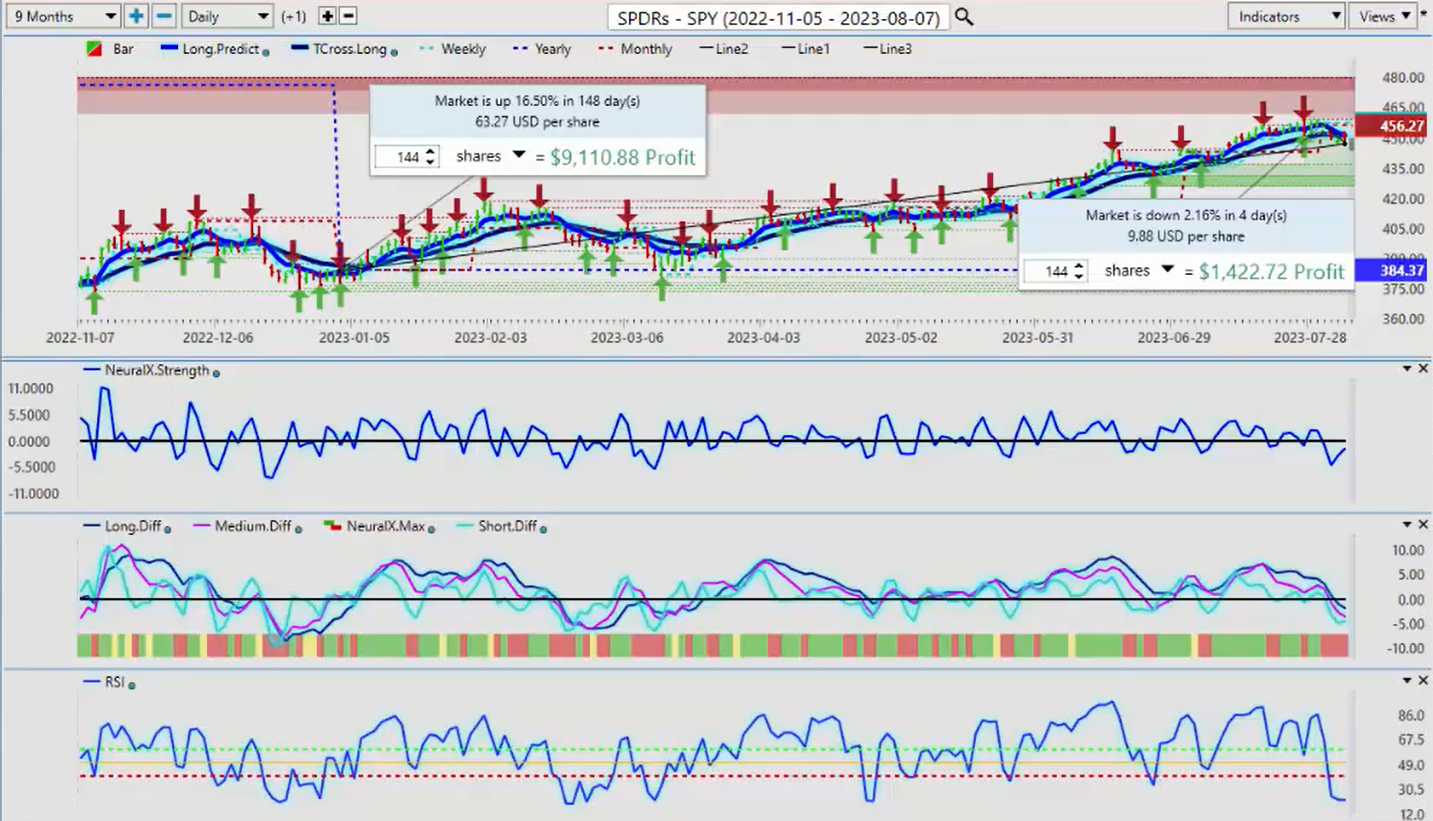
Now, to get started this week we’ll do a quick review of where we’re at with the broader markets here using the SPYs. Of course, what we want to do here, guys, is make sure we’re not using lagging performance models here, rolling performance. Year to date, we’re up about 16.5% on the SPYs. But as we can see or assess here, we’re actually down 2.16% on the week.
Equity is struggling. Now, that is specifically, in my respectful opinion, due to the inverse intermarket correlation to the dollar index. When we look at the SPYs right now, there are signs of some recovery. But again, we’re still in a firm uptrend in the equity markets. But in most cases, the equity markets don’t fare very well in the month of September. We’ll see if this year is different, but August is a very, very slow month.
But it’s that much more important to make sure that we have strong anchor points in our trading so we know exactly where we are in the week, the month, and the year by using those yearly, monthly, and weekly opening prices with the point in time indicator from VantagePoint. Right now the equities are under pressure. But in most cases, guys, the week after the nonfarm payroll number, the dollar sells off usually by the Wednesday. Now, there is a holiday in Canada on Monday, but a civic holiday.
But either way, we’re likely to see some equity strength going into midweek if these monthly patterns follow the same. When we take that into consideration, we want to look very closely at the dollar index. Because if the dollar moves lower, basically everything else moves higher, gold, equities, crypto, some of these different markets, a number of different currencies trading against the dollar. We can see that the dollar is holding above its monthly opening price, but it’s still in a downtrend here, guys.
We’re not positive on the year. We’ve barely been positive at any point during the calendar year using the correct anchor point of the yearly opening price from the beginning of the year of 2023. The last thing we want to do is drag numbers from 2022 into the current year because they’re not relevant. We were in an unprecedented year of rate hikes. Right now, the dollar, the T cross long, that’s coming in around 101.76. I do anticipate the dollar will follow the normal patterns and start moving lower probably by Wednesday next week.
The indicators in VantagePoint, our neural index strength is firmly pointing down, predicted RSI is pointing down. Our MA diff cross is warning us that we’ve got problems here. The short-term crossover has already moved lower. Again, if we lose that T cross long, then the dollar is likely to extend lower for the better part of the month. But either way, the dollar is likely to strengthen in October. These are good buying months for the dollar, but November and December are not. We’ll watch this VantagePoint T cross long for next week very, very closely.
S&P 500 Index
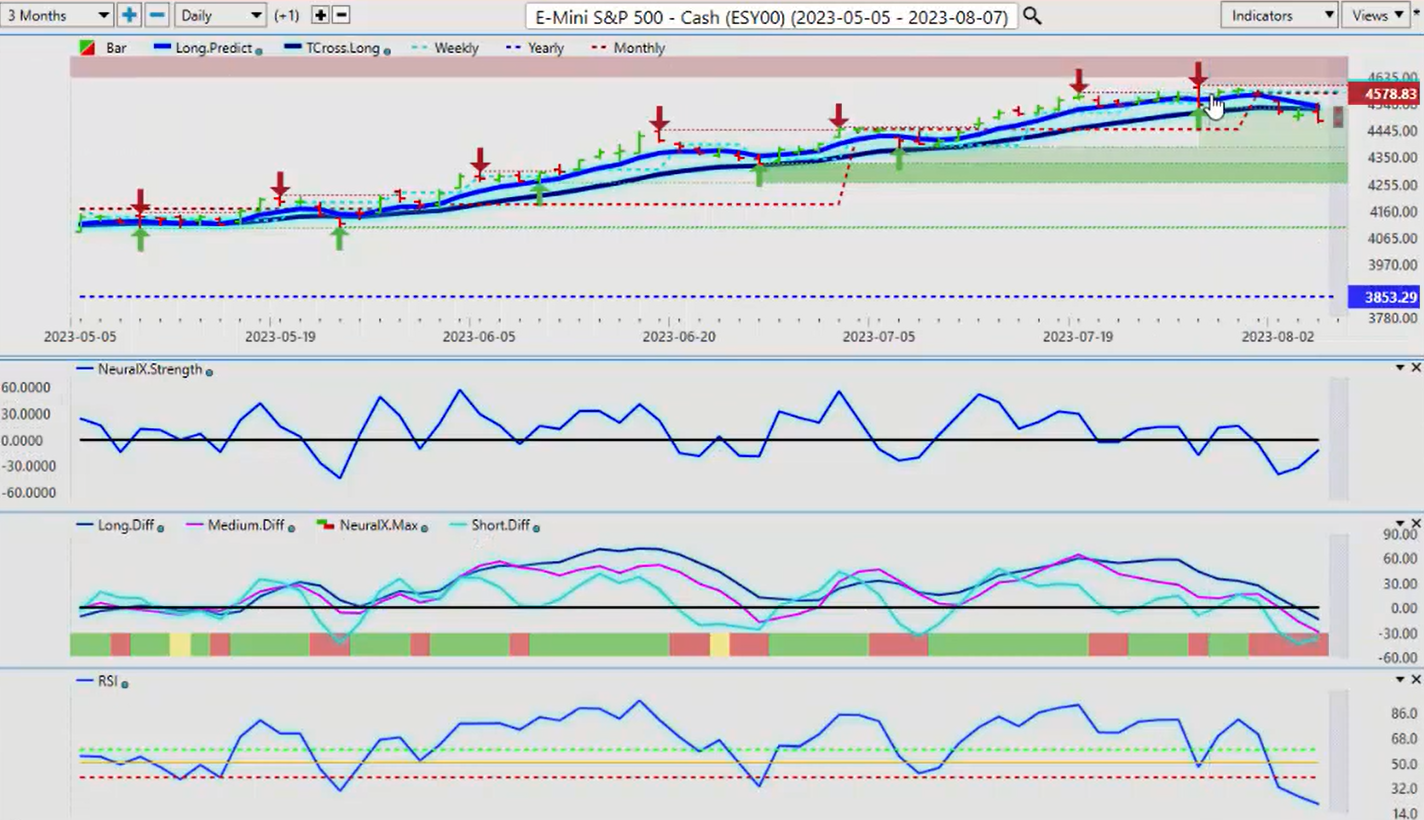
Of course, the proper anchor point, the monthly opening price from the beginning of August, that’s coming in at 101.89. We’re closing the week at 102, very close to these levels. If we breach that level, then the dollar is likely to move lower for the better part of next week. Now, when we look at the equity markets, the S&P 500, again, the exact same trade as the SPYs, one’s an ETF, one’s a futures contract, but essentially the same trade. Under a little bit of pressure here, but be careful of a reversal next week based on what I’ve just stated.
The neural index strength, while the neural index is red and down, the predicted differences are down, the neural index strength is pointing higher in what I’ve coined as a reverse check mark. When I see these reverse check marks, it usually points to a reversal, guys. Be cautious of this. Our T cross long here, 4527. If we get back up above that level, then we’re likely to see some strength. But again, either way, the month of September is not likely going to be great for the equity markets, but that’s a month away.
For now, the indicators are still bearish, but watch for that reversal after. Again, the payroll number of the US was not a good number, in my respectful opinion, at all. Again, the pressure’s going to be on the Fed. Is he hiking, not hiking? I would be in the camp of he should have never have hiked to where he’s at right now. And if anything, first quarter of 2024, I could easily see them having to cut rates based on the damage they’ve done to date. Now, when we look at light sweet crude oil, oil, again, getting a bit of a bounce here.
Crude Oil

Let’s just go up to our oil contracts. Now with oil, we’re trying to push positive on the year, guys. In the normal scheme of things, from the seasonal standpoint, oil is at the end of the rally, not the beginning. I would be cautious with your oil-based stocks. Be very cautious here. In my respectful opinion only, I think it’s very unlikely that we hold above the yearly opening price for very long, maybe a week or so, maybe a week and a half. But either way, in September-October, we start moving lower.
For now, there’s a slight biased higher, but we must stay above 81.73 and 80.73, the yearly opening price. But I would say it’s imminent that we’re going to retest that T cross long at 78.68. Now, when we look at Bitcoin going in for next week, again, guys, I wouldn’t expect a lot out of the month of August. I never do. It’s very much a sideways month.
Bitcoin
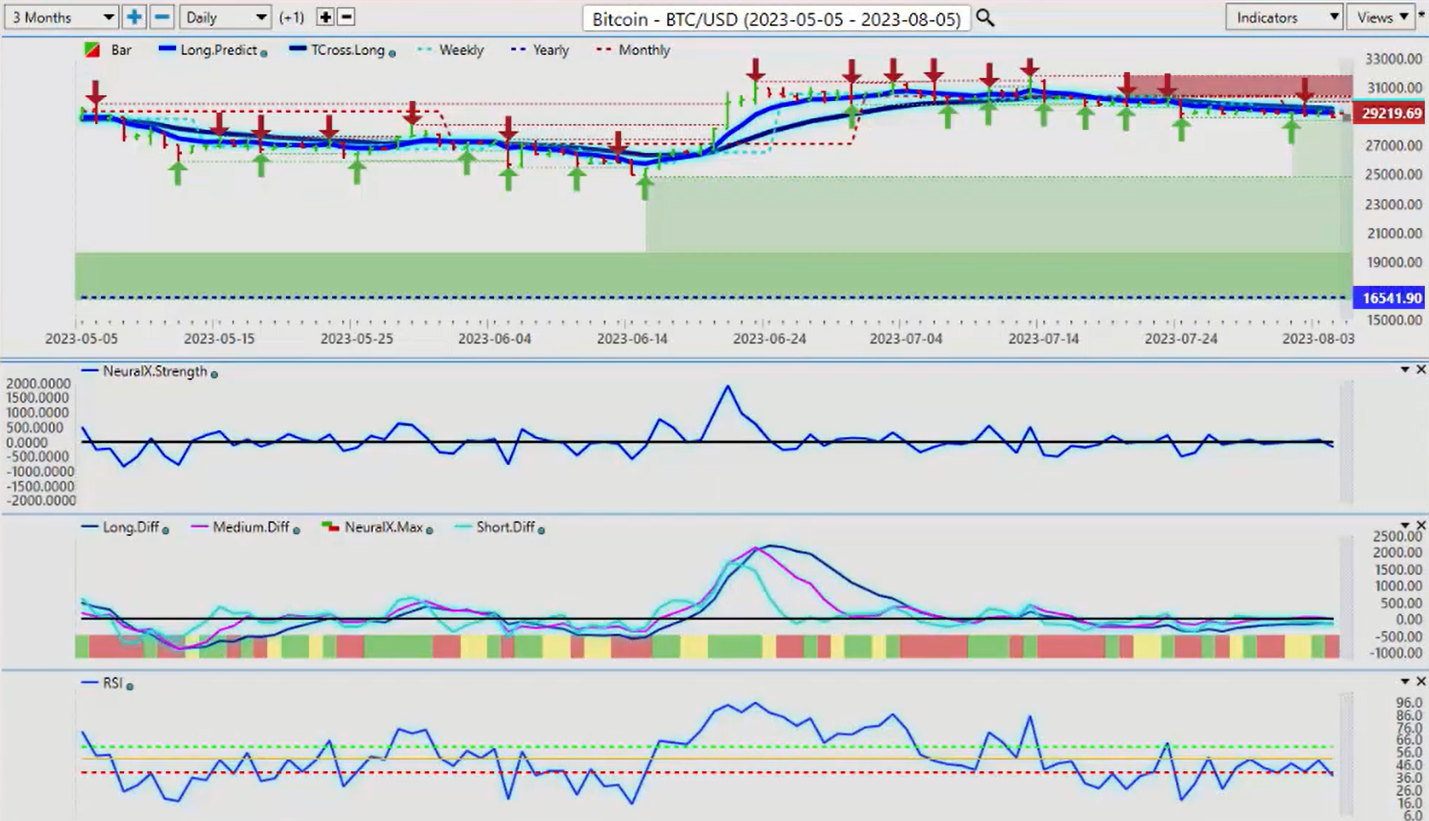
Bitcoin, again, just moving sideways here with a slight downward bias, but be prepared to buy this in mid-September. That’s usually when that seasonality kicks in until the beginning of November approximately.
Seasonalities are not an exact science, but they are a science just the same. For now, we’re moving sideways along the verified support low. That low coming in about 28,885. I anticipate this is likely to hold near this level for the remainder of August without any real violent moves. Again, most of the indicators here have been flat for the last several weeks, so I wouldn’t expect too much out of Bitcoin in August, but I would be prepared to buy in September.
Euro versus U.S. Dollar
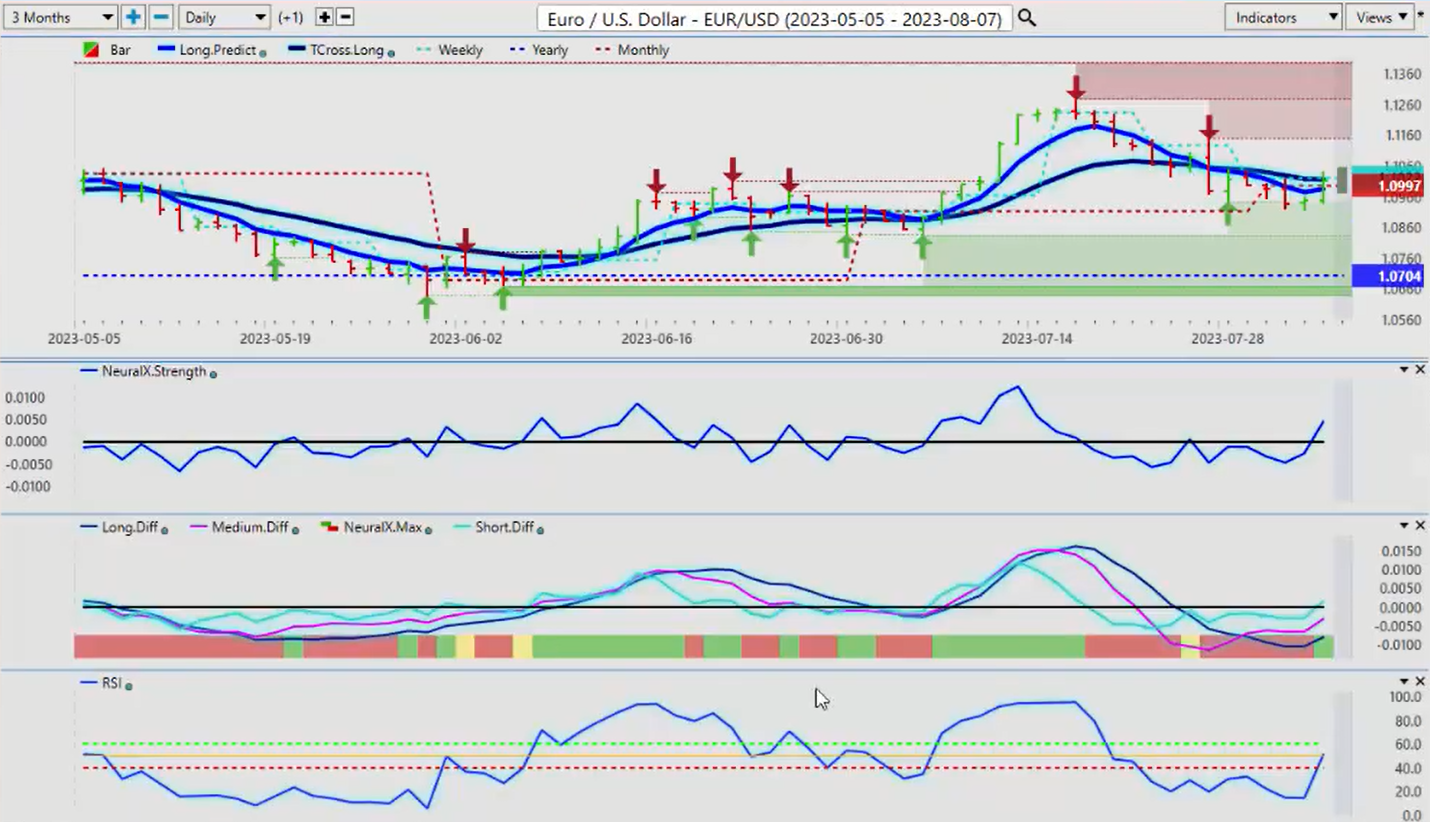
Now, as we look at some of our main Forex pairs going into next week, again, starting with that very important Euro-US.
Now, the Euro recovering somewhat based on that weaker payroll number. But regardless of what that payroll number was, guys, the normal pattern is the Euro would go higher the week after the nonfarm payroll number anyway. When we look at this right now, we’ve closed the week challenging that T cross long at 1.1016. The scenario I could see, Monday, Tuesday we push lower on this, and then on Wednesday, Thursday we reverse higher back up and the Euro continues its uptrend.
That’s extremely possible. But again, guys, in the month of August, don’t expect a lot. Use your core indicators, the T cross long, the correct monthly, weekly, and yearly opening prices. These pivot levels will tell us who’s in control, the bulls or the bears. If we’re above the yearly opening price, the bulls are firmly in control here in the Euro, but they’re being challenged because there’s a lot going on. This past week, the US has received, it kind of came out of nowhere, the credit downgrade.
Again, that could weigh in the dollar or it could help it on a flight to safety. We’ll see. But for now, this is pointing for an upward move in the Euro. We’ve got our MA diff cross. We’ve got our neural index strength is moving higher and a rising predicted RSI, but we must clear the T cross long at 1.1016. Another way you can play this guys, because again, this is an outlook, not a recap of something that’s already happened. If we’re looking at this, buy limit orders above the T cross long on Tuesday or Wednesday of next week is a very viable strategy.
U.S. Dollar versus Swiss Franc
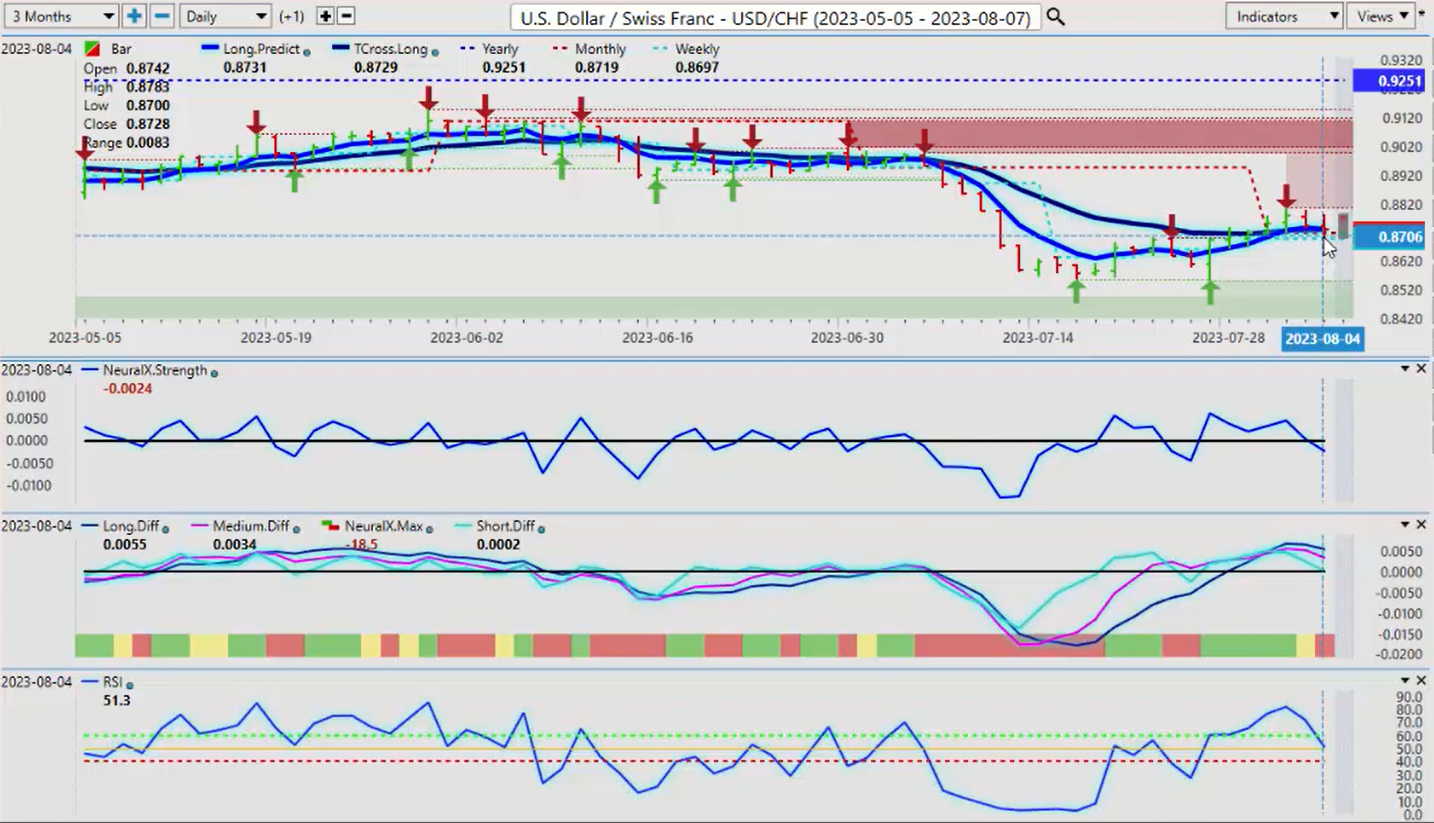
Now, when we look at the US-Swiss Franc pair, once again, this pair is likely to start turning lower because most of your dollar buying has started to dry up. That’s the pattern that I’ve seen over many, many years of doing this. They are required. They must buy dollars at the beginning of the month. But once they’re done, they basically throw it back to the market and the market prefers, in most cases, to sell dollars, not buy them. If we break down below our T cross long at .8729, then we’re likely moving back into the bottom of the range here around .8065.
The indicators support that move currently. Our MA diff cross has the medium term crossing the long-term predicted difference. Our neural index strength breaking the zero line on Thursday. It continued to move lower on Friday. Again, a falling RSI tells me we’re losing momentum. I don’t use the RSI or any other indicator for overbought, oversold. I’m looking for momentum. Do we have upward momentum in this? The answer is no, we don’t. We would have to clear that verified resistance high at .8806 to take the pressure off the downside for next week.
British Pound versus U.S. Dollar
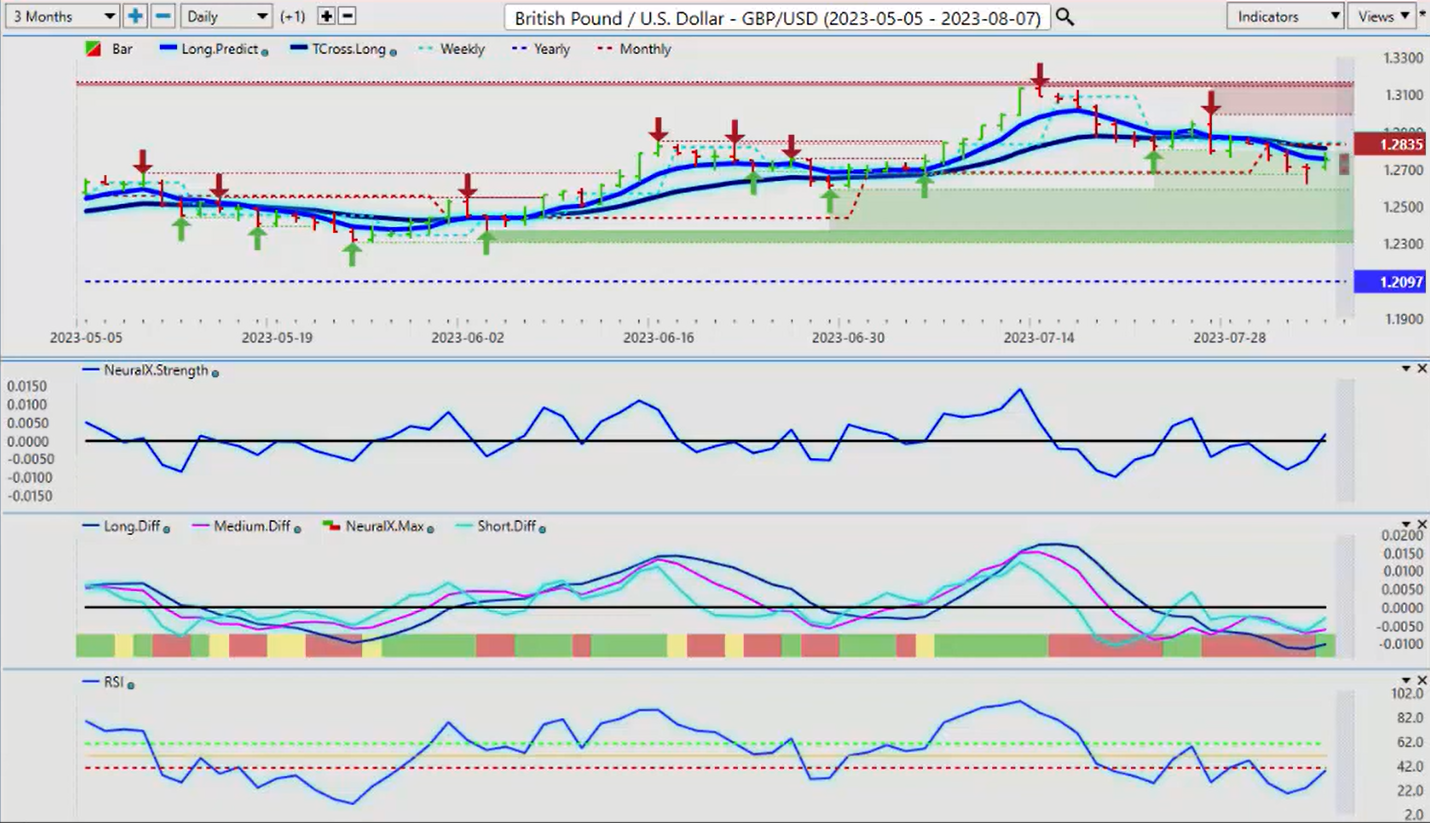
Now, with the British pound-US dollar, the seasonal pattern in the British pound is it doesn’t fair well in August and mainly September and part of October. It then regains buying opportunities later in October, and then November, December are good buying months for this pair. I would anticipate a little bit of a retracement this week, but we’ve got to get above that monthly opening price 1.2835 and stay above that. We have our T cross long, that key VantagePoint pivot level between bullish and bearish, 1.2813.
If we get above these two levels, then that dollar weakness will show up here. But I anticipate that could be short-lived with this particular pair. But longs are supported currently by the indicators, the neural index, the neural index strength, and again, a rising RSI. Now, when we look at the dollar-yen again, can the dollar maintain its gains against the yen? And from the carry trade perspective, the answer would be yes. But if the carry trade starts coming unwound, then this pair could drop rather quickly.
U.S. Dollar versus Japanese Yen
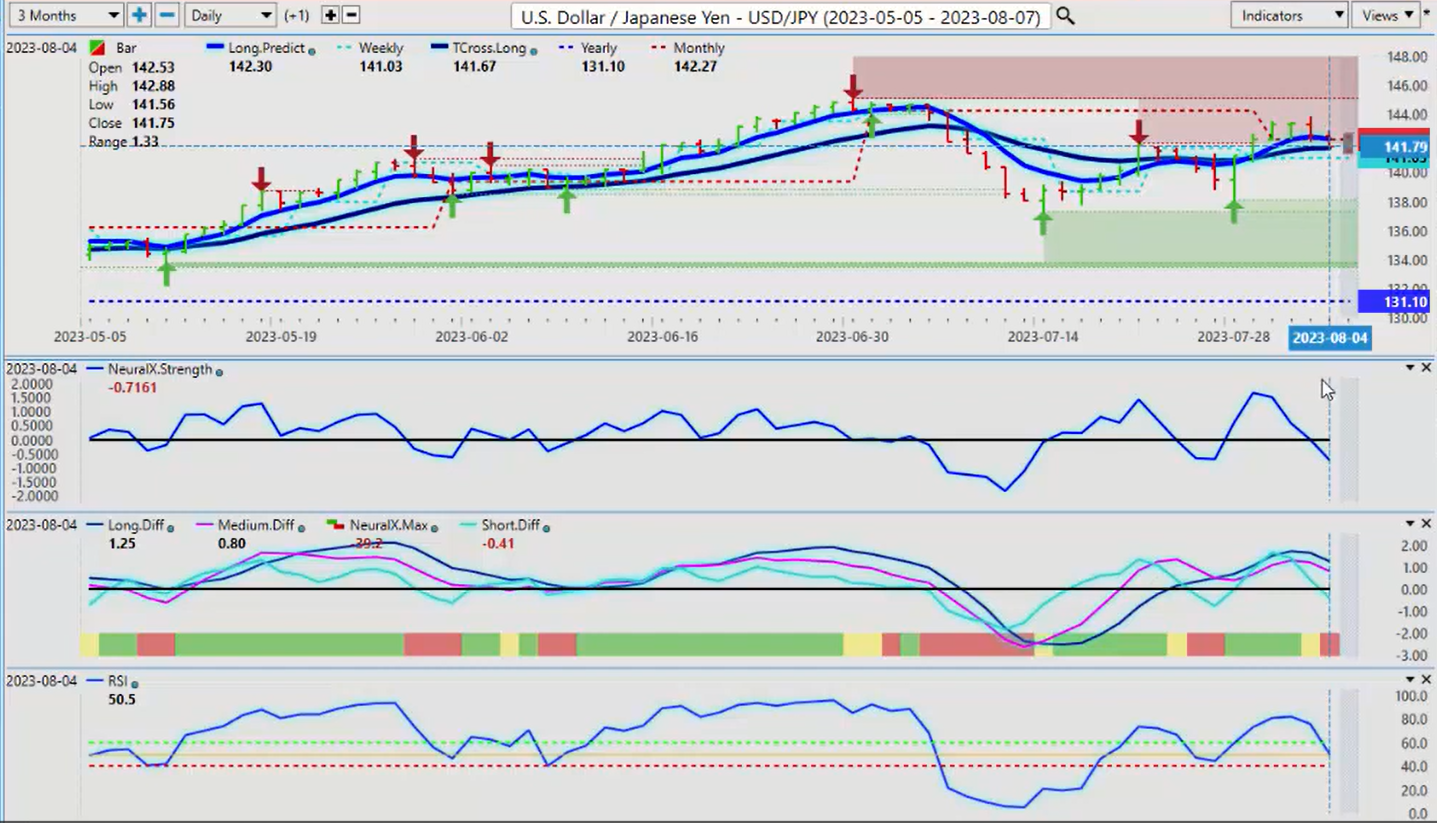
If we are looking at a week where the dollar is going to be weaker, then the dollar-yen could be a place to sell. Neural index strength is definitely supporting that along with the neural index, the falling predicted RSI. But the T cross long, again, 141.67. We need a sustained break of this level. And then we would also be below the monthly opening price at 142.27. Watch these two levels. If they give way, then there is definitely a good short, at least for next week.
U.S. Dollar versus Canadian Dollar
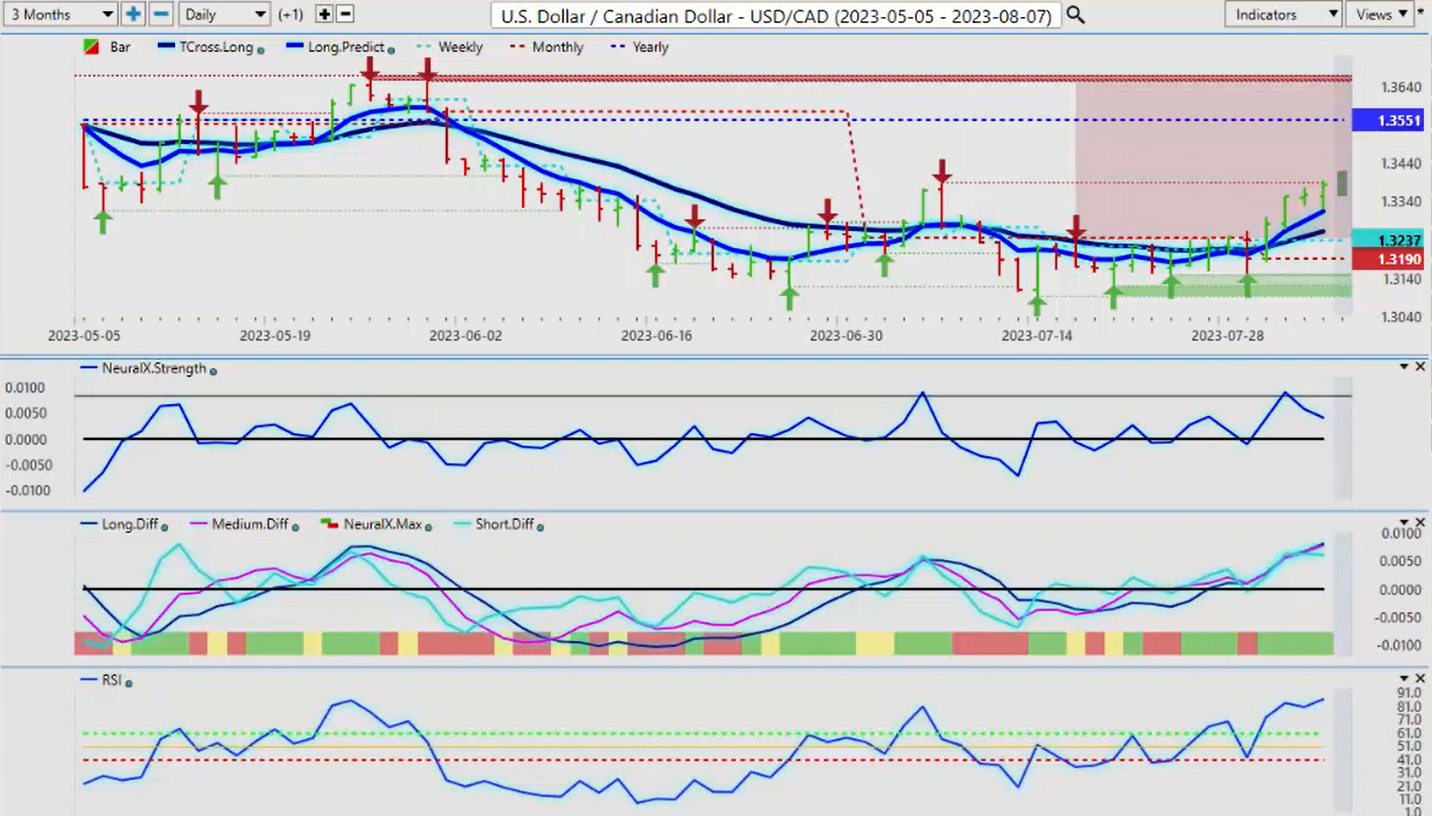
Now, when we look at the US-Canadian pair, I’ve been pretty vocal about the Bank of Canada that I’m not too happy with them.
They certainly got some mud in their face right now. Another terrible labor report out of Canada. Terrible GDP number the other week. I think the rate hikes from the Bank of Canada are done. If that’s the case, then this pair will likely begin to climb, but it has a very high correlation, inverse correlation to the S&P. If the S&P does turn higher, it could still push this pair lower. We’ll take note, again. We’ve stopped exactly on the July 7th high.
That’s another warning sign that even if the Canadian unemployment rate was very bad, the Canada jobs number, terrible, supposed to create 21,000 jobs, we lost 6,000, but those numbers are just noise, guys. If oil continues to rally and gold rallies, you could see the Canadian dollar strengthen. Again, when we look closer at those gold contracts, I believe that they will start to recover somewhat this month. If they do, that too could help the Canadian dollar.
Now, you can see we’ve got an MA diff cross, a rising RSI, the neural index strength on gold, so another thing that points towards dollar weakness, guys, when we connect the dots to these intermarket correlations.
Australian Dollar versus U.S. Dollar
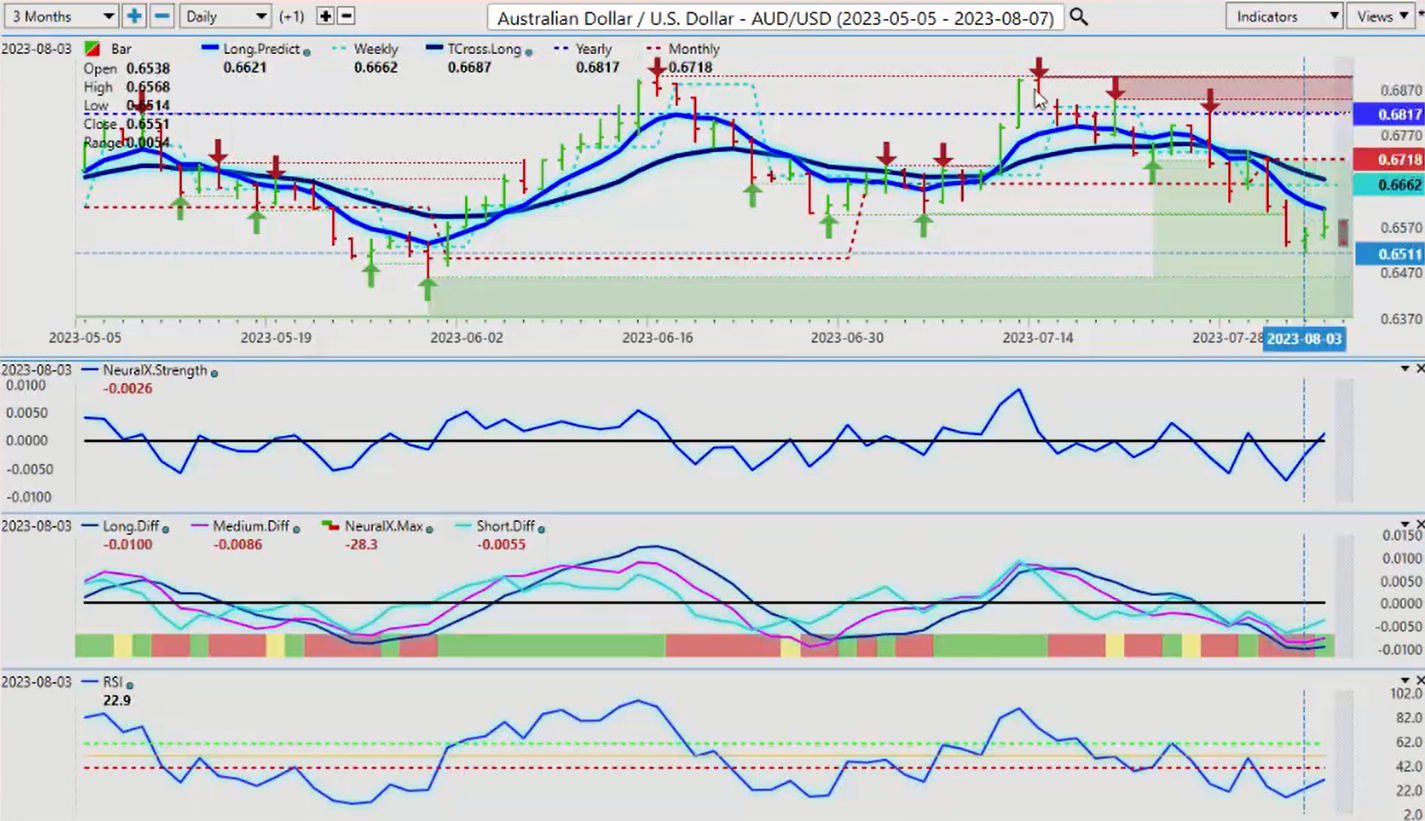
Again, the way these currencies behave, much like the Aussie-US has this month, when we see these verified zones, they’re there because, guys, the verified zones are indiscriminate. They don’t care about this announcement and that announcement. They simply identify the market failed at the high of 1.3387 on July the 7th.
That’s its only purpose. Now, we come up to this level two days in a row and we’re unable to clear it. Be careful of a bull trap up here. I do believe this is a good long trade, but not necessarily next week. Maybe back again towards the end of the month, and then into mid-September, October, November, that’s when the Canadian dollar is weaker. Be cautious. Because the neural index strength is pointing down, we’re getting a little top-heavy on the predicted differences. The predicted RSI at 86.
86 doesn’t matter, guys. It can still go higher. But the main thing is we must clear that July high and stay above it. That is the key thing. But the further we move around from the T cross long at 1.3260, the more likely it is we’re going to retrace to it. I believe that that’s what this pair will do. Now, if that is true, then the Aussie would follow higher. Right now we have a swing low coming in at… Again, the first thing I will do is point out, as we’ve discussed in this weekly outlook, before, not after it happened, guys.
This is an outlook, not a recap of something that’s already happened. I need to stress that. We try to get out in front of these moves. When we see this happening, and this is not after the fact, we’ve discussed it in these weekly outlooks, before it happened, that we’ve got a failure point with the verified resistance, then we see almost the exact same failure again the next month. Right now it looks like we’ve got some recovery happening. And if you look at these recovery points, they mirror the upside failure points.
We look and on the 7th of July, it turned around and started going higher. When we look at this here on August the 3rd, we’ve paused. We’re not going any lower and we’re starting to move higher. I would anticipate a retest of the T cross long, that level coming in at .6675. Again, the predicted differences are starting to turn up. Our neural index strength is warning us that this move down is struggling. We combine that with the additional VP indicators. For next week, we’ve got a low point here of .6514.
If we’re not getting below that, then that gives us the green light to buy up to the T cross long at .6675. Again, we are trying to anticipate these moves. And on your VP charts, you can simply draw a line on that and make that a support at .6516 and say, okay, well, as long as we’re holding above this, I think there might be a long trade because these VP indicators are telling us that that is likely. What I would do is watch for a sell off on this pair on Monday and early Tuesday, and then watch for reversal higher Wednesday, Thursday, Friday.
New Zealand Dollar versus U.S. Dollar
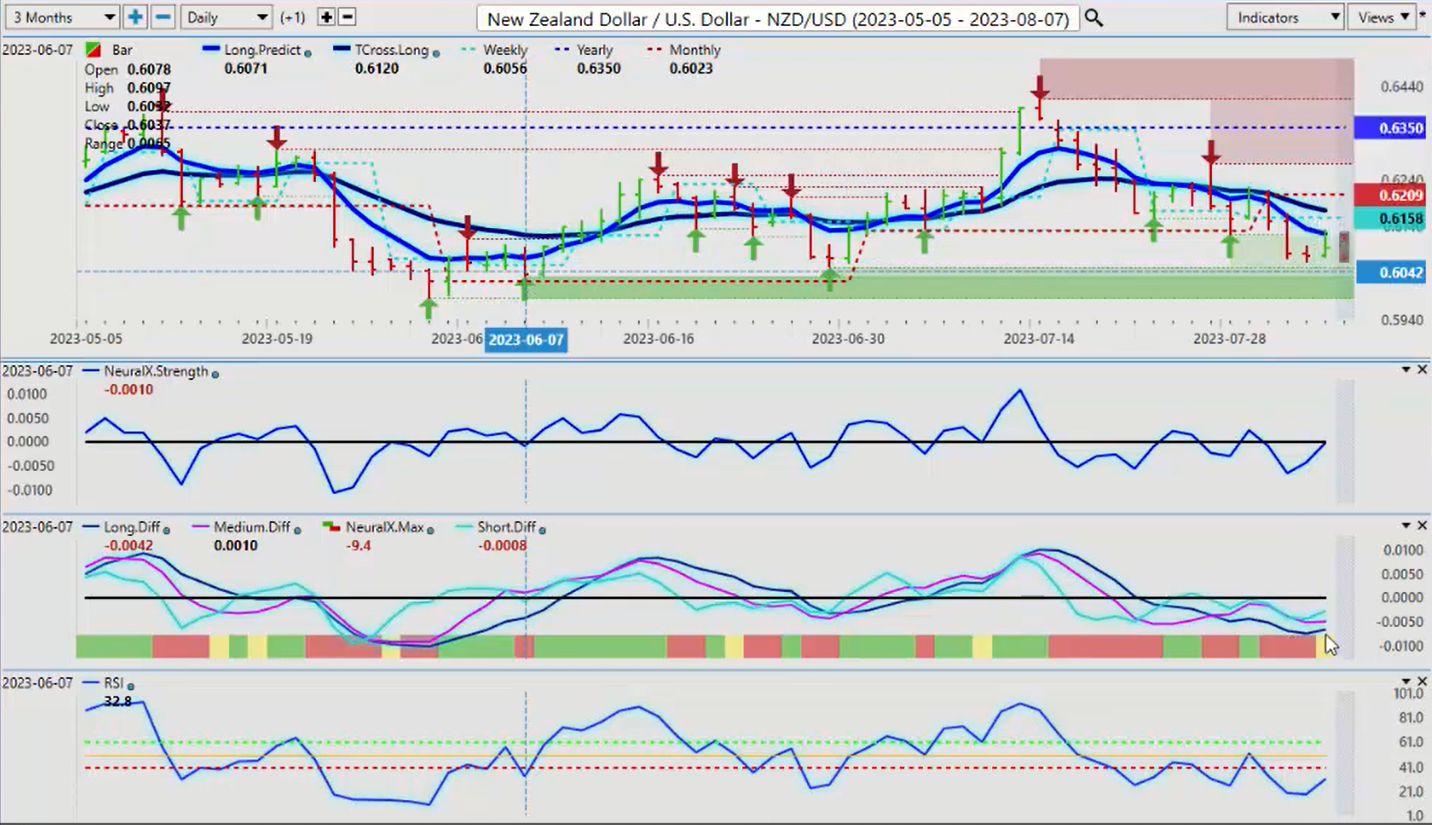
I would say the same thing is incredibly likely with the New Zealand Kiwi. We’ve got a low point rate here. We can connect the dots to the additional verified zones. Again, the indicators are pointing up, not as strong as the Aussie, but a very similar scenario. We would target the VP T cross long at .6174. What we need for Aussie, New Zealand and Canadian dollar strength is that intermarket correlation of the stock market moving higher.
I believe that that jobs report was just bad enough that it may help the stocks do exactly that. With that said, this is the VantagePoint AI Market Outlook for the week of August the 7th, 2023.