-
View Larger Image
Welcome to the Artificial Intelligence Outlook for Forex trading.
VIDEO TRANSCRIPT
Hello, everyone, and welcome back. My name is Greg Firman and this is the VantagePoint AI market outlook for the week of August, the 1st, 2023.
SPDR SPY ETF ($SPY)
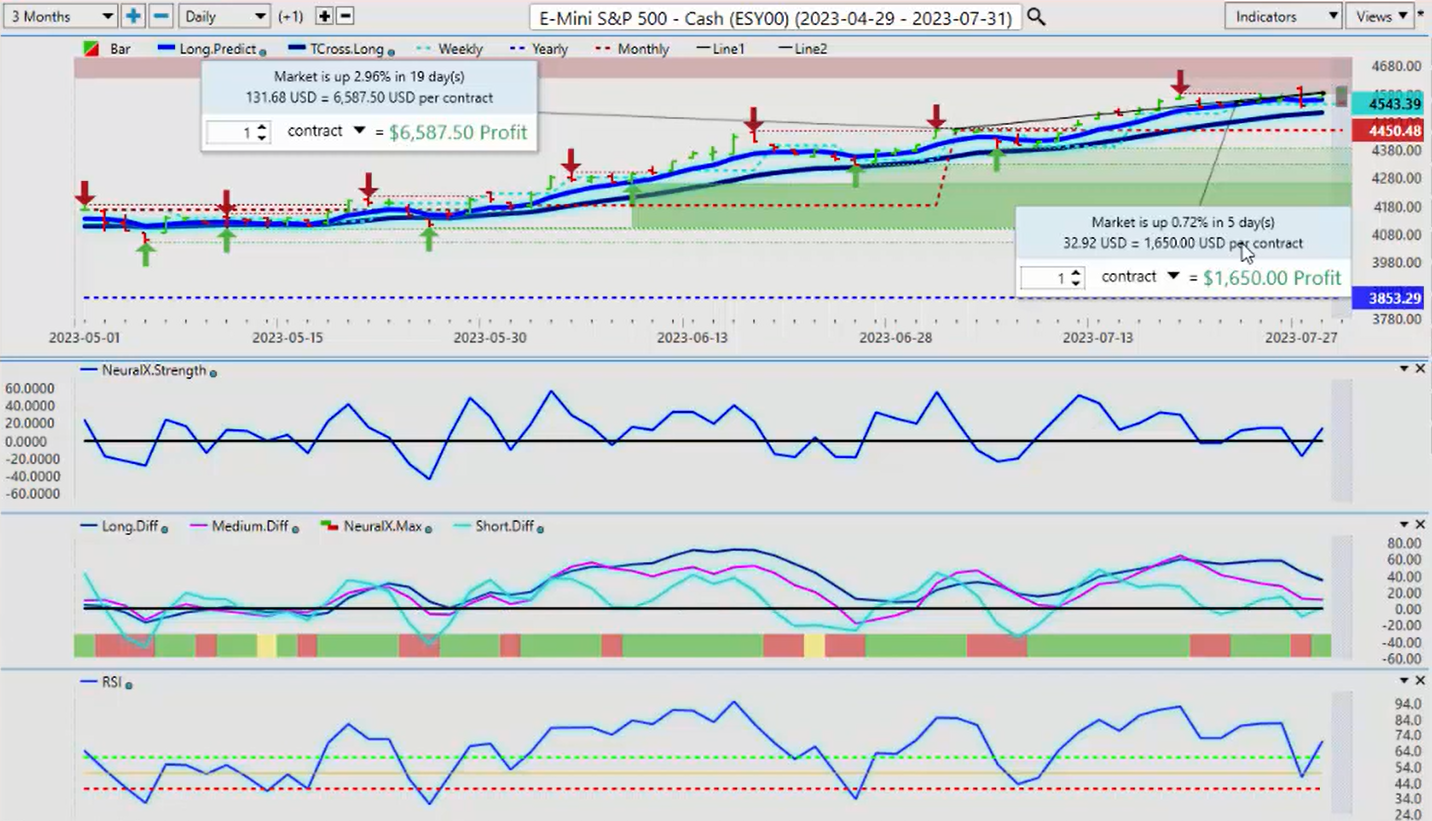
Now, to get started this week, the first thing we want to do is make sure we’re doing an accurate check of the performance of the main markets. Now, when we look at the equity markets for the month of July, we can see that we’re up 2.96%. Now again, what I’ve talked about is using proper anchor points in our trading, not rolling performance, because that can be very misleading. We want to know exactly where we’ve been on the week and on the month. So on the month with the spy’s of the S&P 500, we’re up 2.96%, but this previous week we’re actually not down on the week, we’re up 7.72%. So still a decent week for the stock market.
You can see that this entire week we’ve been running along the VantagePoint long predicted. Now again, this is a very strong predicted moving average, 41.20. The entire week, we’ve bounced off of that. We’ve seen a lot of volatility on Thursday. I’ll talk about that more in a minute, but that’s largely profit-taking after the fed and the fed comments on Wednesday. So for next week with the spies, we can see that we’ve got a reverse check mark on our neural index strength. The predicted RSI is holding above the 50 level. Now our predicted differences still a bit of a concern for a deeper corrective move, and if we’re going to get that, it would likely be next week. So we would look for a move potentially down towards our T-cross-long 45.12. This is our main pivot level that we would look for.
If we’re holding above that, we stay long. If we break down below it and stay below it, we look for shorts. But the core indicators from VantagePoint are mixed, but the neural index and the neural index strength are both in agreement. The predicted RSI is telling us we have building momentum on the equity markets yet again. So once we’ve looked at that and assessed the actual real performance in the month with the equities, it still has a bias towards stocks.
U.S. Dollar Index ($DXY)
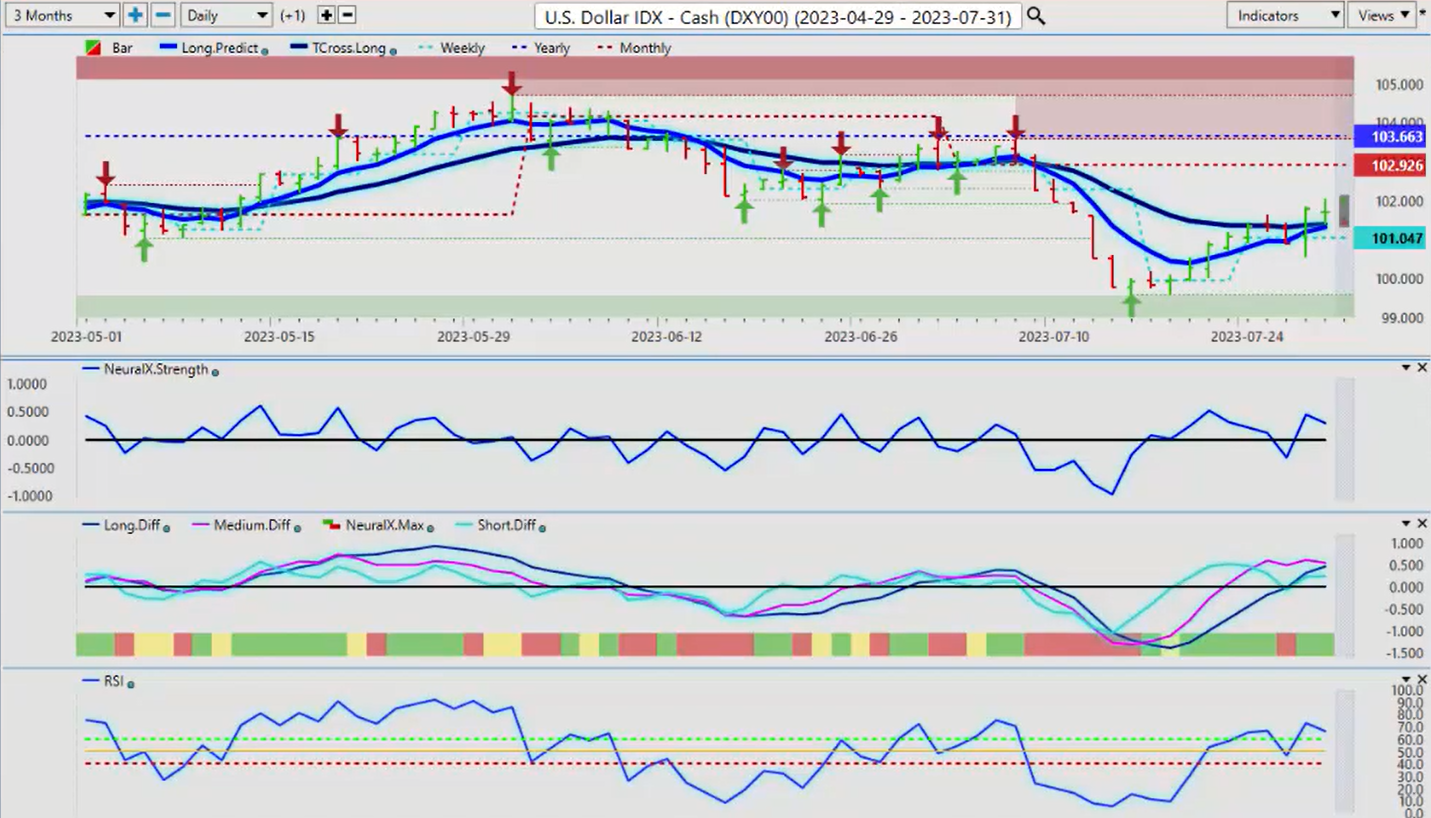
Now, the dollar has recovered based around the fed, based around that GDP number largely. But again, when we look at some of the core indicators, they’re actually nowhere near as bullish as what you would think; the neural index strength, excuse me, again, is sloping on a downward angle. Now the neural index is green, but as you can see, the medium term is getting ready to cross the long-term predicted difference that if nothing else is warning us to be very cautious here.
Now when we look at the true performance of the dollar in the month, it was not good at all. We remained firmly below the yearly opening price and the monthly opening price. Now this past week, we can assess here in fed week that we’ve largely held above the weekly opening price and we’ve seen some pretty good rallies. However, what I will point out here is that the bulk of this rally came on one day, which was on Thursday. In the VantagePoint live training room, we work on this based around the five-point plan that Thursday is a reversal trading day and very often Friday goes back to its normal price. So we have to allow for this, plus the market trying to digest what the fed is going to do here.
Again, the fed still remains using lagging indicators to make his decisions, but it would appear that his hikes are going to be very limited, if any more this year, we’ll see. But for now, the dollar is holding above our T-cross-long 101.38. In the first week of the new month prior to the non-farm payroll number, we do see dollar strength that dollar cycle, but in the month of August, liquidity dries up here, guys. We may only get that for a day or two and there’ll be less dollar buying because, again, a lot of people out on vacation. But for now, the dollar is actually not as strong as what it would appear to be based on these core indicators.
Gold
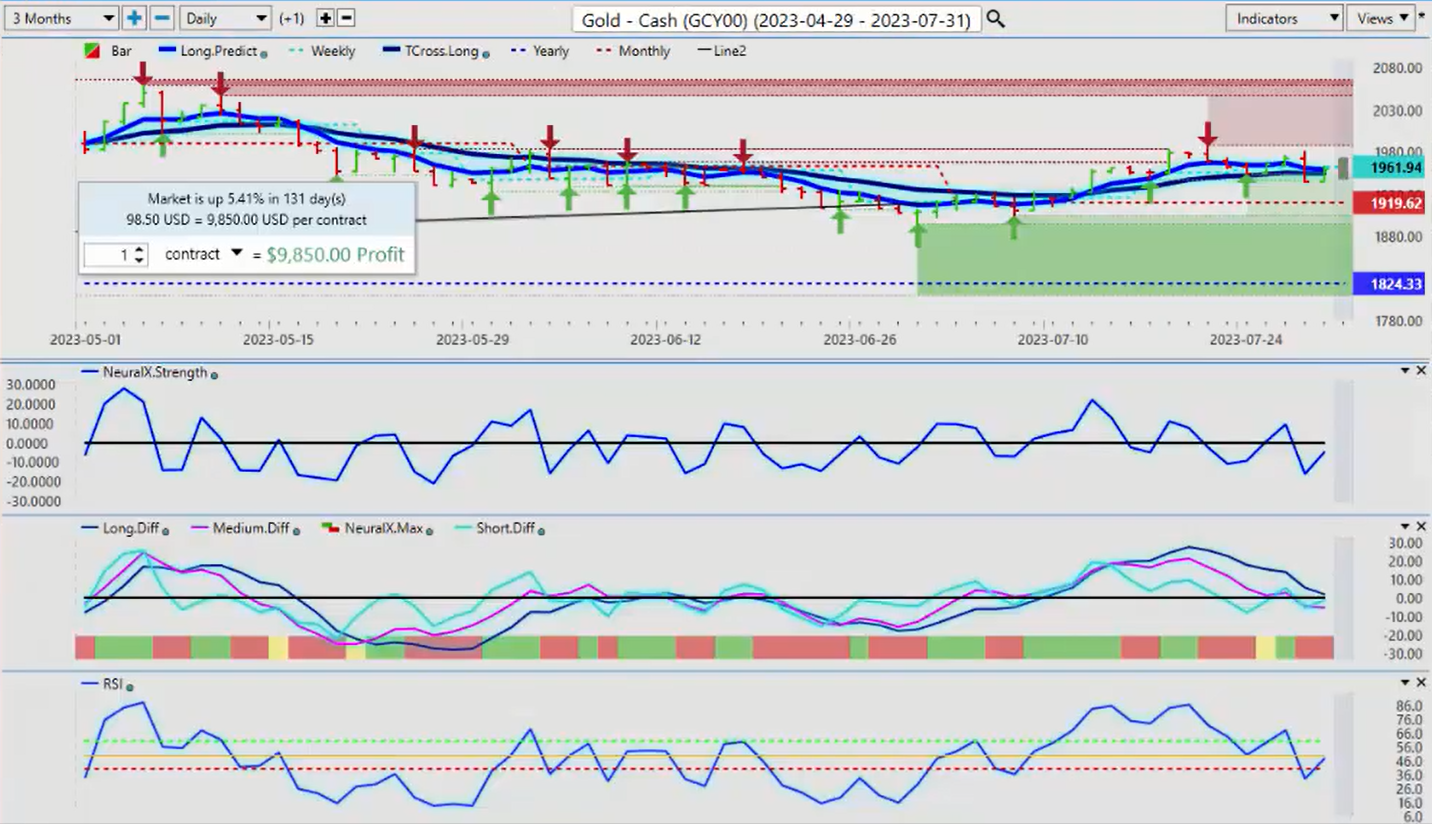
Now with gold prices this week, again, only in my respectful opinion, I think it was a good buy and a dip. You can see we’ve had a pretty strong drop on Thursday. But remember, guys, that Thursday is a profit-taking day. I often have used the terminology that I have a two-day rule because like many other people, I’ve been caught in moves like this only for the next day for it to turn around again.
So again, gold usually does okay from a seasonal standpoint at this time of year. So you can see on Friday we’ve started to reverse those losses and we did not close below that T-cross-long at 1954.90. We’re closing the week at 19.59. So again, I don’t think gold is done yet by a long shot. You can see the reverse check mark on the neural index strength. The predicted RSI is not holding momentum below the 40 level. We’re looking for a consistent breakdown below the 40 level, and I want to see that slope continuing to move down, but as you can see, it’s not.
So I would look for gold to try and recover somewhat, but again, we are going to have some dollar buying here, guys, which will put a little bit of pressure on gold. But it’s very, very important because in my respectful opinion with my own direct client base is that a lot of traders get caught in Monday price and on Thursday price, and Thursday is the new Friday, guys. 10 years ago, these moves would happen every Friday morning, but now they’re usually happening every Thursday morning, usually around 10:00, between 9:30 AM and 11:30 AM on Thursday. So be very, very cautious around that particular time.
Now, with the idea that the US is not going to have a hard landing, they’re going to have a soft landing that has not been validated despite the comments from the media.
Crude Oil
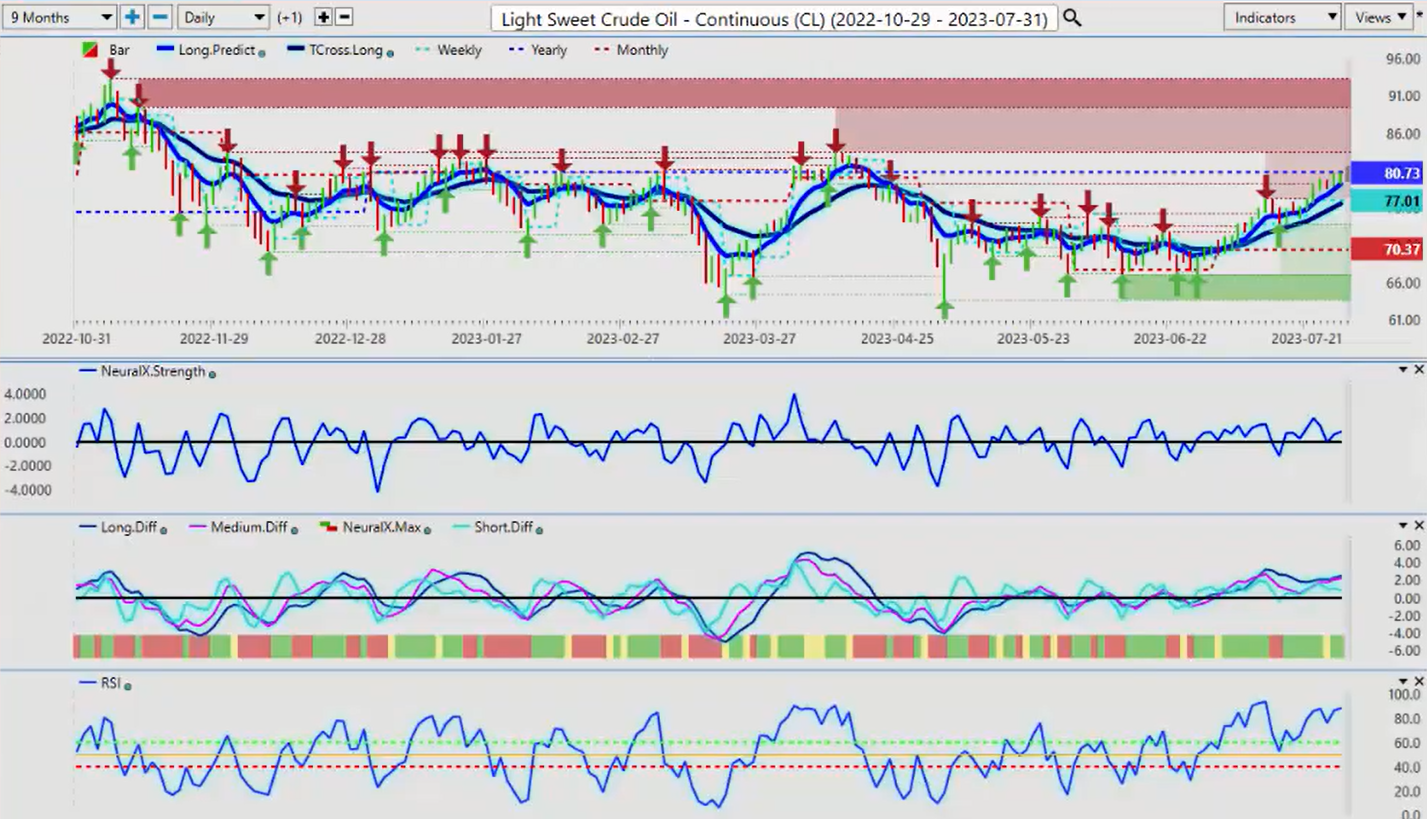
Once again, oil is reacting to this, but again, when we’re using proper anchor points, and again, that’s at the beginning of the year, the beginning of the month, the beginning of the week, then we have a hard line in the sand, which is the yearly opening price, 80.73. We’ve come up to this level all week and we are stalling. So if oil is going to fail, then it’s going to be at this level, and it’s likely going to be next week.
So again, I’m watching the VantagePoint indicators very, very closely for any kind of signal that we’ve got a reversal coming here. Now, the predicted differences are running sideways. Our neural index strength is bouncing off the zero line. The predicted RSI is overextended at 88.3, but that doesn’t necessarily mean it’s going to go lower. What we really need to see next week is, can we see a sustained break of 80.73? Now, respecting the fact that this is an outlook, not a recap of something that’s already happened.
My prediction here is that oil accelerates higher on Monday and then reverses and goes significantly lower on Tuesday or Wednesday. This is what I’ve seen with this commodity and any currency that’s correlated to this commodity, a Monday, Tuesday reversal, be very cautious of this, guys. The initial push likely will be up. The question is, can we hold above 80.73? In my respectful opinion only, it’s very, very unlikely at this time of year.
Bitcoin
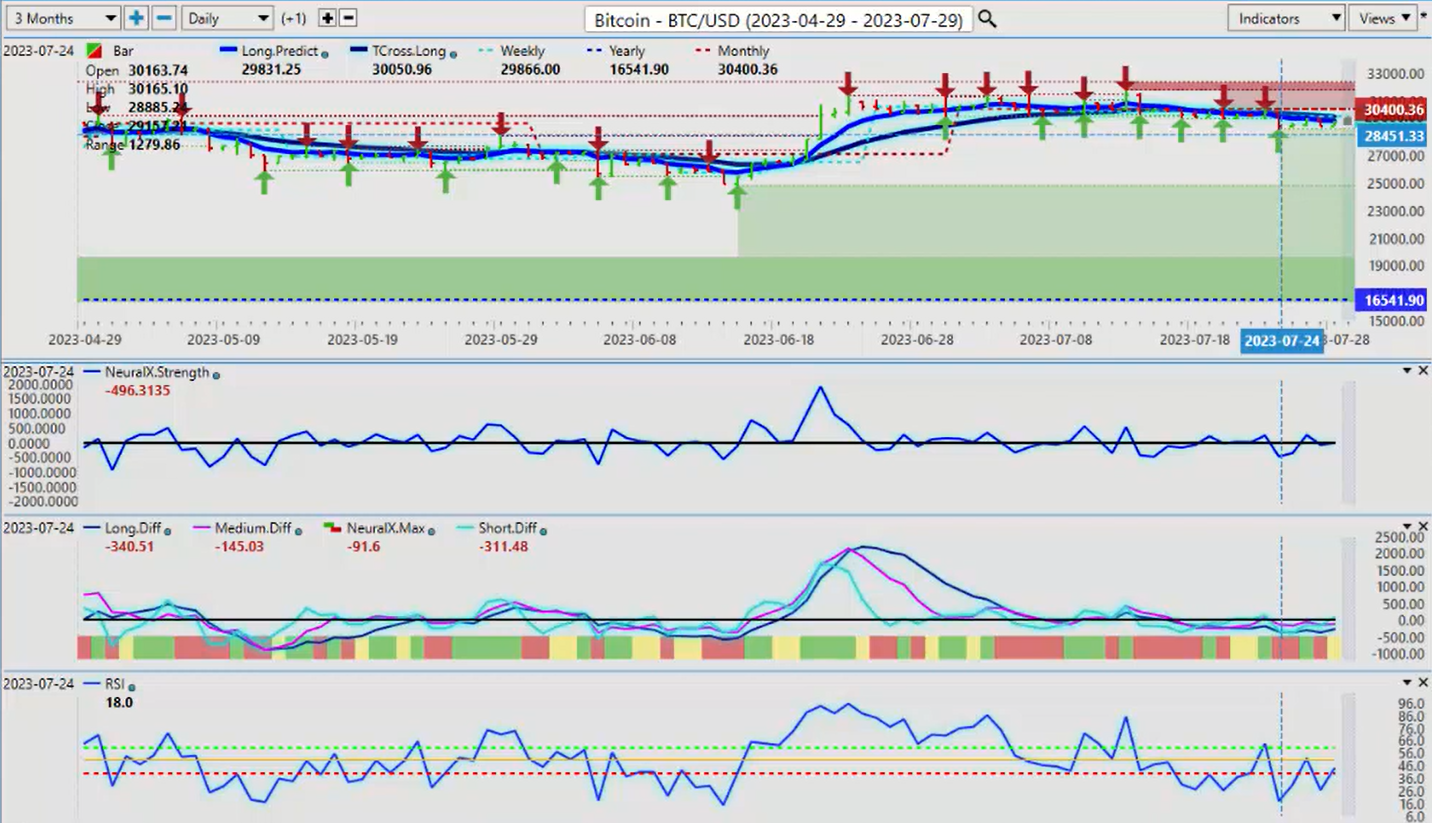
Now when we look at Bitcoin, Bitcoin basically, running sideways along the verified support low, that particular area, 28,885. A stronger seasonality that I can warn you of now is mid-September to mid-October, early November. So be mindful of this coming that despite what these media pundits are saying, Bitcoin is, again, if you look at any year over the last 10 years where Bitcoin’s been down 50% or more in that calendar year, the next three years have been up 50 to 130% every year for the next three years.
So Bitcoin is not done by a long shot. We’re going into summer trading. So I don’t think you’re going to see a lot of movement in any of these markets in the month of August; they’ll be very subdued. But for now, for the coming week, we look at our verified support low at 28,885, and it remains along while above that particular level.
Euro versus U.S. Dollar
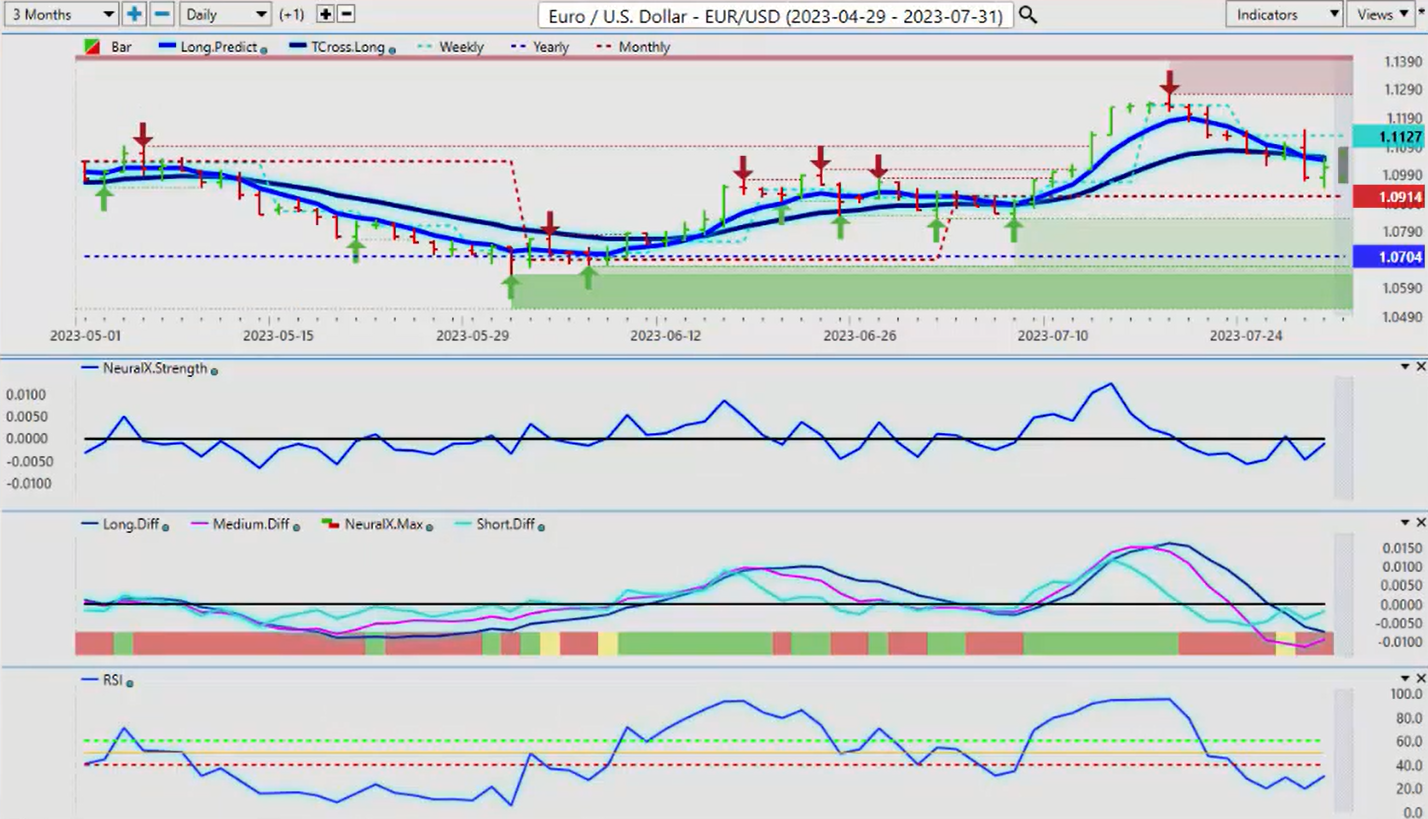
Now, as we look at some of our main Forex payers, once again, we can see that when a country hikes their interest rates, that doesn’t always benefit the currency, despite what economists tell us. So as you can see, the eurozone hiking and it really did not benefit the euro in any way, especially at the end of the month in a period of known dollar strength. So for now, our monthly opening price will reset for the month of August, and that’s likely going to be somewhere, I would, guess, around the 109.80 area. So if we can get back up above 109.80 and stay above that, then the euro is a chance. But if you look at the indicators from a predictive standpoint, not from a recap standpoint, right now, the medium term predictive difference is starting to roll back up.
The neural index strength is pointing up. The RSI is starting to recover. This is a classic warning sign that we are only days away from a reversal here. So if nothing else, the MA diff cross warns us to be very cautious of selling down here. The primary trend in the month of July has been up for the euro. We’re above the monthly opening price. We’re above the yearly opening price. You can see we’ve had good action off that weekly opening price, but this past week was just too much for it with the fed, with the ECB.
So it’s given up some of these gains, but even the euro has tried to recover into Friday. Now, if we can, we want to get above our T-cross-long 110.51. If we can get back up above that, then that should start the euro on a rally upwards. But a lot of factors are going to play into this. The main thing guys, 110.41, 110.51, that’s our long predicted, our T-cross-long pivot levels. We need to clear those. If we can’t get above those, guys, and we can’t get above our weekly opening price, the trade is not validated. It’s a short for another week or so. That’s entirely possible at this particular time.
U.S. Dollar versus Swiss Franc
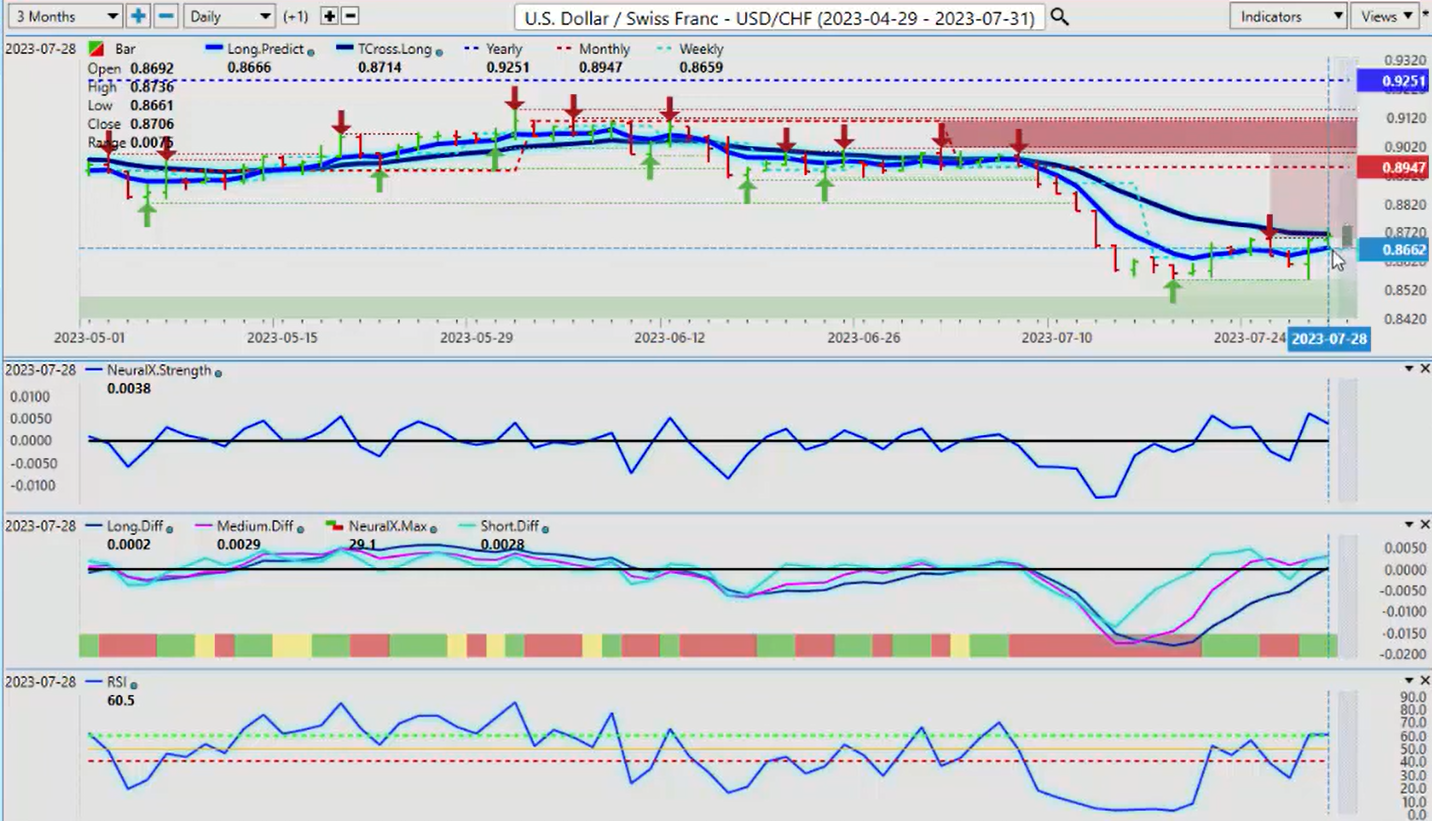
Now, with the US, Swiss franc, a good recovery trade here, the question is, can the dollar make any gains against the Swiss currency? It’s really struggled over the last four or five years. This is not a one-off thing here, guys. There’s been a significant depreciation in the US dollar against the Swiss franc, which is odd because the dollar made such huge gains against the Japanese yen and there’s a positive correlation between the Swiss franc and the Japanese yen. But with the carry trade, that is completely broken down.
So for now, for next week, if we believe that the dollar cycle is still in play and we’re going to get some dollar buying in that first week of the new month, then we would potentially set up our long trades above 87.14. If you want to stay with the primary trend, that is clearly down. Our yearly opening price, 92.51. Horrible month for the dollar against the Swiss franc, again at 89.47; dropping 3 cents here, more than 3 cents on the month. I think we hit a low of, correct me if I’m wrong, yes, 85. So almost 4 cents here, the dollar’s given up. That’s a big move in one month, guys.
So again, the dollar is really showing its depreciation against this particular currency. But if we get some dollar buying, if we can get above our T-cross-long at 87.14, and the indicators are suggesting that that’s possible, the neural index strength is concerning because of that slope. But our predicted short, medium, and long-term differences are turning bullish here, which is consistent with dollar buying at the beginning of the month. So again, we just need to get moving on this, but also we don’t want to labor under the misapprehension that this is a new uptrend that has not been validated at this particular time.
British Pound versus U.S. Dollar
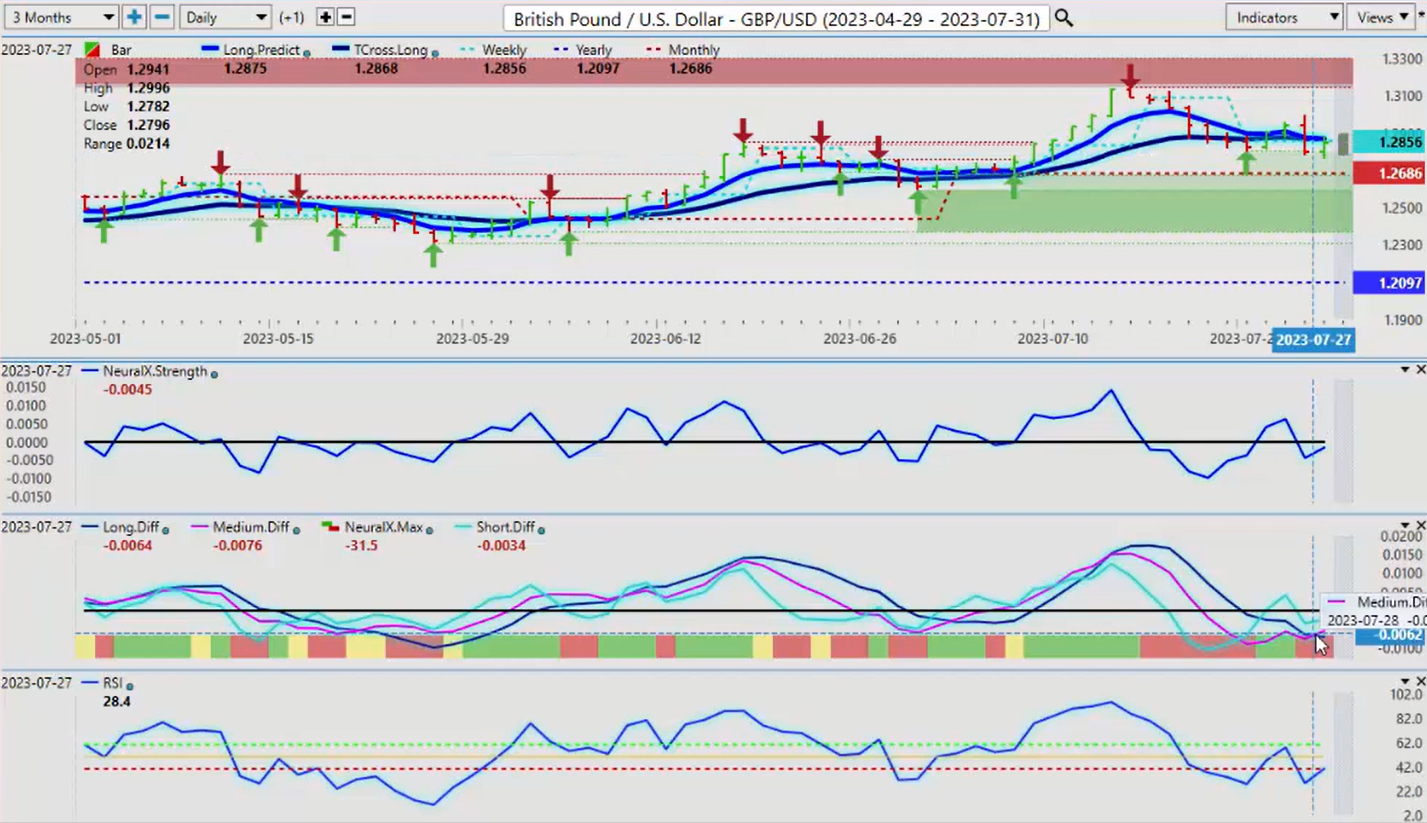
Now, the British pound, again, having a pretty decent week against the dollar, not great, but better. It held its ground, but a lot of this is coming from Euro, Great Britain, guys. There’s selling the euro against the British pound, and that indirectly benefits the British pound, at least for this past week. So going forward into next week, we have a clear MA diff cross on the short-term crossing, the medium-term crossing, the long-term predicted difference, but our neural index is not turned up. The neural index strength, however, is pointing up, suggesting that, “Okay, further euro weakness, but the pound should hold its ground.”
So again, 120.97, the yearly opening price and is still in an uptrend here, but the overall top end of that range now is at 130, 143. The immediate low is the 126.86 area, but I don’t think the yearly opening price is at risk of being tested in the month of August. But in September that could be a different story. But for now, there is a soft buy signal on the British pound at the current time.
U.S. Dollar versus Japanese Yen
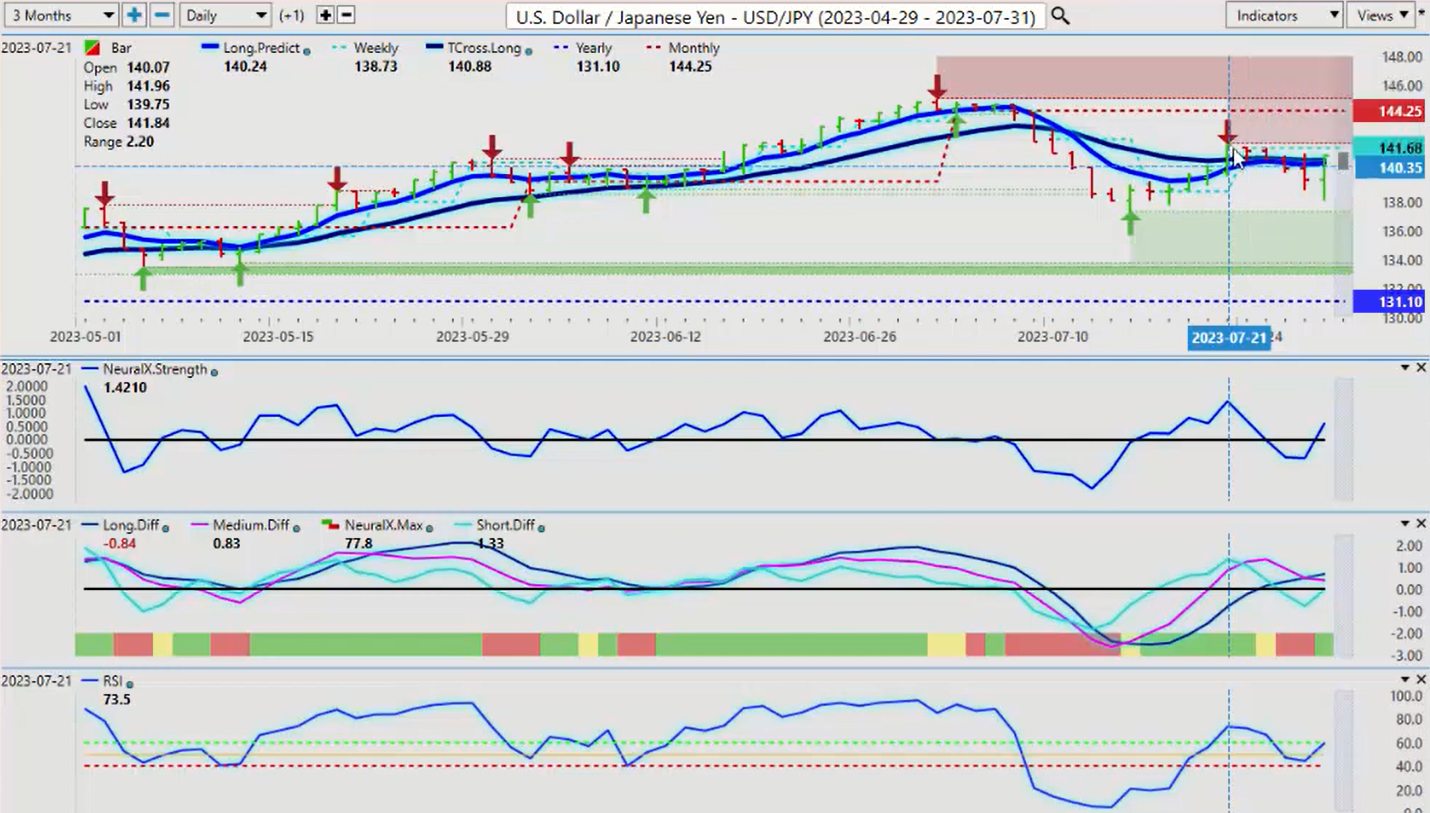
Now, as we look at the dollar, yen, once again, the dollar really trying to regain its composure against the yen. Even with the carry trade, it’s still not a lot of buyers up here. So our immediate verified resistance high is coming in at 141.96. We would need to clear that if the dollar is going to make further gains against the yen, but the month of August is really again, a dead month. The neural index strength here is saying that a break of the T-cross-long is imminent at the 140.83 area, the neural index strength is pointing up, but the MA diff cross is down. So we have a very mixed bag here in a situation like this.
Again, with this being an outlook, not a recap of something that’s already taken place, we have to assess which one do we go with here. In my respectful opinion, we wait and get a close two days in a row above the T-cross-long, and I want to break of that verified resistance high at 140, 196 before I will consider buying up here because, again, this is a very mixed bag, and August is a very choppy month for the yen.
U.S. Dollar versus Canadian Dollar
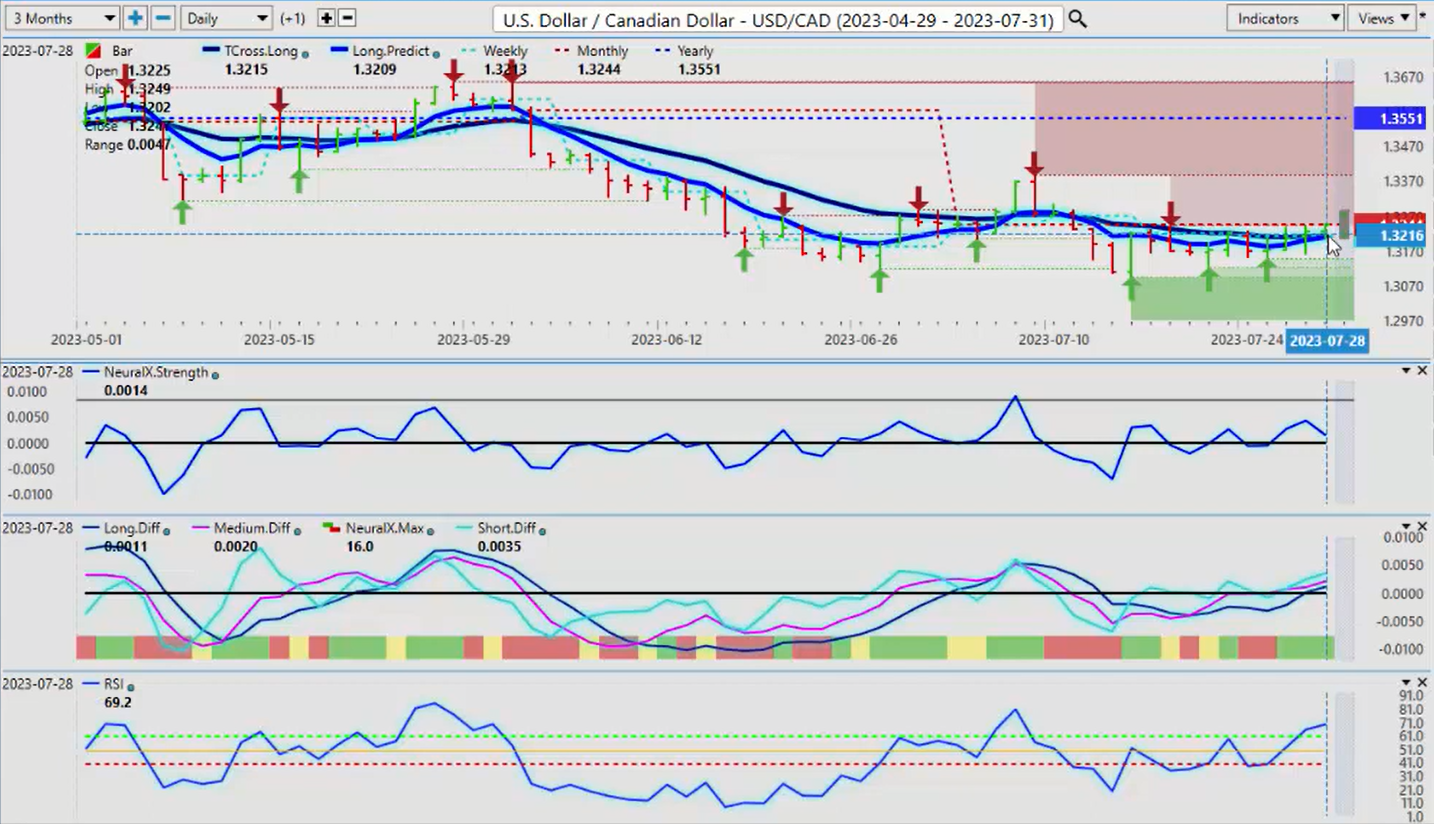
Now, when we look at some of our main equity-based currencies/commodity-based currencies, very few sellers of the US, Canadian pair and with good reason, while the GDP out of the US was strong, it certainly was. There was nothing in that GDP report out of Canada that suggested rate hikes make sense, [inaudible 00:16:05] 0.3 GDP growth; why are you hiking rates? So I think the market is now looking at this and assessing or confirming that the Bank of Canada doesn’t know what they’re doing here. They’re just throwing rate hikes out there, throwing stuff against the wall to see if it sticks.
So again, when we look at this right now, the US, Canada is basically right back to its monthly opening price, pretty much dead neutral on the month whether you bought it or sold it at the beginning of July. Again, that’s why it’s so important to use proper anchor points, not rolling performance. We don’t want to be looking at 365 random days back, 5 random days back in the middle of the month, gauging performance from a 30 days in the middle of the month. We need anchor points, guys, so we can gauge this to see what the real performance is. I’ve been a strong advocate against the Canadian dollar, actually, because of some of the things that are going on, because I’m domiciled in Canada.
So when we look at this right now for next week, this is showing a Canadian dollar weakness, is what this is showing. We’ve got momentum building here, but again, guys, just a little side note, be very cautious with this pair. It has a proven track record of a Monday, Tuesday reversal. So whatever it does on Monday, it tends to do the exact opposite on Tuesday for that one-day period. Some of those moves can be large. So for now, I would like to see us break higher and stay above our VantagePoint T-cross-long at 132.15. So this pair should be starting to move higher. I know the analysts are calling for 128, 129. I’m not in that camp guys. I’m calling more towards the 134, 135 level.
As long as Justin Trudeau is in power, his economic policies and my respectful opinion again only are reflected in the currency exchange rate, and it’s not great. So again, those policies are having a pretty damaging effect to that Canadian currency. So right now, if we can stay above that, longs carry a very strong bias at this particular time.
Australian Dollar versus U.S. Dollar
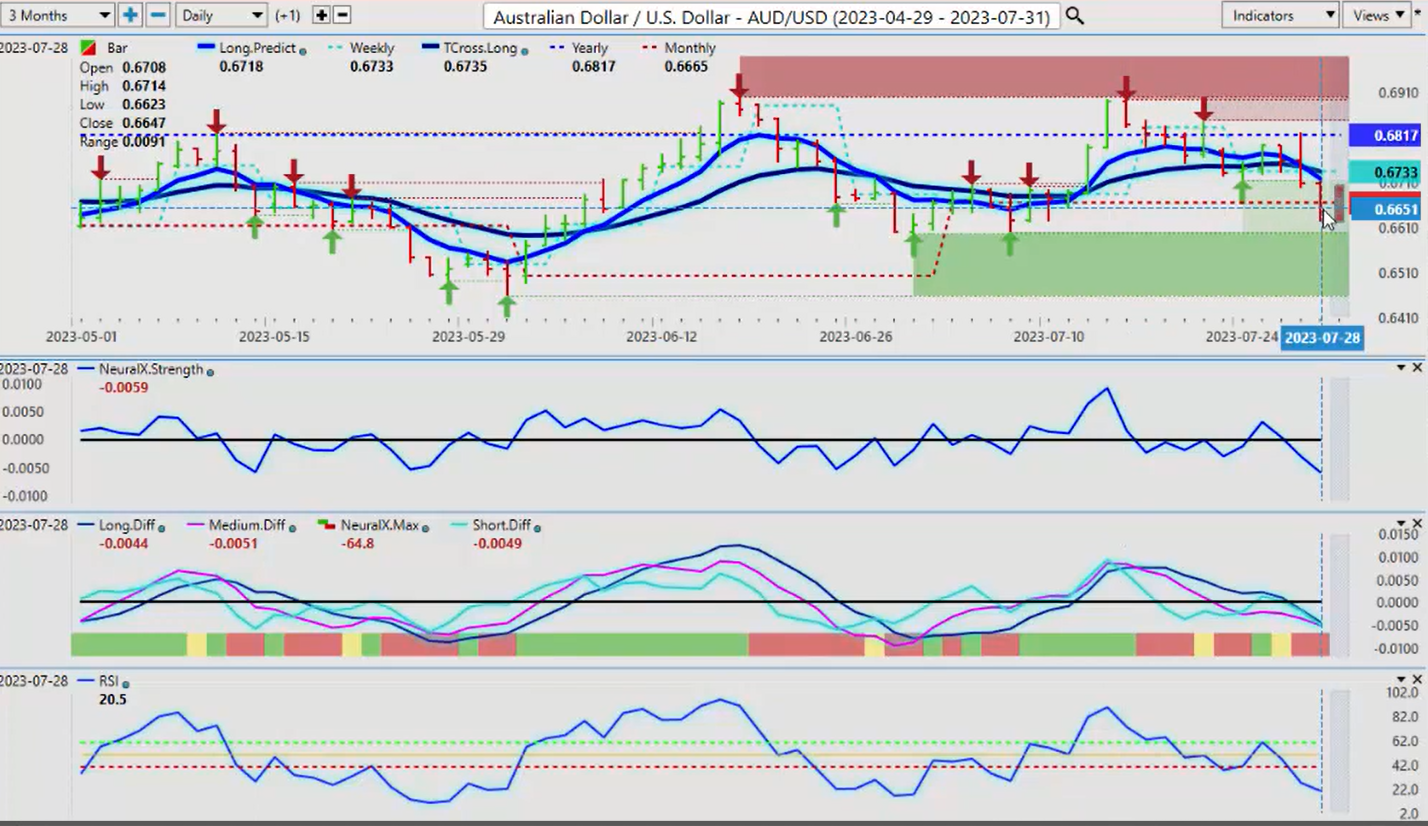
The Aussie and the Kiwi, the Aussie, again, as I talked about in last week’s weekly outlook continues its decline. This is another warning sign, a very high correlation between the Aussie and the Canadian and the New Zealand currencies. One goes down, pretty much all three go down. So again, they’re more equity-based currencies. This is also potentially another warning sign that stocks are getting ready to move lower here and the market is misreading what the fed is saying yet again, or the media is.
But for now, the Aussie is moving and is turned negative not just on the year but now also on the month, but we have additional heavy verified support, low 65.99. I would be looking for that to hold the second the VantagePoint core indicators, the neural index strength, the MA diff cross once they start to turn, but I don’t believe that will be until probably the end of the first week of August or into the second week of August.
New Zealand Dollar versus U.S. Dollar
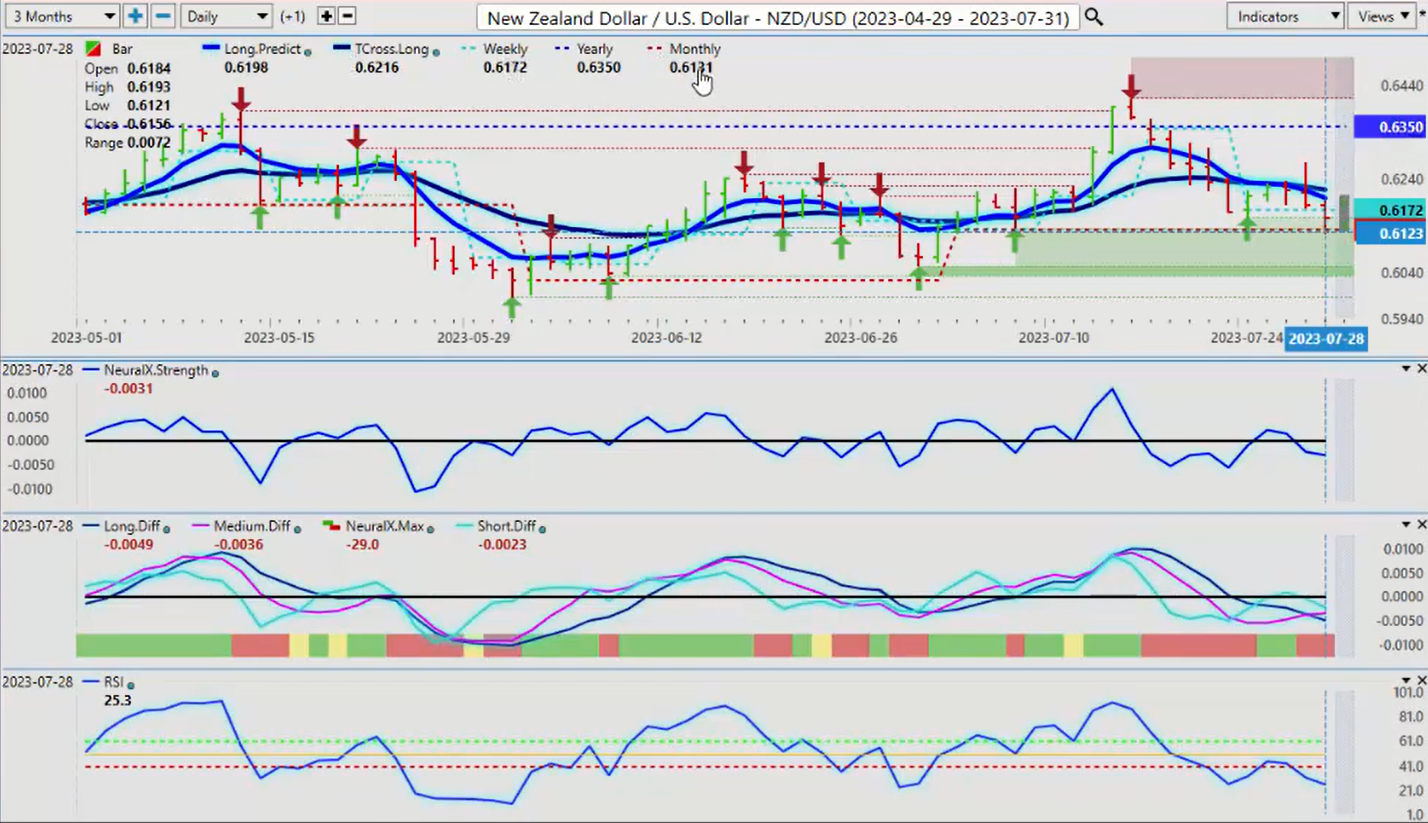
But for now, again, the indicators are warning for a further decline, and the Kiwi is not much better. The Kiwi remains slightly positive on the month. You can see our monthly opening price here using that very powerful point-in-time indicator from VantagePoint 61.31. So the New Zealand carries a slight advantage over the Aussie, here. So another way we can play that is by going to this pair, which is the Aussie New Zealand, which I’ve really warmed up to.
You can see that again right now with the… Just to clarify what Aussie, New Zealand is, in order for them to sell Aussie, New Zealand, they need to sell Aussie, US and buy New Zealand, US. So it explains the reaction to the yearly opening price. So right now, when the Aussie, US turns higher, then it’s very likely Aussie, New Zealand will turn higher, which opens the door for additional trades. But right now these indicators are pointing down, which is suggesting more Aussie weakness, but the New Zealand could stabilize. So what that said, this is the VantagePoint AI market outlook for the week of August, the 1st, 2023.