-
View Larger Image
Welcome to the Artificial Intelligence Outlook for Forex trading.
VIDEO TRANSCRIPT
Hello everyone, and welcome back. My name is Greg Firman, and this is the VantagePoint AI Market Outlook for the week of July the 3rd, 2023.
SPDR SPY ETF – $SPY
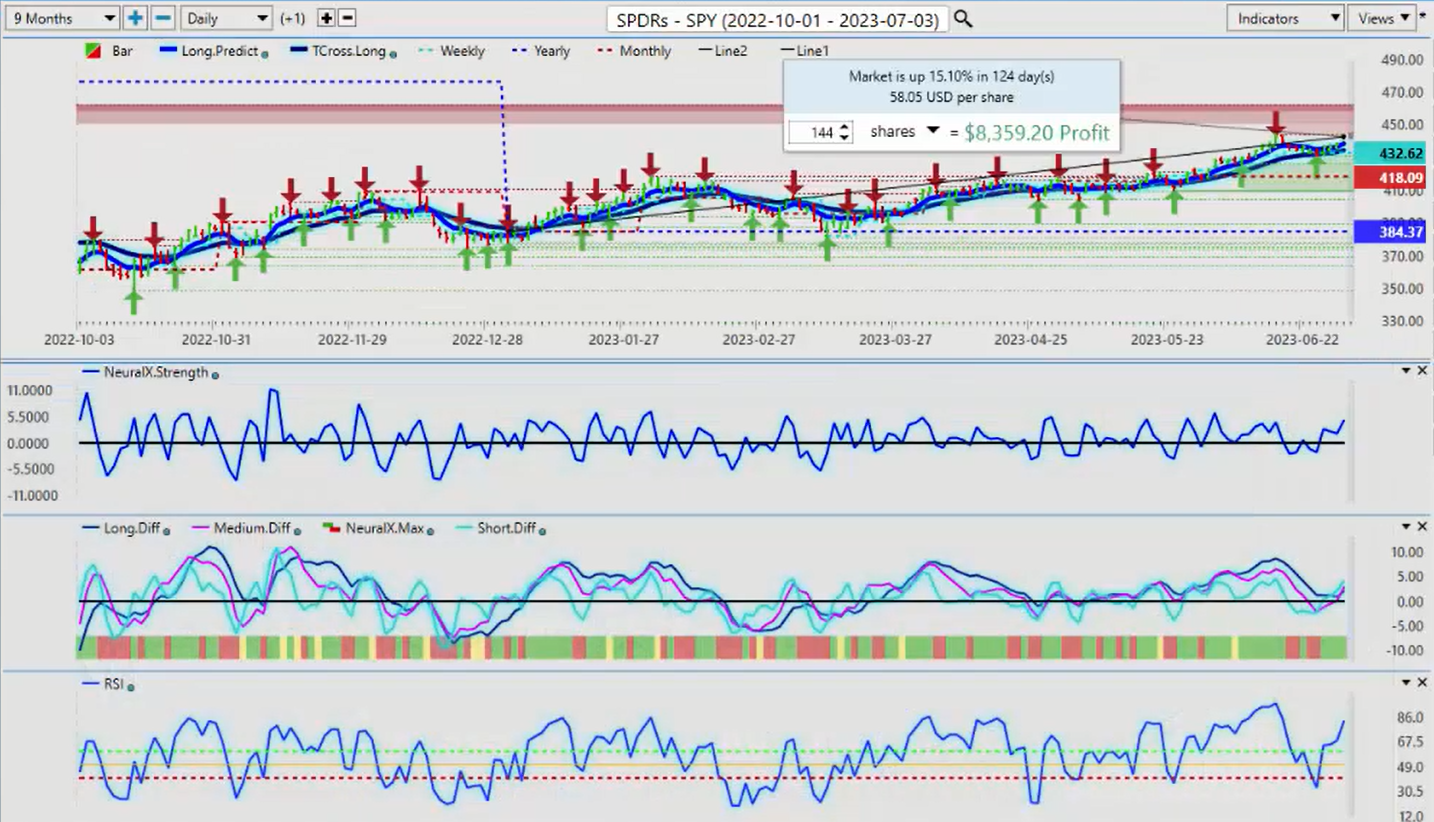
Now, to get started this week, we’ll begin with the SPYs looking at the broader market. Now, once again, of course, the stock markets are covered in this particular outlook via the indexes. The theory here based around intermarket correlations, if the main indexes, the S&P 500, the NASDAQ, even the SPY ETFs, if they’re healthy, then we’re buying stocks. VantagePoint currently forecasting well over 5,000 stocks so, of course, we wouldn’t be able to go through all of those individually so we look at the broader markets.
If we look at the SPYs, we’re up about 15% on the calendar year. We’ve had very good buying opportunities back here in March. Off of that yearly opening price, very critical that we understand how to identify a true trend and not get caught up in rolling performance and all these variables. We’re at about the halfway mark of the calendar year, which was supposed to be a bear market. Now, it’s not to say that it still won’t be, but currently the indicators favor further upside.
However, I will strongly warn everybody about that dollar cycle at the beginning of the month, in the first week of the new month or the week of the non-farm payroll number. Usually the US dollar is quite strong during that particular period, which pushes the equity markets down. But for now, we do have further upside, the area we want to watch this week, the resistance area, the high 400, 4390, that’s the critical area, this verified resistance zone which, again, is somewhat concerning because we’ve had a good retracement off of the T cross long and we’ve come back up, which does favor a push higher.
But, again, we want to be very cautious next week. We’re in a holiday short week. Canada’s out on Monday, I believe the US is out on Tuesday with the 4th of July, so it’s going to be very, very choppy. Then we have the ADP report on Thursday and, of course, the non-farm payroll number on Friday, which the Fed is going to be watching very, very closely.
Now looking at the core indicators, our MA diff cross is up, our neural index strength favors further upside. But again, exercise caution would be my advice for next week because, again, we do need to be mindful that the Fed is looking for stronger labor reports to support his hikes. If that comes to fruition, that will be a very, potentially, a big negative for the equity markets.
Now we can see the SPY versus the S&P 500, the same thing, 15.47% for the year. But once again, guys, remember back in March when they told us only buy dollars, only sell stocks, don’t buy Bitcoin, don’t buy gold. Of course, that was a horrific play and this is why we want to look at using the weekly, the monthly, the yearly opening prices to understand where we actually are in this.
So with the SPYs or the S&P 500, we’re firmly above the yearly opening price. We’ve remained firmly above the monthly opening price in the month of June. Now we’ll monitor this in the month of July, but for the S&P 500 next week or the broader stock markets, we would look or we need the S&P 500 to break through 4,448 in order to see further upside.
Now, the indicators are validating that to some degree but, again, be careful with that dollar cycle. Now, this past week, we have seen dollar buying and the S&P 500 going up. So, again, it could be a different dynamic, but I seriously doubt it.
U.S. Dollar Index ($DXY)
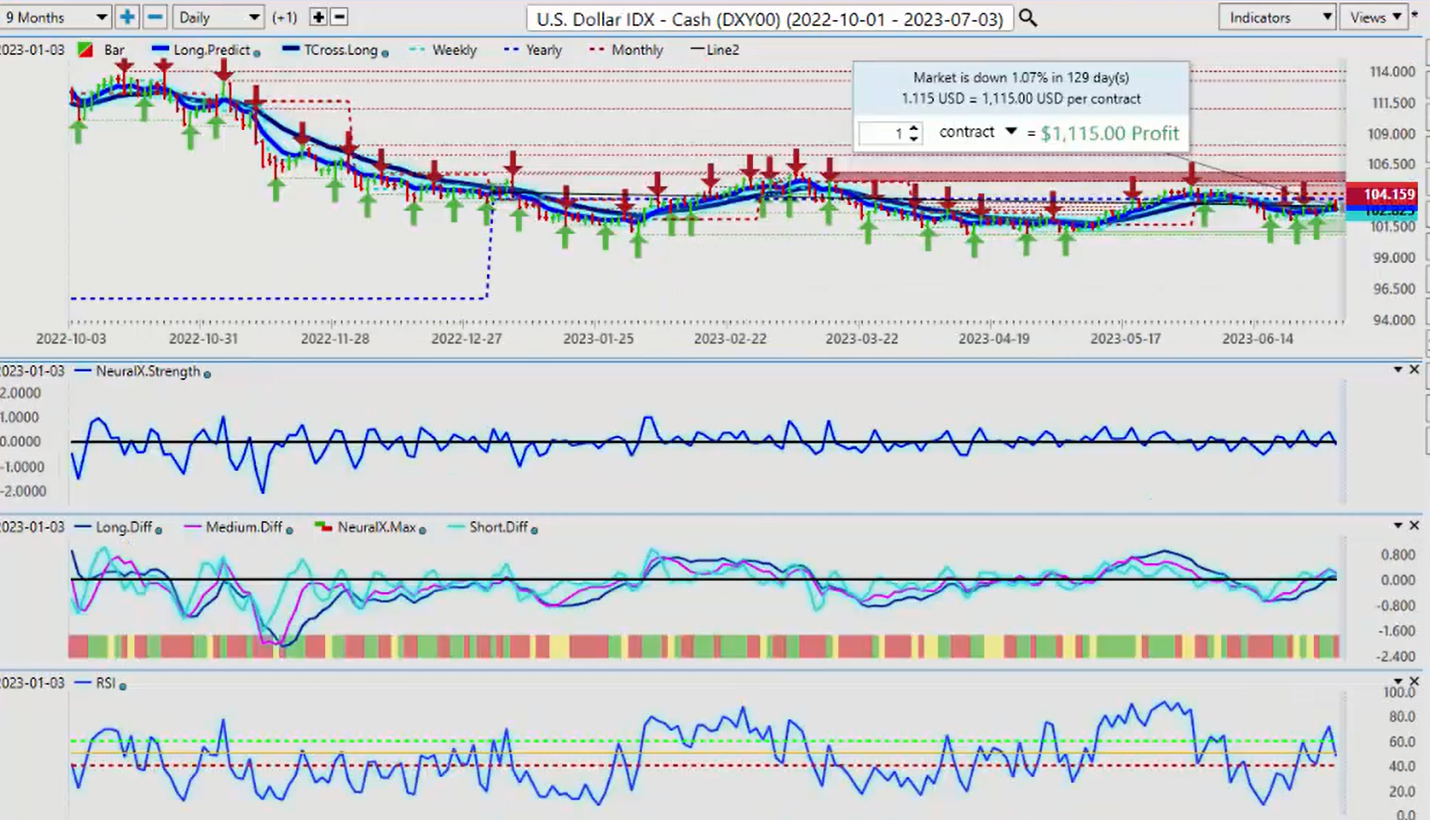
When we look at the current state of the dollar index from a factual standpoint, again, rolling performance, looking at the last five days or the last 30 days without having the proper anchor point of the yearly opening, the monthly opening, and the yearly opening price, we often get false data. That’s very much what happened in mid-March by using those types of lagging performance tools so be cautious with that.
If we look at this, the dollar is down 1% on the year. So basically if you bought dollars or sold dollars at the beginning of the year, you’re up or down 1%. So not a huge move, pretty flat. We’re still running along the lower end of this channel 1.0146. Indicators here favor actually sideways movement. But, again, holiday short week, be very, very cautious from Tuesday to Wednesday, you’re going to see the volatility pickup.
And remember, before we go completely into summer trading here, which would be more towards the end of July and August, it still does favor one more cycle of dollar buying. So I would anticipate some type of recovery on the dollar next week, but by the end of the week, we’re going to get that payroll number. And as you can see using the predicted RSI we’re not breaking down below the 40 level. There’s very little downward momentum at the current time. That could change, but in my view, it will be a week this coming Tuesday.
The normal pattern with the dollar cycle is that it’s strong in the first week of the new month, and it usually sells off by the Tuesday or the Wednesday after the non-farm payroll number. We’ve seen that repeatedly, and we just saw that in April, May and June. So, again, we’ll continue to monitor this, but the indicators right now are still very much sideways for the better part of the calendar year. We’re just moving back and forth in this channel between approximately the 1.0580 area and down around 1.0165.
Gold
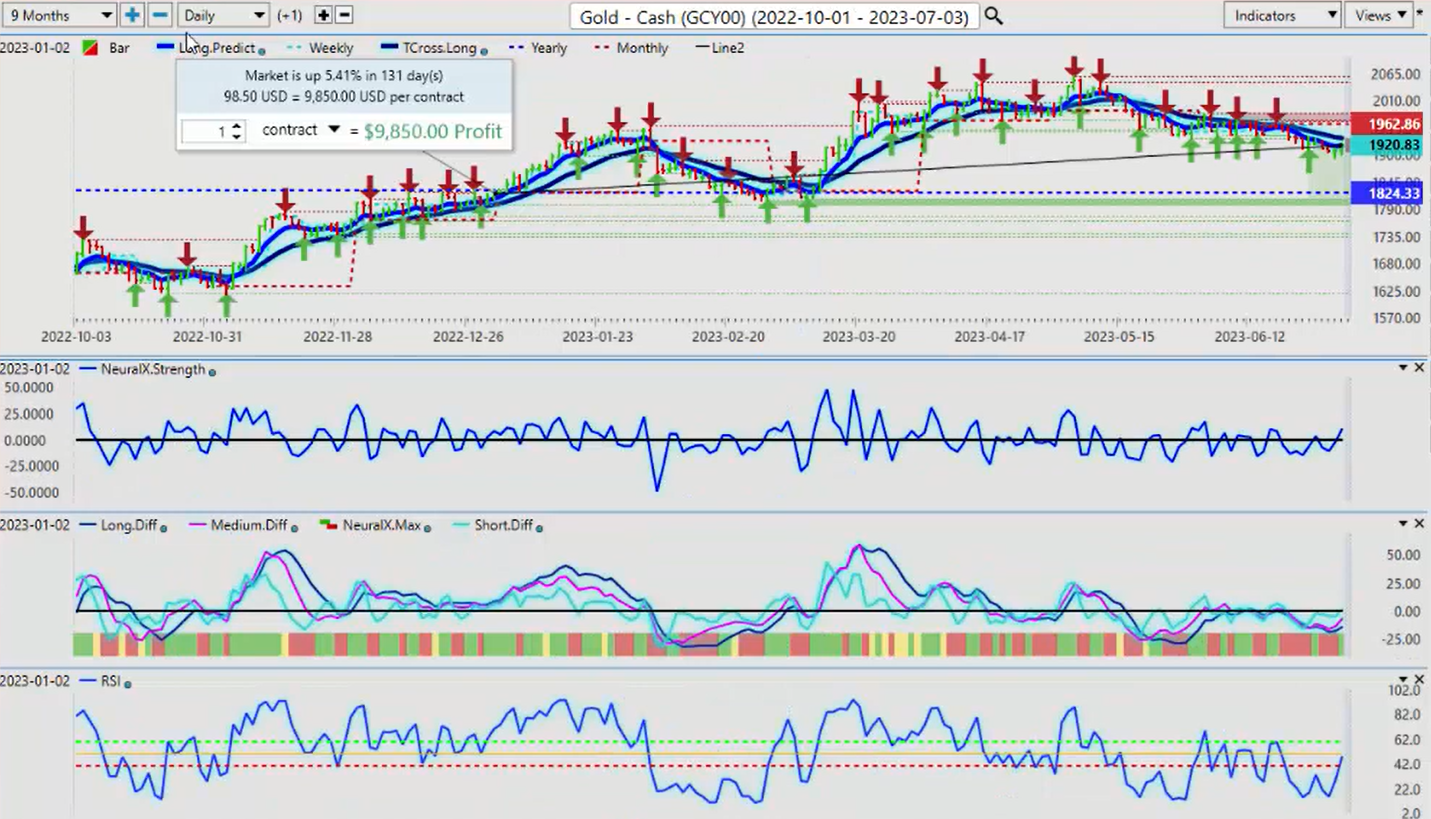
Now, when we look at gold in the calendar year, still up 5.4% and, again, if there’s still the possibility of a recession, then the likelihood is gold recovers firmly above its yearly opening price, 1824. We would be buyers down into this particular area. The indicators in VantagePoint are starting to perk up here a bit and showing we could see some gold buying. But, again, I would wait about a week for this and get through the week of the payroll number, see what those payroll numbers look like.
But I will point out that based on the information that I’ve pulled from the BLS website, these labor, these jobs numbers, I’m not sure what the Fed is actually doing here because the labor market has not been strong. The term seasonally adjusted numbers, the last report, in my respectful opinion only, was not a good report. In fact, none of them have been great, to be honest. But they keep monkeying with these numbers by using the term seasonally adjusted up 300,000, down 300,000.
So, again, focus on that six number, guys, is my advice on Friday. I’ll speak to it in next week’s outlook. But these indicators from VP are starting to rise. The neural index strength, the predicted differences, the predicted RSI, they’re all pointing up at the current time. And, again, the primary trend on gold is still that, is still up, excuse me on the calendar year.
Light Sweet Crude Oil
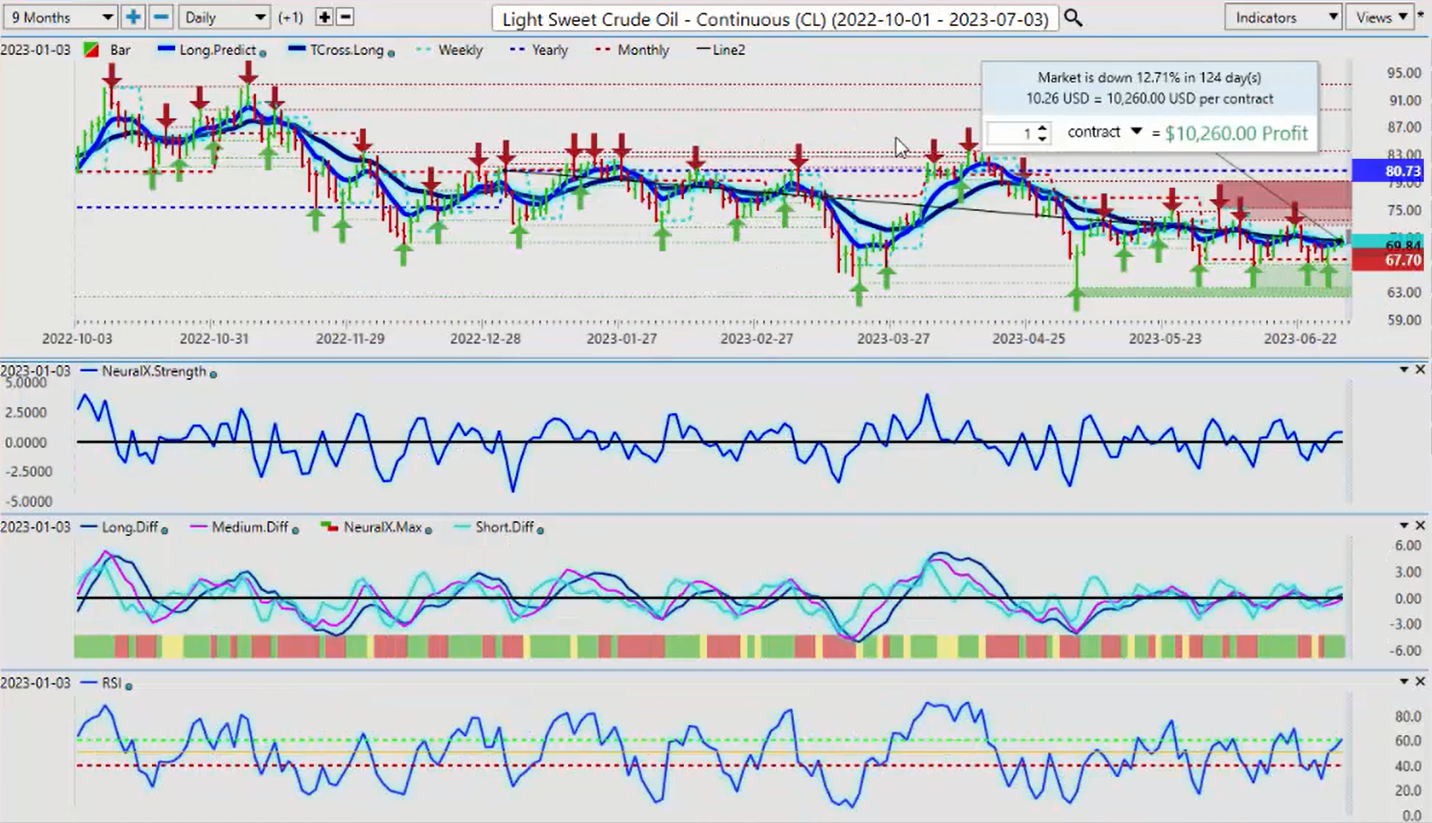
When we look at Light Sweet crude oil, again at the halfway point of the year, down 12%. Talked about this one briefly last week that, again, we’re coming into a pretty well-known end of a seasonality here. Usually about the mid-July oil starts its descent. We’ve had some good buying in oil this year, but predominantly it’s been negative as you can see.
If we measure it accurately or properly from that January 2nd, January 1st opening price, oil has really never been overly, there’s been some good long trades here, but it’s never been positive on the year. So, again, currently sitting down 12.71% which, again, if we use our intermarket analysis theory this, again, points towards a high probability of a recession if we’re not already in one, guys. So the indicators right now are somewhat bullish in nature at the current time, but I believe we’re at the end of this particular rally in oil, not the beginning.
Bitcoin
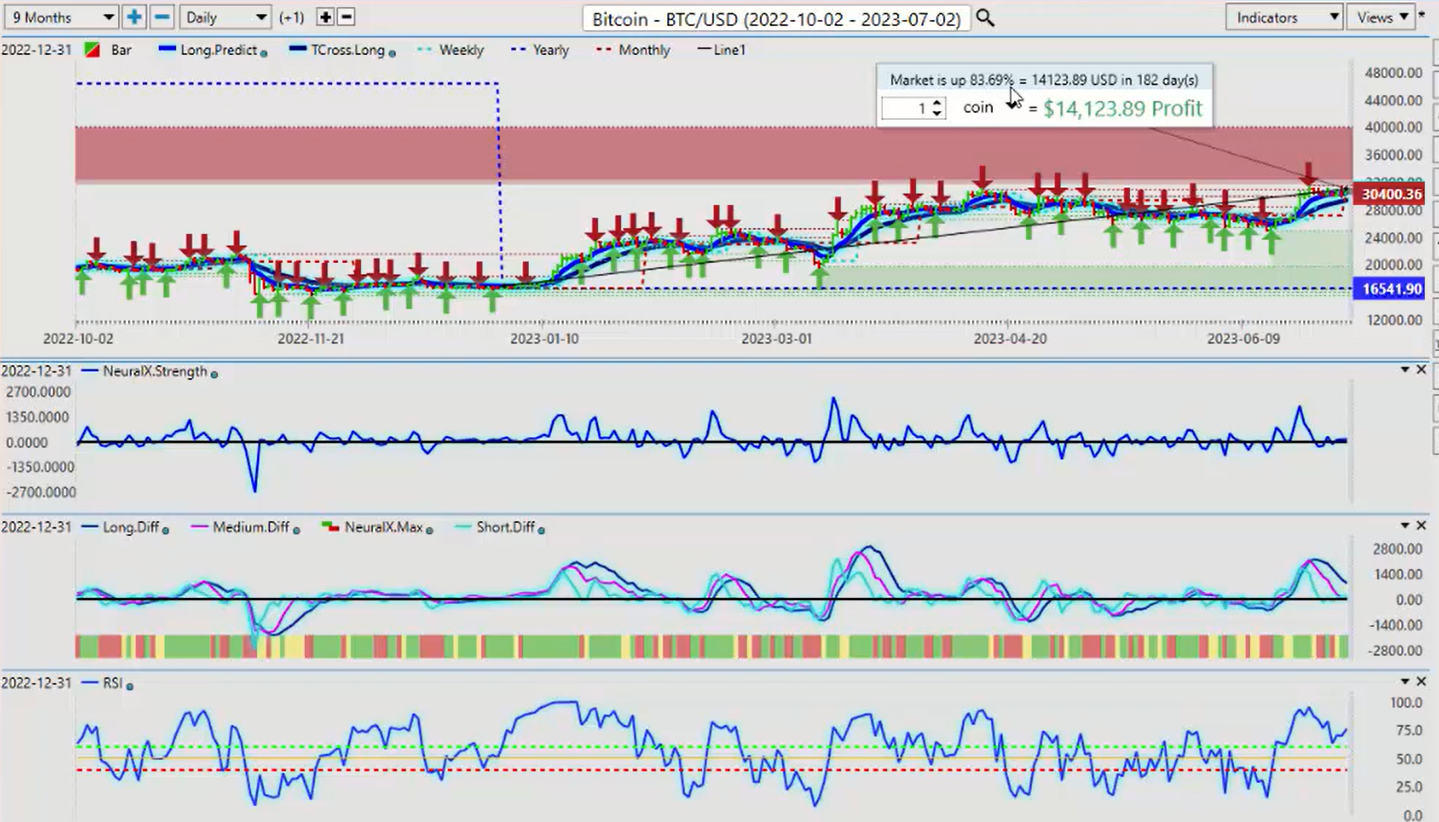
Now, one of my favorites again this year, I talked about this right from January 1st and I said, okay, look, every time Bitcoin has had a 50 or 60% down year, it’s rallied the next three years of a minimum of 50 to 80% per year. We’re already up 83.69%, VantagePoint now forecasting one of my personal lower-end cost stocks, Hut 8 Mining. I believe it’s up about 220% this year, but it’s the correlation to Bitcoin and Hut Mining that makes it attractive.
Again, the stocks are being covered in this outlook. They’re being covered via in the main index. I am Series 3, Commodity Futures license and Series 34, Foreign Exchange license. But my primary work is in futures and foreign exchange. And, again, with the sheer number of stocks that VantagePoint is forecasting, it would be impossible to do all of that in one session. But if the main index is healthy, then the individual stocks, right now I think about 90% of the S&P 500 is up 10% or more, so the stocks are starting to show signs of life there.
But think of Bitcoin the same way, guys. If Bitcoin is strong, look for Bitcoin or blockchain-related stocks like a Hut 8 Mining or there’s numerous other ones out there. If Bitcoin is healthy, then those individual stocks that are related to Bitcoin will also be healthy. So, again, right now, I believe we will have downside on Bitcoin for approximately two more weeks, and then we start into another strong seasonal pattern that usually runs, there’ll be some choppiness through the summer, but September and October are very, very strong months for Bitcoin.
So as high as it may seem as it is on the year right now, remember back in February, again, January, February and March when they told us Bitcoin would be at six or 8,000, again, guys, be very cautious what media outlook you’re following. Always go to our VP charts and our forecasts, our intermarket correlations so we can get a true price on this. The media very seldom will provide that. And once again, when we look at those repetitive patterns over the last 10 years, the big down year last year in Bitcoin was simply a buying opportunity, but they failed to mention that to a number of people. But again, expect potentially some downside on Bitcoin till about the, well, I’m going to say the second week of July.
Euro versus U.S. Dollar
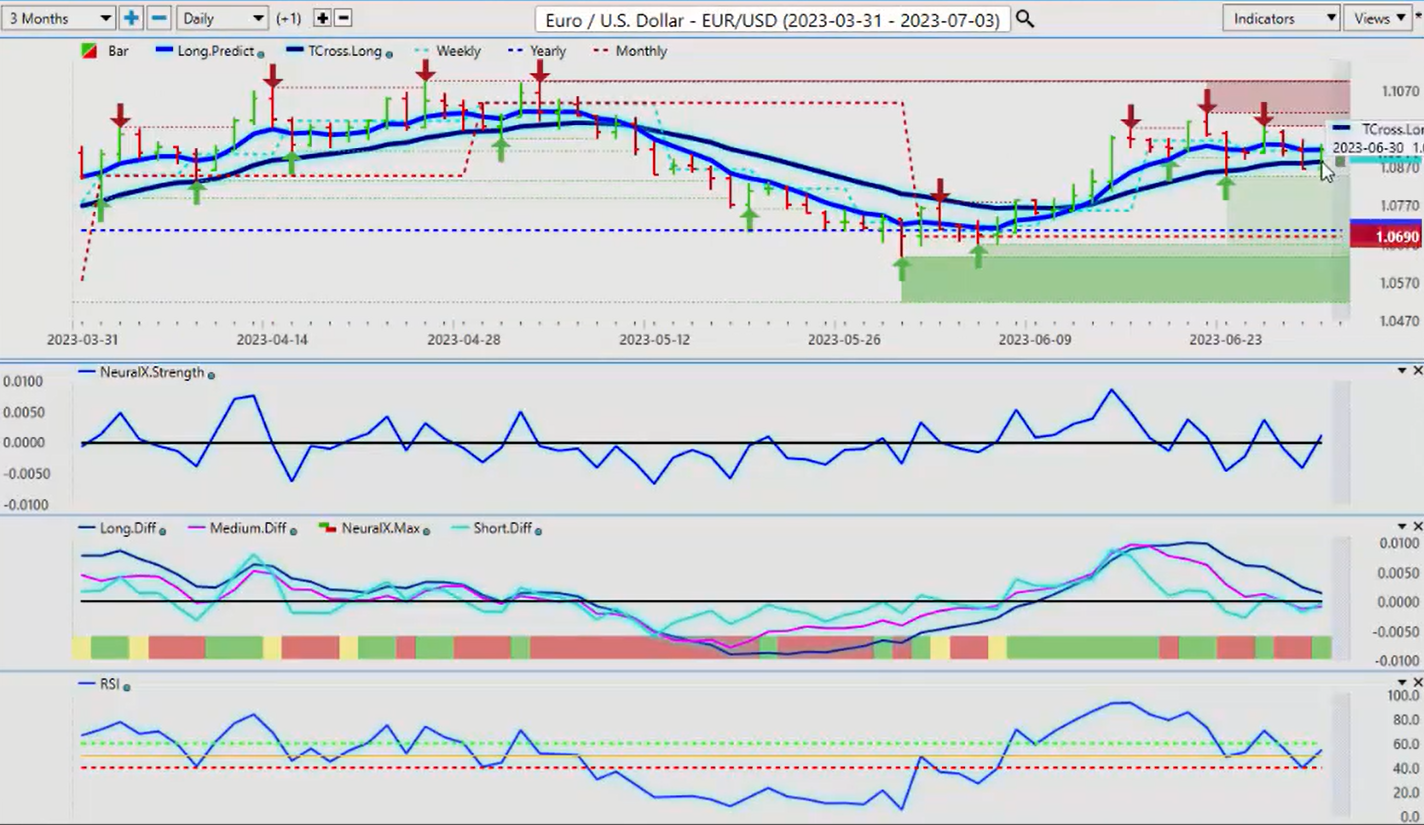
Now, as we start to move into some of our main Forex payers should be an interesting week for the Euro, but I would suspect we’re going to get pressured to the downside just for about a week, a week and a half, then we’re probably going to see the buyers coming back in.
Now, whenever I’ve seen this reverse check mark on the predicted RSI, again, that’s warning that this is not necessarily a new trend down. If we look at our monthly and yearly opening prices here, critical to identify these proper anchor points. Again, if we’re rolling our performance based on the last 30 days and ignoring the start of the day, again, most of your main big funds will put their performance in from the first to the 30th. They don’t necessarily put it in, in the middle of the month. It’s very difficult to gauge seasonal patterns on a monthly or yearly basis with that type of lagging methodologies.
So, again, we want to make sure we’ve got these anchor points down, the yearly, monthly, even the weekly and quarterly opening prices and the point in time, very powerful indicators. So right now, I anticipate with that dollar cycle, some dollar strength here. So I would look for a breakdown below the T cross long at 1.0885. But either way, we’ve got heavy support down here, approximately down here at the monthly 1.0690. I think that’s entirely possible that we could test that next week. Again, the yearly opening price 1.0704, I would like to see the market get as close to that level as possible before I look at picking up additional longs.
U.S. Dollar versus Swiss Franc
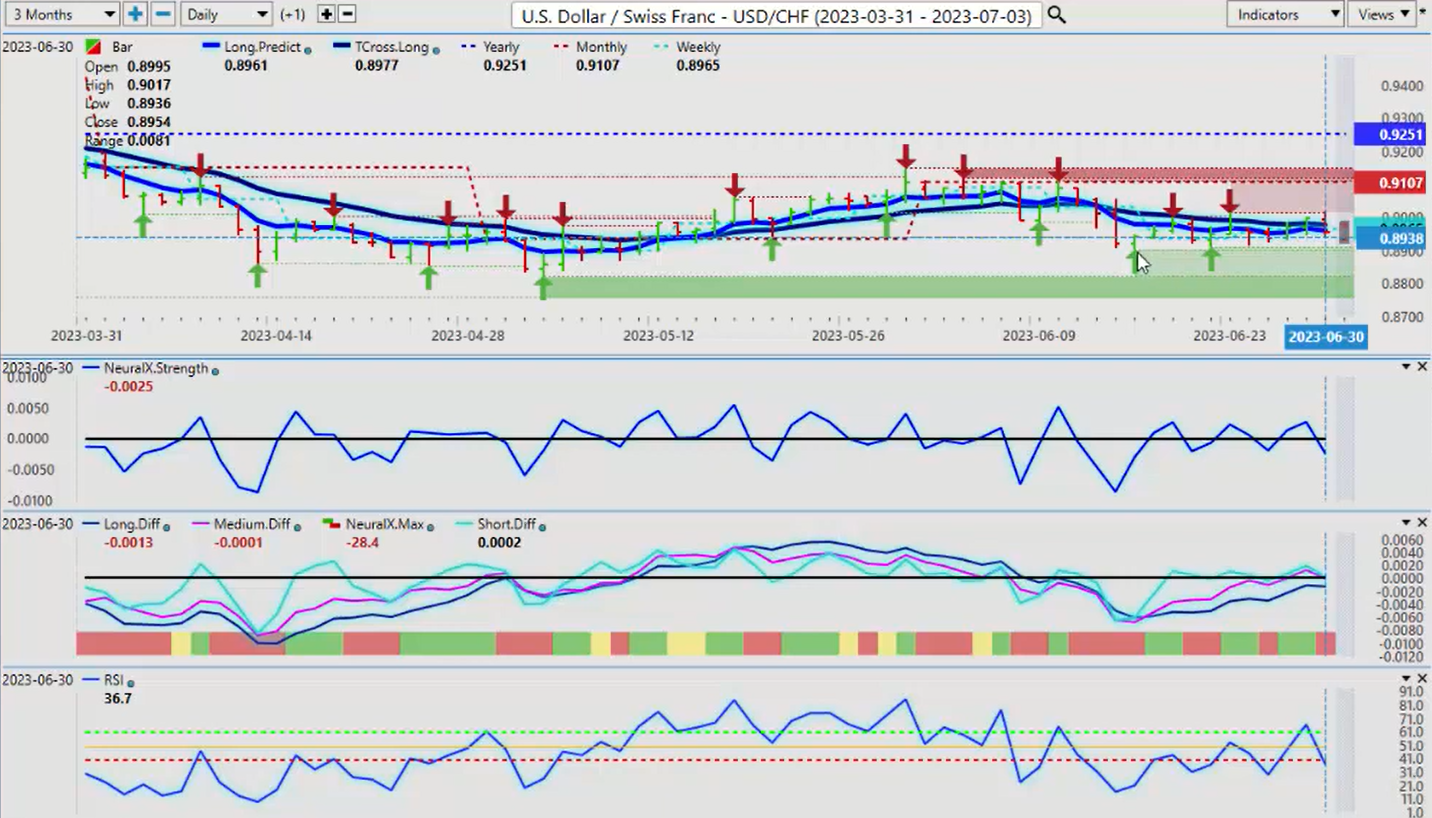
Now with the US-Swiss Franc, again, this could be a pair to buy next week if we’ve got confirmation of that dollar cycle, we’ve got people looking or banks looking for places of value to buy US dollars. This would technically be one of those places, particularly if the Fed sees a strong or his view of a strong labor market. And if that’s the case, then you could see some buying coming in. We have heavy verified support down at the low 8902, but the indicators are not overly positive. Again, you can see that we’re pushing up against that VantagePoint T cross long.
But another way you can play this guys, the T cross long is 8977. We’ve closed at 8954. We can put buy limit orders above the verified zone up here, that verified high 9013. If we can clear that, then we’re likely going to take a run at 9107. There’s a very strong possibility of that, but we need these indicators turning around and confirming that we’re going to get that.
British Pound versus U.S. Dollar
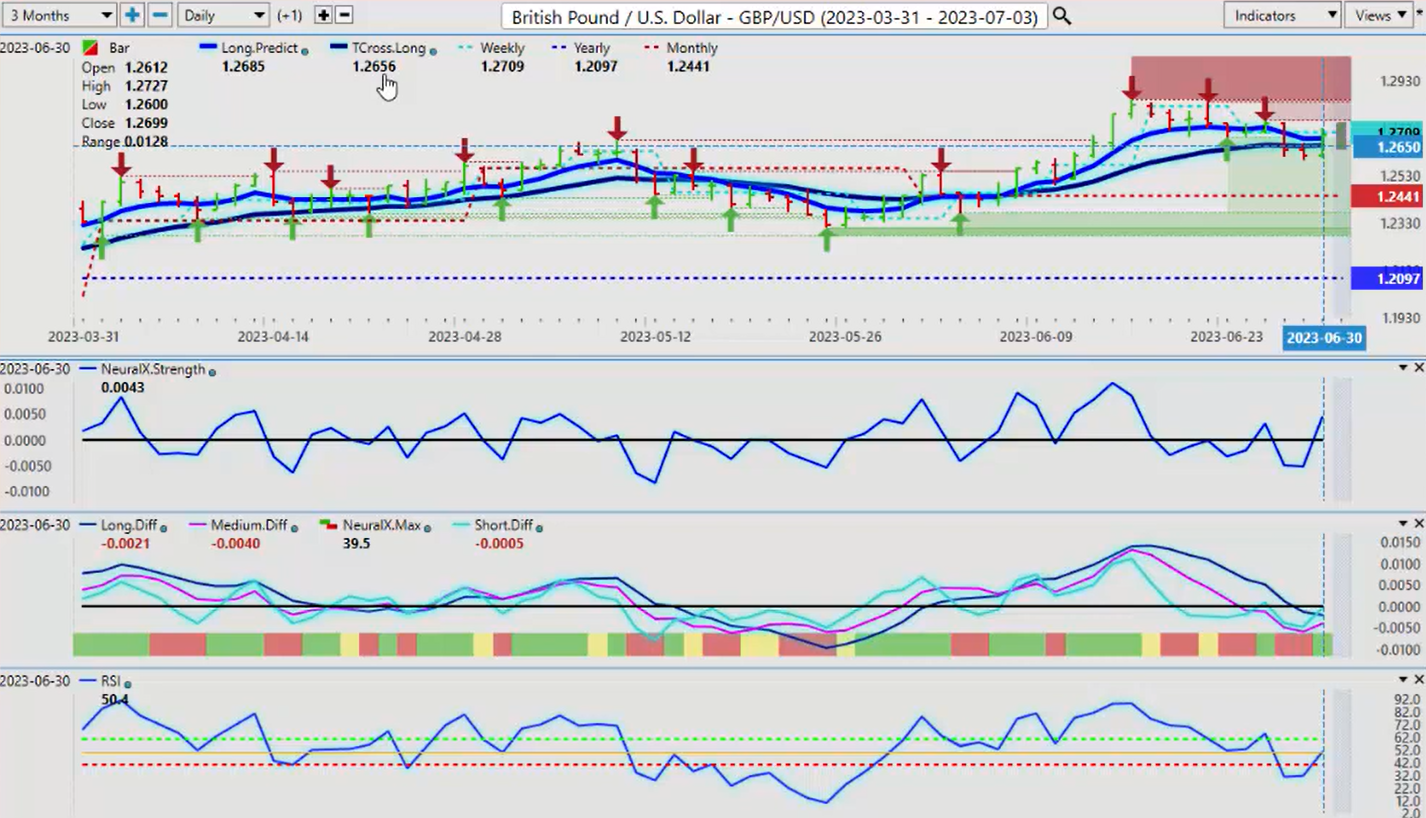
Now the British pound for next week, again, it’s holding, it’s clinging to the T cross long like a life preserver 1.2656, so the 50 point basis hike from the Bank of England that I talked about last week. Not really a positive, is it, for the British pound because, again, I think the market believes that they’ve got it wrong.
Now, the indicators are starting to roll over to the long side but, again, I think it’s premature. But we are moving towards summer trade. If we can hold above our T cross long at 1.2656, you have a long trade. But if we break down below this level, then you want to get shorts on below this level relatively quickly because it warns us that, again, that dollar cycle is predominant and, again, this would be yet another place of value to buy dollars on a temporary basis. But, again, we need the confirmation of those indicators, and I don’t believe we’re going to get that until probably Tuesday night on the update, or Wednesday night maybe even because, again, you’ve got two holidays here, you’ve got Canada and you’ve got the US are out next week.
U.S. Dollar versus Japanese Yen
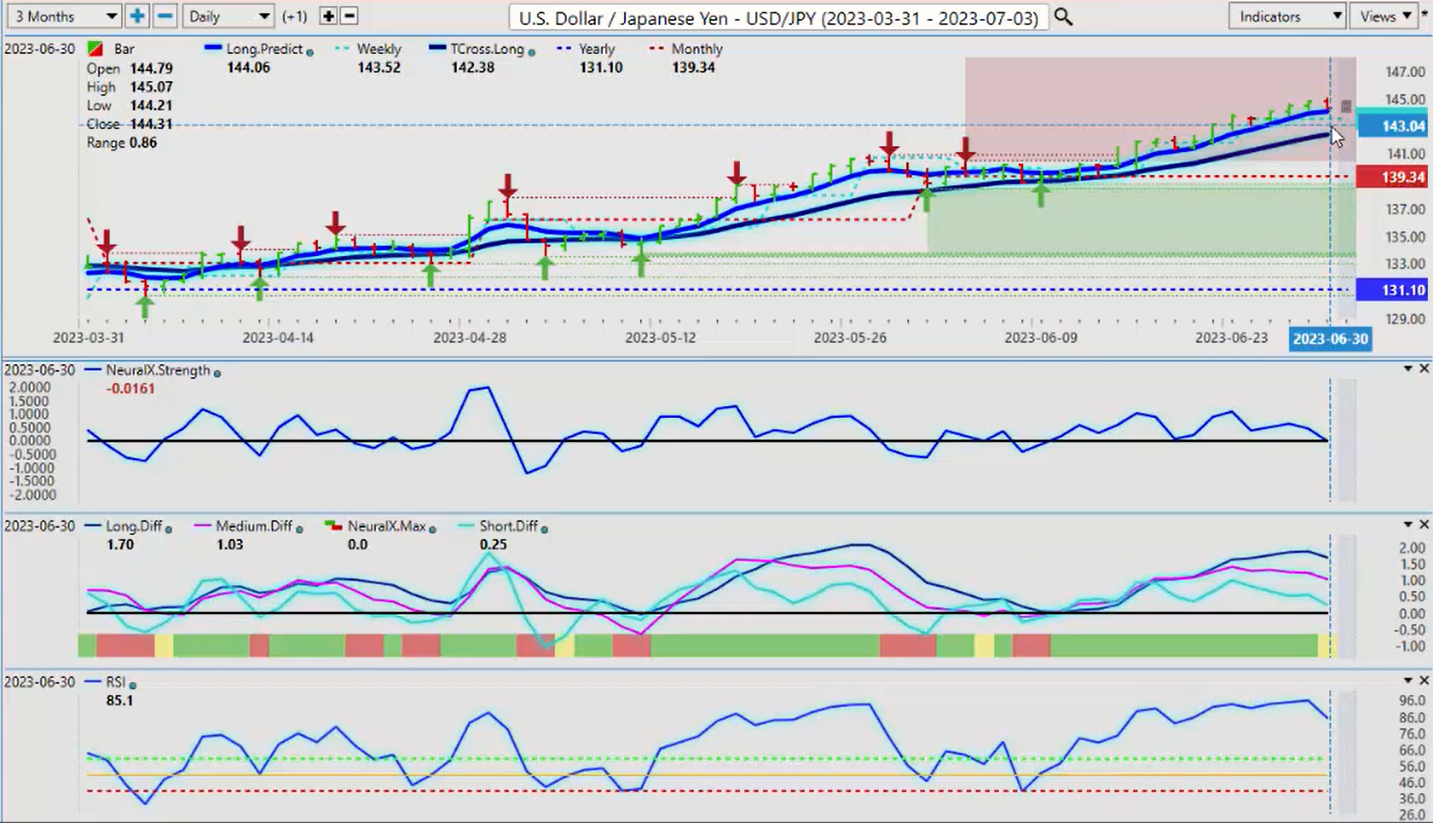
Now, when we look at the US-Japan pair, a lot of rumors of the Bank of Japan intervening, yeah, maybe, but I’m not buying into that theory. They can intervene all they want. That would be a temporary push in the market. But, again, this is a mess that the Bank of Japan created on their own. They basically intervened at the beginning of 2022, and then the Fed goes into a hyperbole interest rate hike so the Bank of Japan got caught off-guard. They should have done nothing, but they verbally intervened. So, again, now if they want their currency to strengthen, that may be very difficult, particularly if the Fed is talking about two more hikes.
So I would anticipate, again, some corrective move lower first, but ultimately, by the end of the week, this pair is probably going higher unless the Bank of Japan intervenes. But in my respectful opinion, whenever I hear this verbiage of intervention, I stay away from any particular pair that would be affected. So that would be anything Japan, Euro-Japan, CAD-Japan, be very, very cautious with that.
U.S. Dollar versus Canadian Dollar
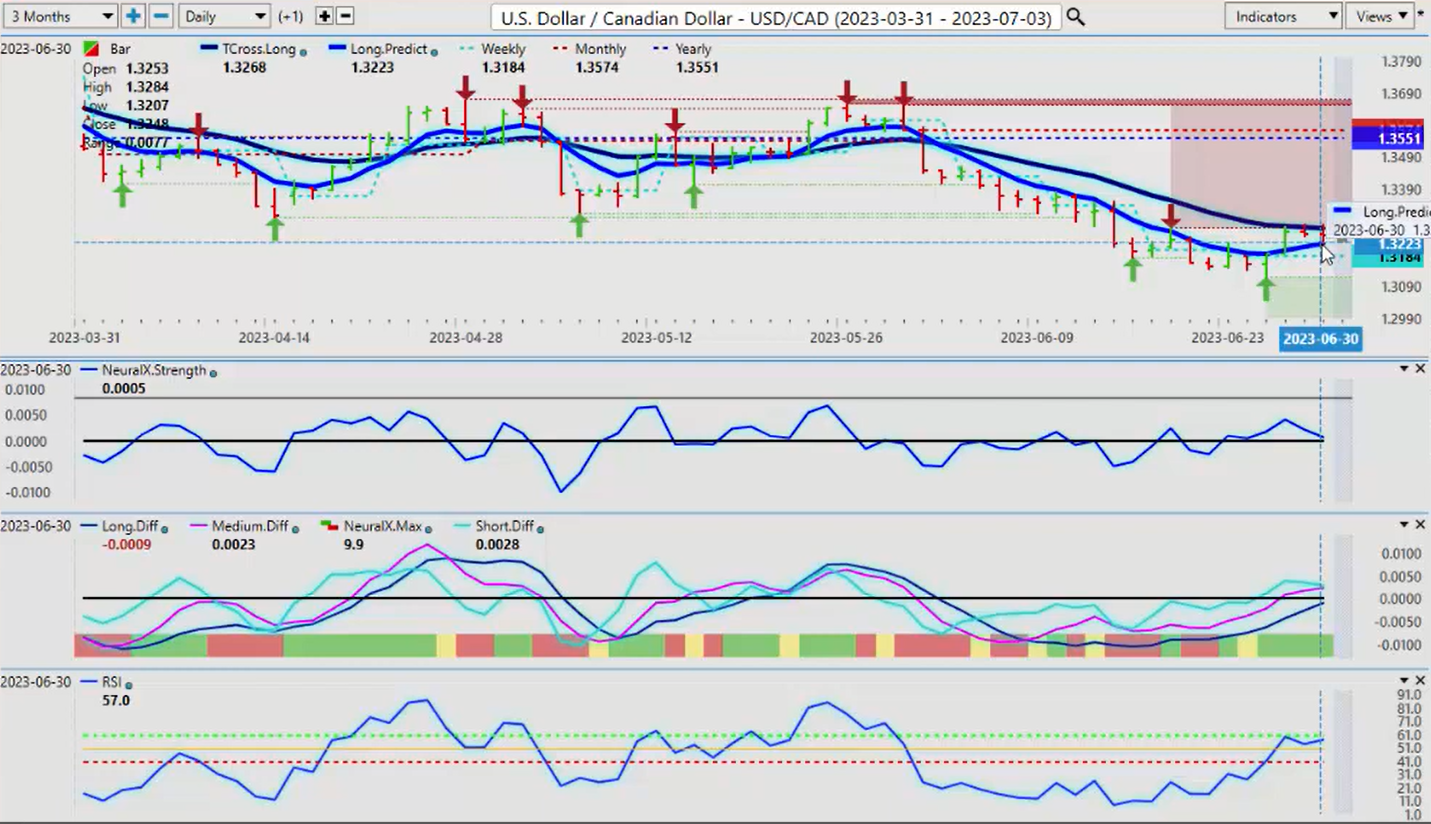
Now, when we look at, again, some of our main equity-based currencies, the US-CAD, when we look at the US-CAD, again, I talked about this last week that, again, in my respectful opinion only, the Bank of Canada got it dead wrong. Now we’ve got further confirmation of that by a lower CPI number last week. The unemployment numbers out of Canada the previous week were terrible. So, again, the Bank of Canada, again, I feel had no reason to hike this, and it caught the market off-guard. So it strengthened the Canadian dollar, but like most of these rate hikes, it’s a buy the rumor, sell the facts.
So right now, you can see three days in a row last week we’re banging into that VantagePoint T cross long, and that’s why I have this on my charts to give me that very powerful pivot point between bullish and bearish. So whether you’re a bull or a bear, guys, there’s enough meat on the bone here for everybody. If you believe that this pair is going long or is still going to go short, then you would sell into the T cross long at 1.3268.
What you can also do is put a buy limit order just above 1.3268, and if that seasonality comes to fruition and we have the dollar cycle next week, then neither one of those bode well for the Canadian dollar. Now the fundamental data out of Canada also is not supporting any further rate hikes here, in my view. And if that seasonality in oil ends, then you, again, have the ability to buy or sell, buy US dollars at a discount against this particular pair.
Australian Dollar versus U.S. Dollar
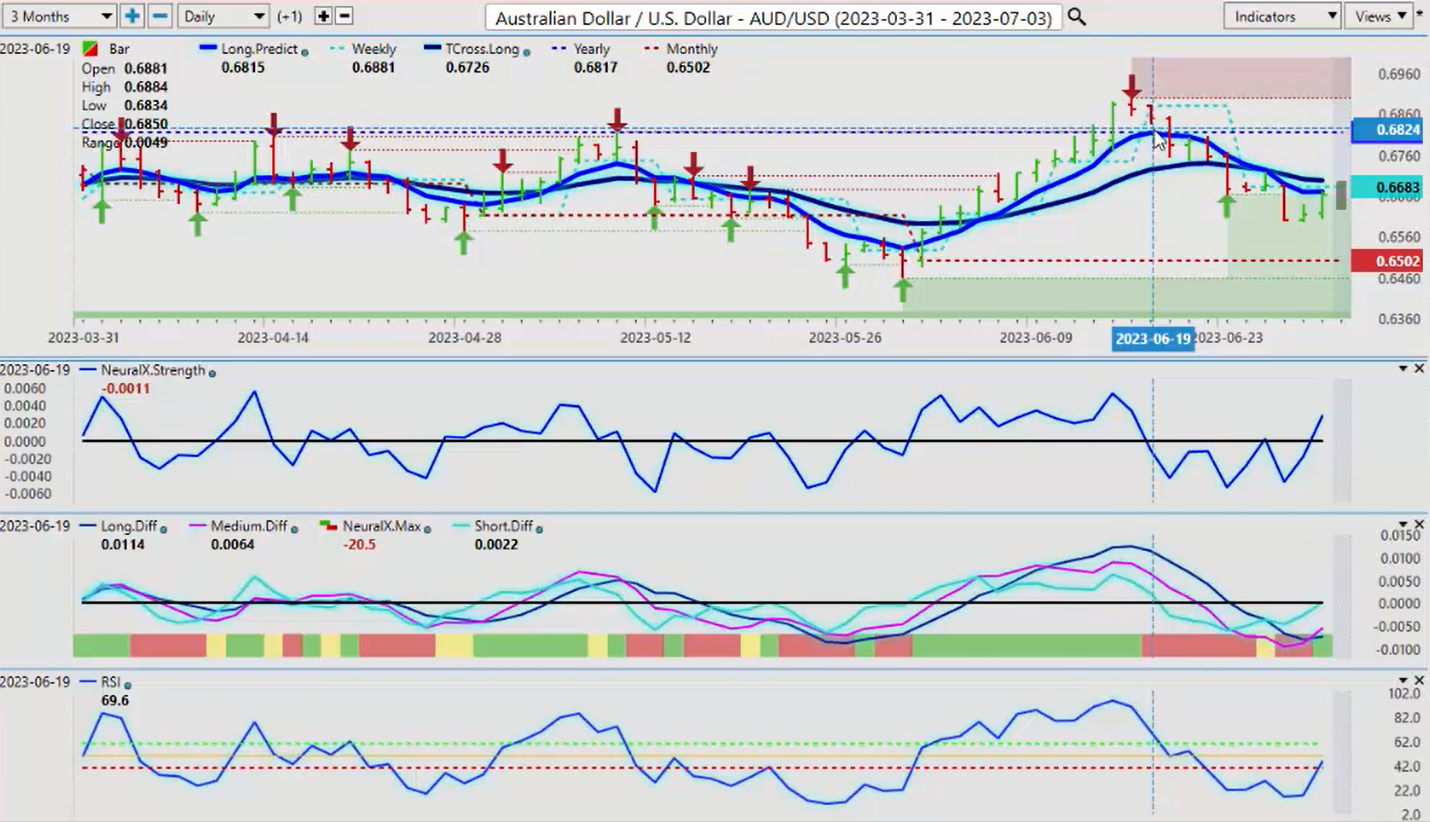
Now, the Aussie and the New Zealand, they’re a little bit different. Again, I had talked about this the previous week and said, okay, this is why we do not use rolling performance. We use hard coded numbers, yearly opening price, monthly opening price. So this area up here of the yearly opening price, the Aussie was unable to hold above this, and as it started slipping down below there and it crossed under the VantagePoint long predicted, I simply have sell limit orders sitting there ready to go, and then we have a complete and utter collapse.
But again, there is nothing up here, guys. There’s no silly wave theories. There’s no a Fibonacci. There’s nothing up here. There’s just this lowly yearly opening price sitting there, which is defining whether we’re positive or negative on the year. So if the Aussie is falling like this, it begs the question, why is the stock market rallying? Is this a bear market rally in the S&P 500? This is something we do need to take into consideration.
Now, we can see pretty heavy support right there at the low 6597, but we’re likely going to get one more push down before we start turning higher. But again, we’ve got the RBA next week. It’ll be interesting to see what they’re going to do after their last surprise rate hike. So again, a lot going on next week, be very, very cautious.
New Zealand Dollar versus U.S. Dollar
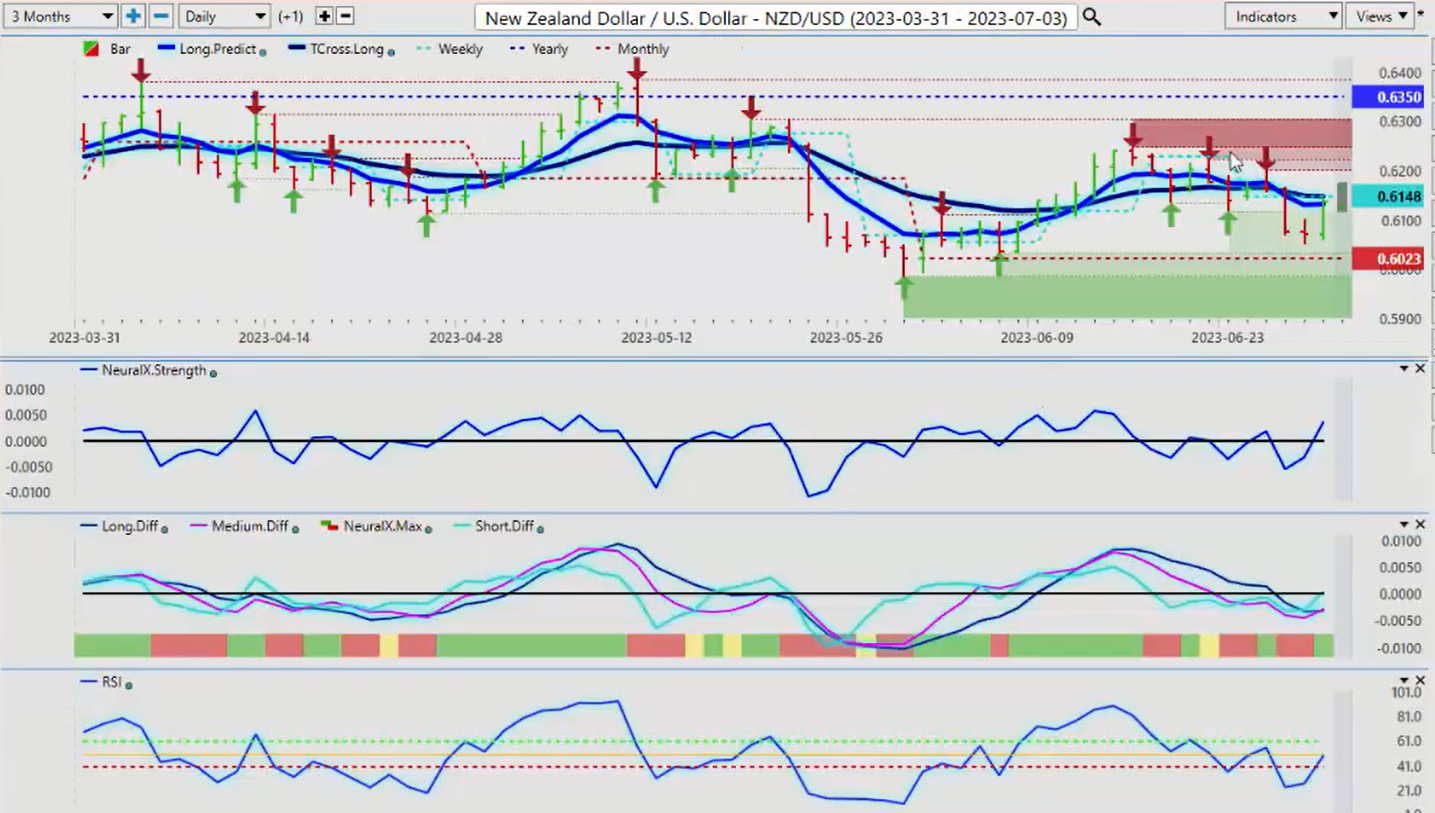
The same would apply to the Kiwi. The Kiwi didn’t fare very well for the bulk of the week, only on Friday. So by the looks of it, this is just profit-taking and, again, we stopped right on the T cross long, 6148 which, again, strongly questions whether this equity rally is real or not. So, again, we’ll monitor it over the next few weeks, but whether the market goes up or down, we will always be able to find opportunity.
So with that said, this is the VantagePoint AI Market Outlook for the week of July 3, 2023.