-
View Larger Image
Welcome to the Artificial Intelligence Outlook for Forex trading.
VIDEO TRANSCRIPT
Hello everyone, and welcome back. My name is Greg Firman, and this is the VantagePoint AI Market Outlook for the week of June the 26th, 2023.
SPDR SPY ETF ($SPY)
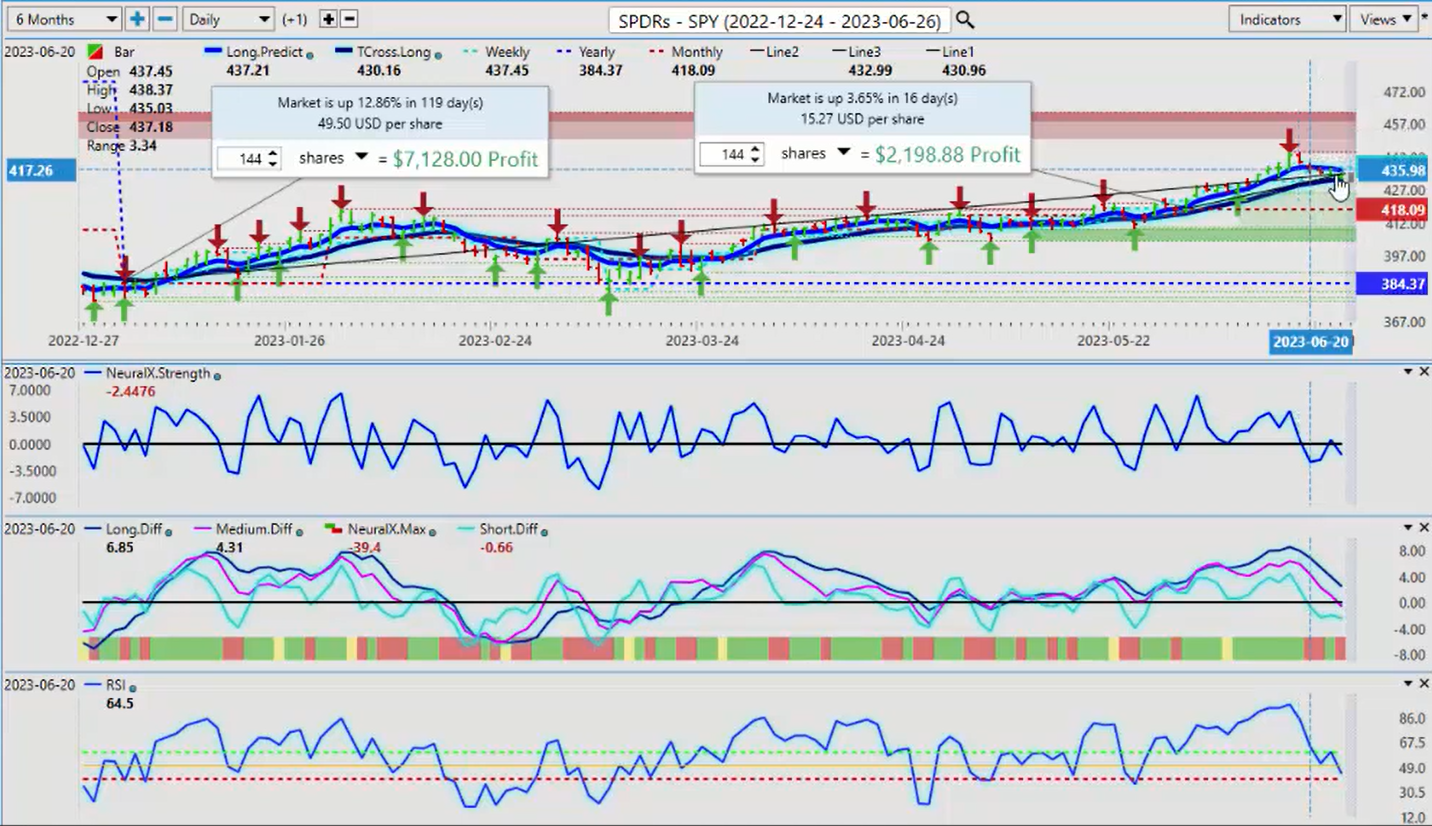
Now to get started this week, we’ll do a quick recap of the market conditions and accurate view of where we are in the year and then the month. We can see that the SPY is, S&P 500 up about 12.86% on the year. Once again, very important that we’re using accurate anchor points to get these percentages, not using lagging performance, rolling performance models because they can be very problematic here. Because when we look closer at the SPYs here, we can see for the month of June, we’re actually only up 3.65%. And as per last week’s weekly outlook, we can see that we have a top forming up here on the SPYs and on the S&P 500 within, and again, a holiday short week.
But on Tuesday we can see that we slip below the weekly opening price and we start moving lower. Now, one of the questions I did get last week was, do I use the neural index strength? And my answer to that is a very strong yes. And here’s another trick that you guys can look for in the software is that the slope of this tool is very, very important. Because as we can see, the neural index is green, but the neural index strength is actually pointing down. Then we come into a holiday Monday trading and we remain green in the neural index, but the neural index strength continues to drop. So then by the 20th we can see that we’re moving consistently lower for the remainder of the week. Now our TCross.Long coming in at 431.63. And again, as per last week’s weekly outlook the direct inverse correlation that we’re watching here is the dollar index.
So if this is going down, the SPYs are going down, as per last week’s weekly outlook.
U.S. Dollar Index
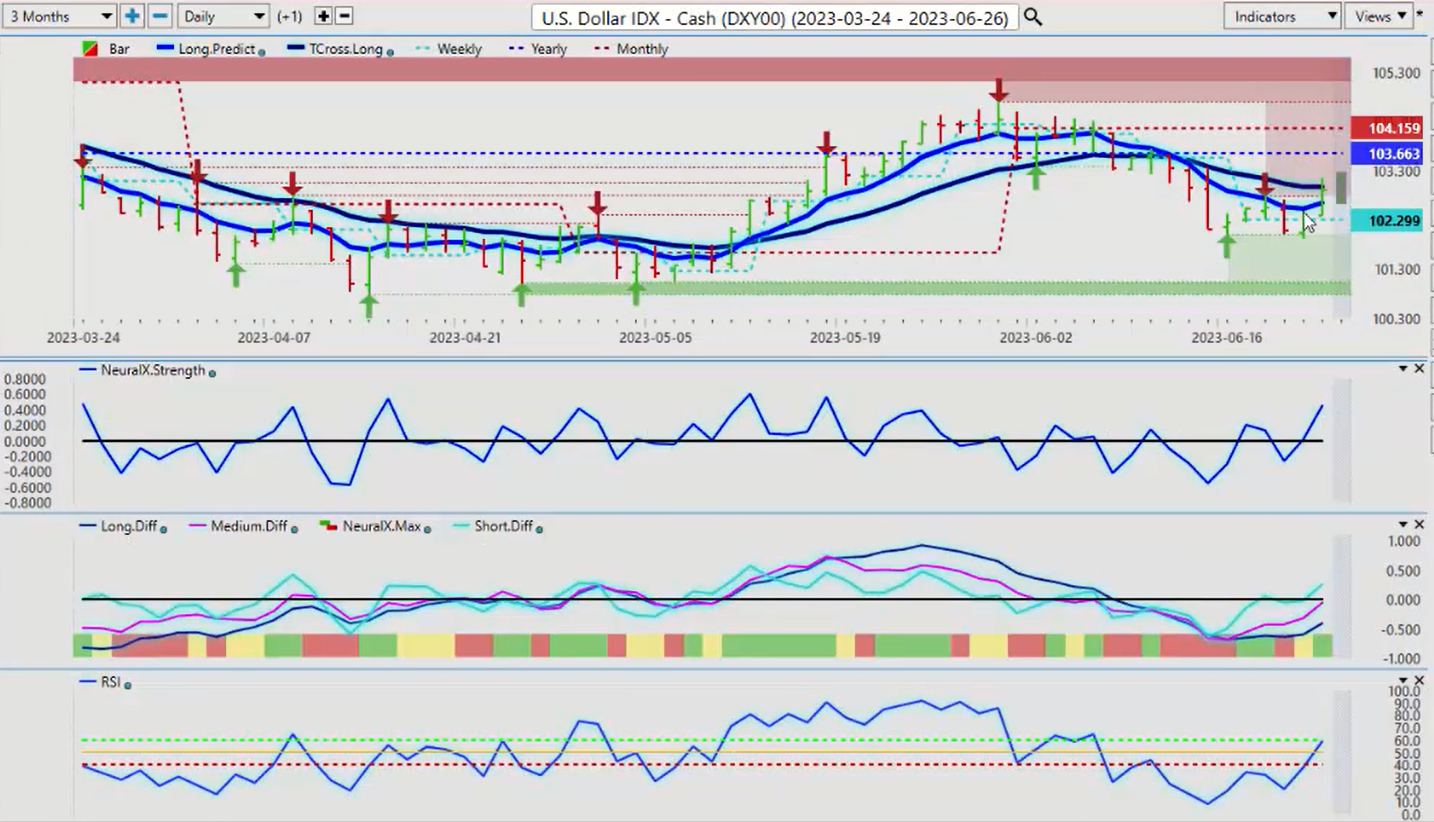
We anticipated dollar strength by the end of this past week, which we’re seeing now. So again, very important that we’re looking at all of the tools and bringing them in. Because as we can clearly assess here without too much issue is that we have a verified support low that formed on or about June the 16th. And the dollar has been rising ever since. But you can see that Thursday and Friday of last week, the dollar starts moving towards that again, that dollar cycle that I’ve talked about. Buying dollars at the end of the month into the first week of the new month. If we look at the neural index strength, we can see again, the slope of this is very important because the neural index itself is down, but when we look closer at it, we got a yellow signal, a warning signal on here.
But by Friday, as per last week’s weekly outlook, this strength is somewhat predictable at the end of the month. Because real money needs to buy dollars. They may not want to, but they have to, to settle trade balances, to settle government employees, old age security, there’s a large requirement. Again, currencies are very different than stocks guys. People must buy currency. Nobody is required to buy a stock, and that’s the easiest way to say it. Now the dollar is coming up against significant resistance. The TCross.Long, 102.96. I do anticipate that this level will be breached next week or the following week because again, it’s that period of known dollar strength. This is probably the final one until September. We get a little bit in August, but August is basically a very, very slow month. But July is still pretty good. So the bias here for next week again would still be the dollar to move higher in that period of strength.
Now, we can’t rule out a failure, but the overall indicators, predicted RSI 59. We’re looking to build on momentum here, but our MA diff cross, highly accurate, the medium term against the long term predicted difference, we can see that that’s led to this move up. But again, we need to get moving here to say the least. I anticipate the dollar is going to open up around 102.90. So it’s got its work cut out for it next week. Just be careful, as we’ve discussed in the VantagePoint live training room, that Monday, Tuesday reversal. Never count on Monday being a true price.
By the mid to end day Tuesday, you start to see the real price. And I would anticipate, again, the dollar coming into some strength by again, the Tuesday, Wednesday, Thursday of next week. But this Fed, very, very confused as to whether he is hiking, whether he is not, but he’s trying to put his foot down and he is saying, higher for longer and he plans on hiking at least two more times this year.
So that’s not exactly going to be bearish for the dollar, but I don’t think it’s bullish either because we need to get out of this lagging data that the Fed is using, and see what the real inflation is here. But again, I think his 2% price target is completely unrealistic because of COVID and all the outside things that have occurred. So we’ll watch that level very closely.
Gold
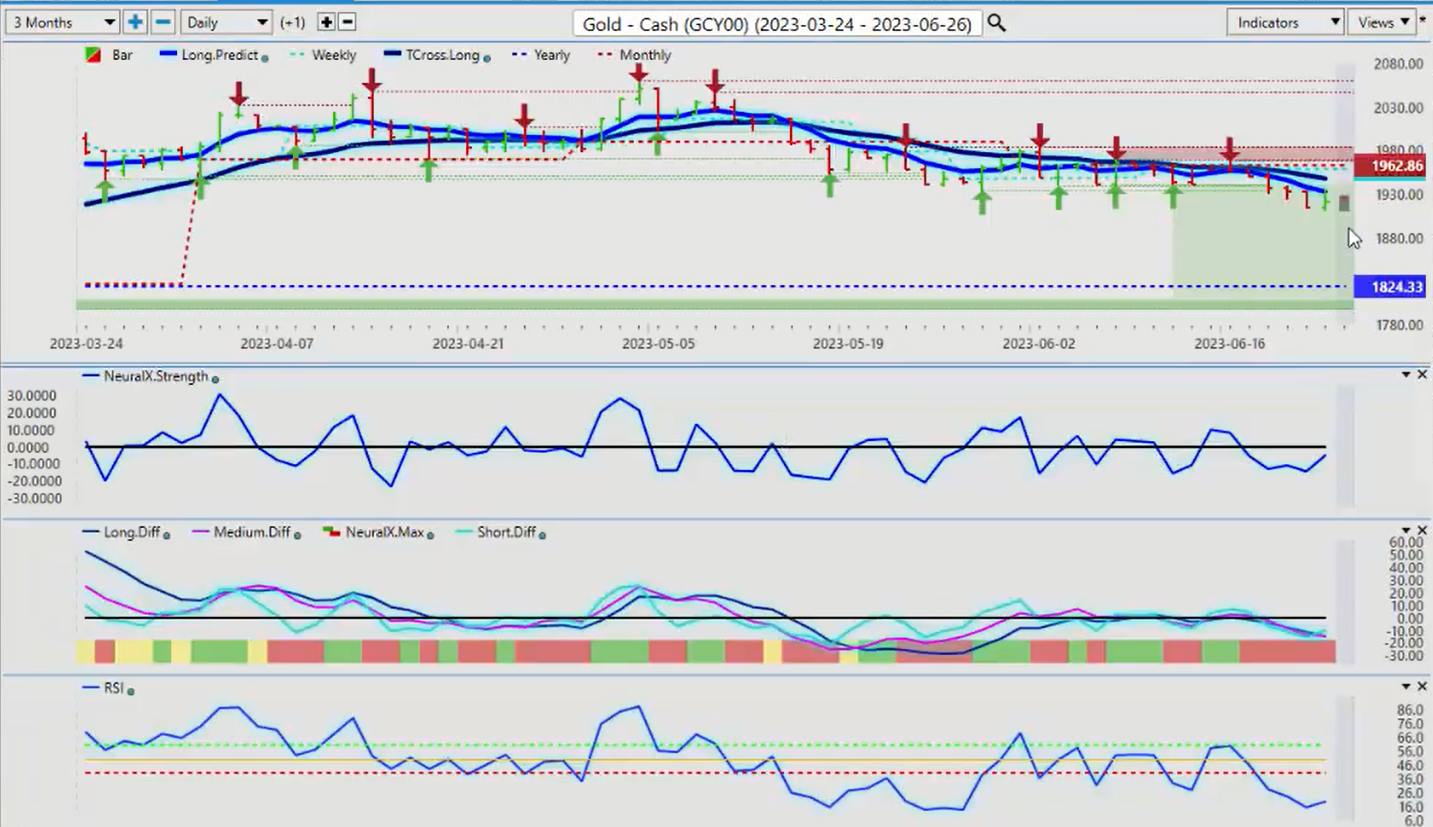
Now with gold prices, again, in my respectful opinion only, there’s an 80% probability of a global recession. And that usually favors gold buyers. So again, we will watch this very closely, but again, the dollar and gold can rise together. I’ve seen it many times, especially in a situation like this.
But for now, the indicators are somewhat bearish. But I’ll again point to the difference between the neural index and the neural index strength. This upward slope of this neural index strength, again, in my opinion, is often a warning sign, that if nothing else, we may see a retracement. So that retracement would be back to our TCross.Long coming in at or about 1947. So again, somewhat of a bearish week for gold.
But again, we can see this once again using that neural index strength, you can see that there’s actually two very, very different signals here. You’re green on the neural index, but the neural index strength and the slope of that is actually pointing down. And that led to a fairly significant downward move on gold last week. So again, I fully support the use of the neural index strength and especially when we combine it with the additional VantagePoint indicators. So when we look closer at this with gold, our predicted differences are dropping. Our neural index is unable to break the 60 level, 59.6. Now a 60:40 split on the predicted RSI and then using a nine period basically speeds the indicator up a little bit. But more specifically, I’m looking for strength or momentum in the market, not an overbought or oversold, guys.
I would argue that’s not the best way to trade these current markets. They’re momentum based. So I’m lacking the momentum here. I’m not getting above the TCross.Long. The neural index strength is sloping down, ultimately breaks below the zero line, and that led to a pretty strong move to the downside in gold, if we just look at that briefly as to where we finished the week here. That’s highly, highly accurate, in my respectful opinion.
2% is still 2%, guys. But again, be careful with this one next week. I still think that gold and the dollar are capable of rising together.
S&P 500 Index
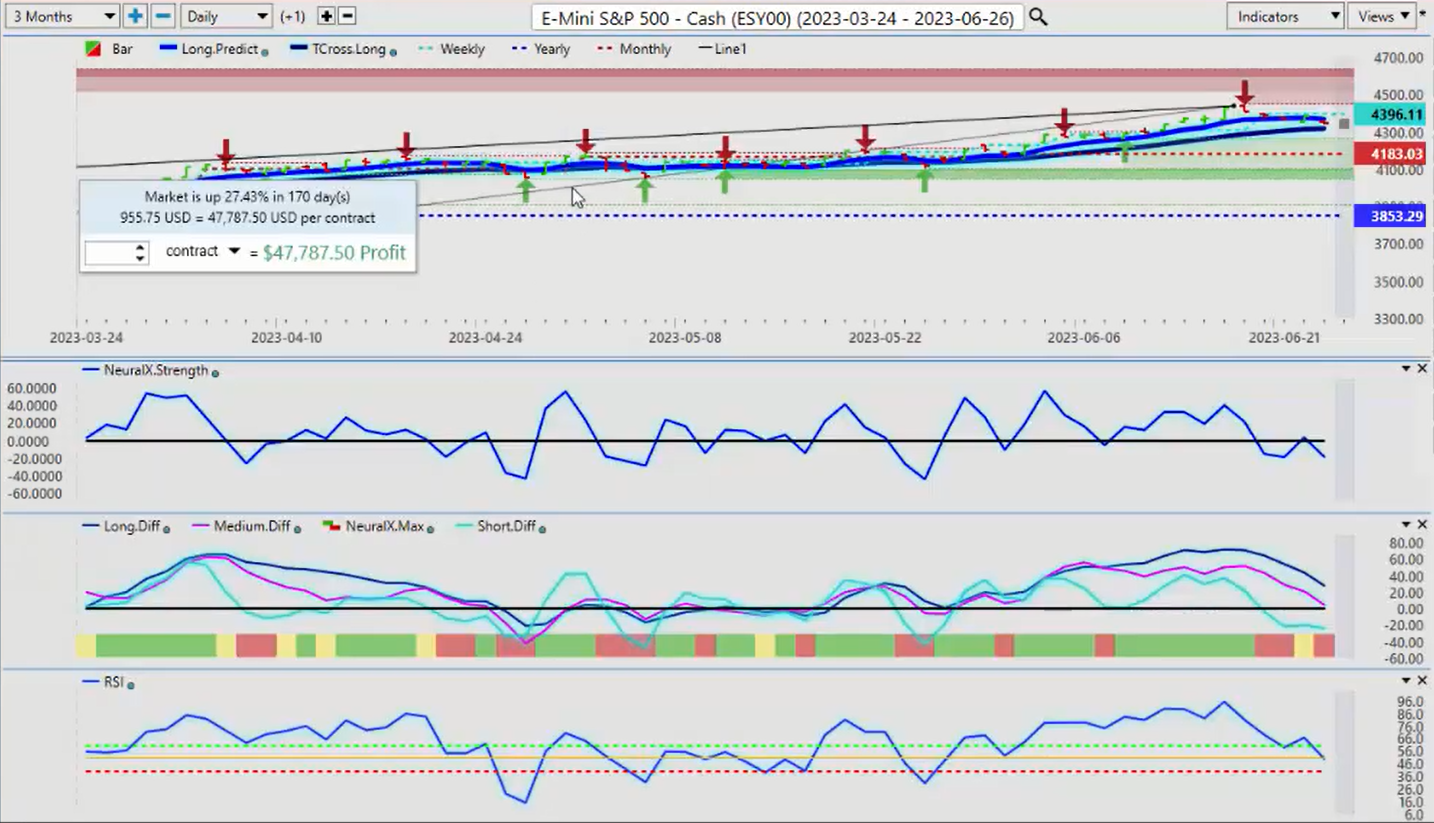
The S&P 500 mirrors the SPYs. I still have things up there from last week. Let me pull that off. So again, when we look at this closer, it is basically the same trade. So our main support for our stocks next week are coming in at 4319, but I could anticipate in the days and weeks ahead that we retest the 4183 because again, this period of known dollar strength, whenever the dollar rises, most of your other markets go lower except for one I’m going to talk about here in a minute.
But again, this would imply more downward pressure on stocks, at least for the next week and a half or two. So if you get a mysterious stock rally tomorrow, on Monday, then that may be a good selling opportunity because these indicators, our predicted differences are sloping and pointing down, the predicted RSI, 49.9, we’re losing our upward momentum. And again, that neural index strength is pointing straight down. So again, at the very least here guys, I anticipate a test of the TCross.Long at 4319 with a close of 4348.
Crude Oil
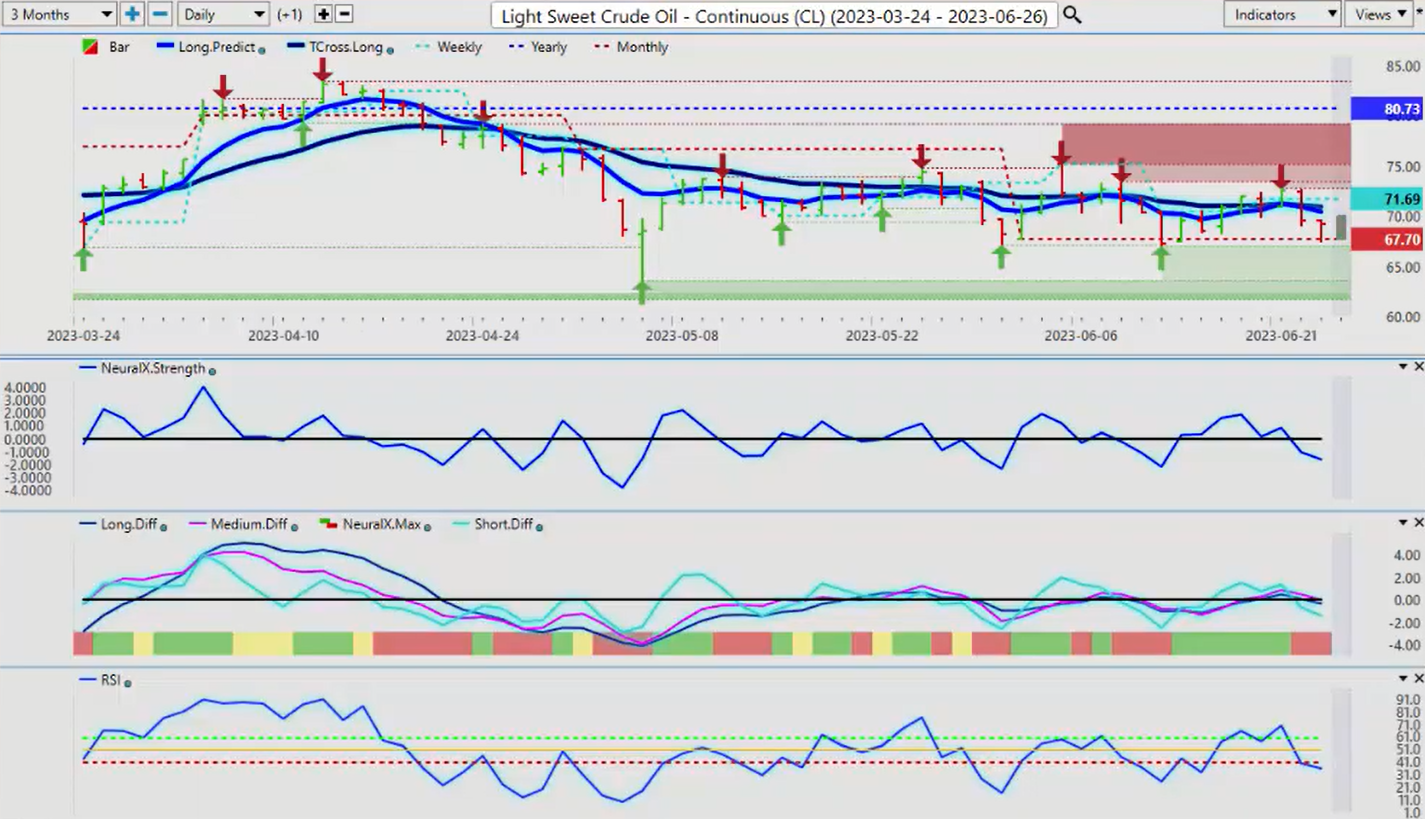
Now oil often… I think it’s a pretty well known seasonality in oil here. And usually oil starts its decline early to mid-July, but oil has really kind of struggled the better part of this year. When we look at this over a six month period, again, a lot of sellers camped out around that yearly opening price.
And that’s why, again guys, why it’s so important to use proper anchor points in your measurements. You don’t want to go back into the previous year other than looking at seasonalities.
When we’re looking at actual true performance oil has not done well this year at all. It’s really struggled the better part of this. So again, when you briefly look at this, you can see that again, they’re just selling. Anytime it gets positive on the year they’re using that to set shorts. But now we’re coming to the end of that seasonal period, so it’ll be an interesting month for July. And again, if there’s more recession fears, that doesn’t bode well for stocks or for oil. But our key level for next week, again, our monthly opening price, 67.70, which I had briefly discussed last week, that we are likely going to come down and test this area soon.
But if we break down below the monthly opening price, that just confirms that we’re a matter of days of this seasonality kicking in and a deeper move lower on oil is likely. Our indicators are confirming that right now. Neural index strength, predicted RSI is building momentum here. I find that one very interesting here. So if we can get down below this particular area, then there is room still for oil to go lower.
Bitcoin
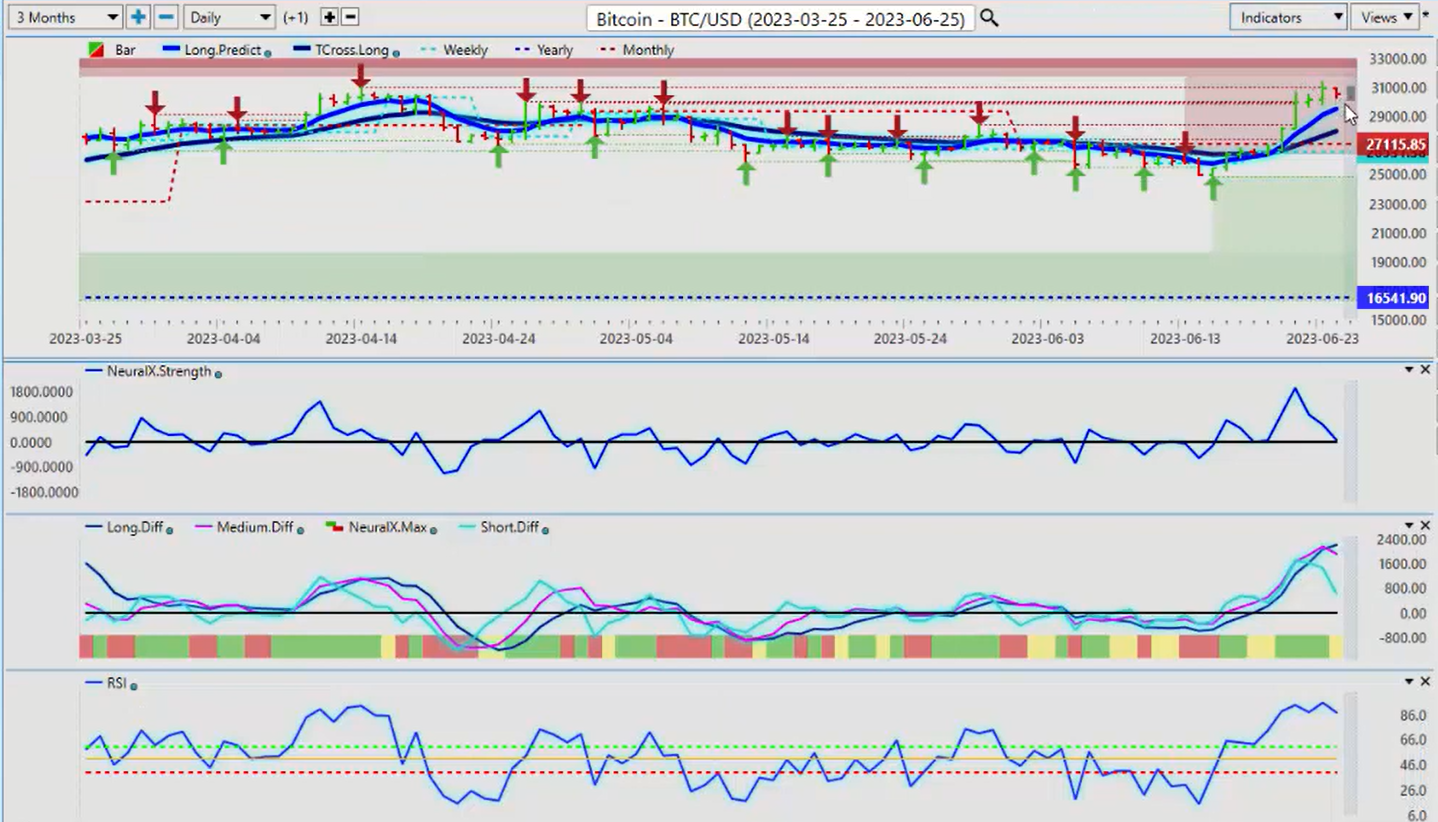
Now, the shining light in last week’s trading again remains with that market that they continue to tell us not to buy, and it is somewhat comical. In the VantagePoint live trading room, we actually talked about this a month ago, that Bitcoin would likely rise at the end of June and the beginning of July when it starts its normal seasonal pattern. But again, a little bit early, but a heck of a move just the same.
So we can see our support down here building right along that VantagePoint TCross.Long, 26,371. I’ve been talking about these areas for the last several weeks, but again, the lower end of this channel clearly holding. And again, this is something I had talked about over a year ago where I’m looking for Bitcoin to move away from its correlation to equities. Then it positively correlated to gold. And now again, Bitcoin appears to be standing on its own two feet here, but I will concede, we are very close to that seasonal pattern starting. Which is usually around mid-July, and then it kind of goes sideways for the summer, obviously. But then mid to late September to mid to late October, you get a big push, usually the final push. But right now, again, a lot of money still moving into Bitcoin. We’re closing out the week here very, very strong.
But we’ve got to keep this momentum moving. If we look at this over a six month period, you can see there’s a very dark cloud hanging over this. So we just need to push through here and to get things moving. But I do anticipate Bitcoin will still hold its ground at least until mid October.
Euro versus U.S. Dollar
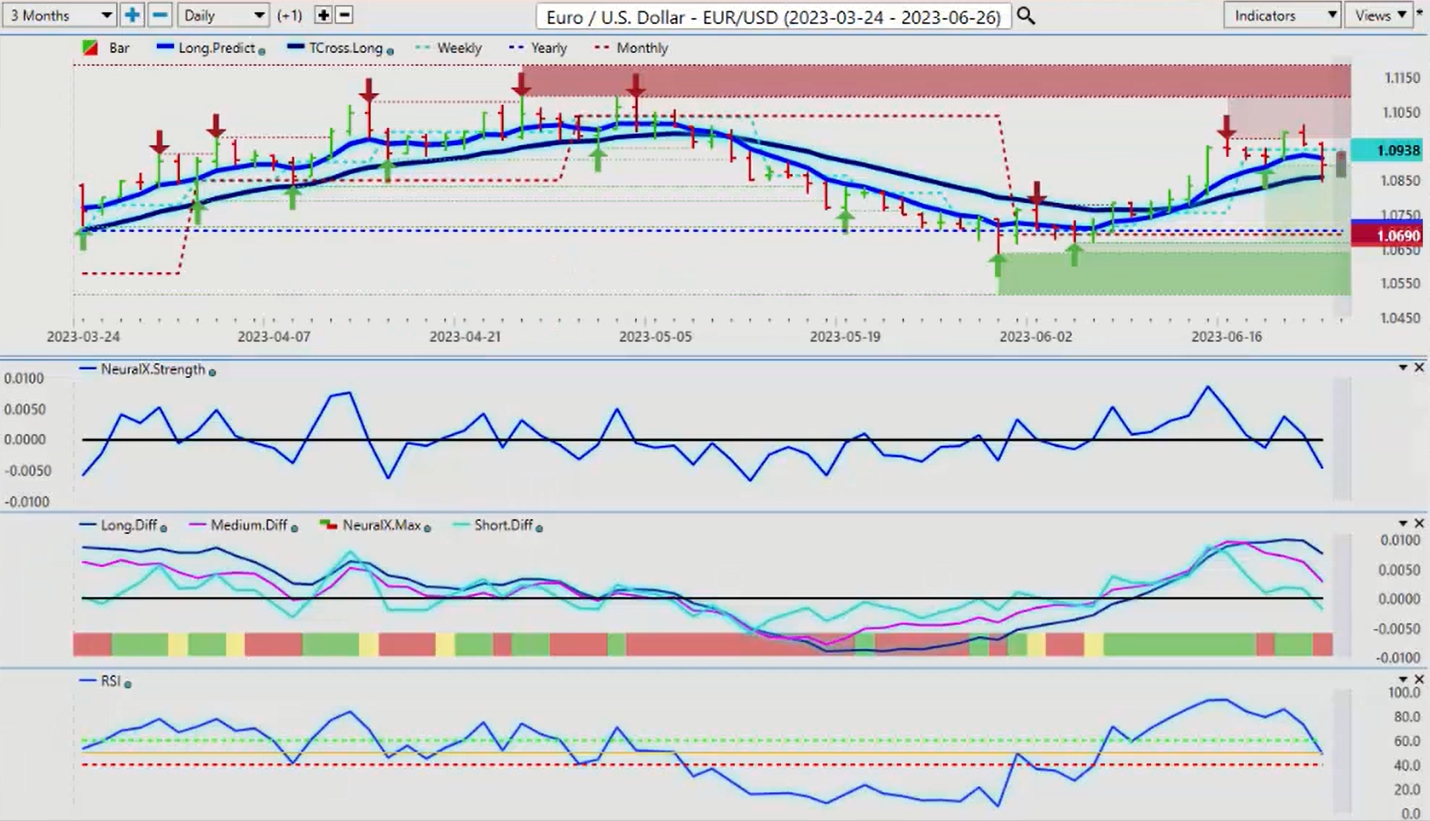
Now, as we look at some of our main forex pair, the EUR/USD is under pressure, obviously with the anticipated dollar strength as we discussed in last week’s weekly outlook because again, this is an outlook, not a recap of something that already happened, guys. So we’re looking outwardly for our next week, our key levels. So our VantagePoint TCross.Long on EUR/USD, again, my view is that the euro is likely to ultimately go higher into the end of the year, but for now we’re coming into that period of dollar strength.
So our TCross.Long, 1.0860, but I would anticipate the possibility of moving towards the yearly opening price and the monthly opening price down here around 1.07, before we’re done with probably the final bout of dollar strength before September. September is still a good month for the dollar, don’t get me wrong. But for now. Again, it’s a timeframe based where each month you get this unusual strength in the dollar for real money demand. But we can track when the institutions are buying it, and like I said, that dollar strength usually lasts until the Tuesday, Wednesday after the non-farm payroll, much like we discussed this month. And the same thing came to fruition. So for now, we’ll keep a very close eye, TCross.Long, 1.0868. But either way, we would be buyers back down towards the yearly opening price. But the indicators are clearly warning of dollar strength.
Our MA diff cross, our neural index strength, falling predicted RSI. And the neural index and the neural index strength are in complete agreement that this is going lower.
U.S. Dollar versus Swiss Franc
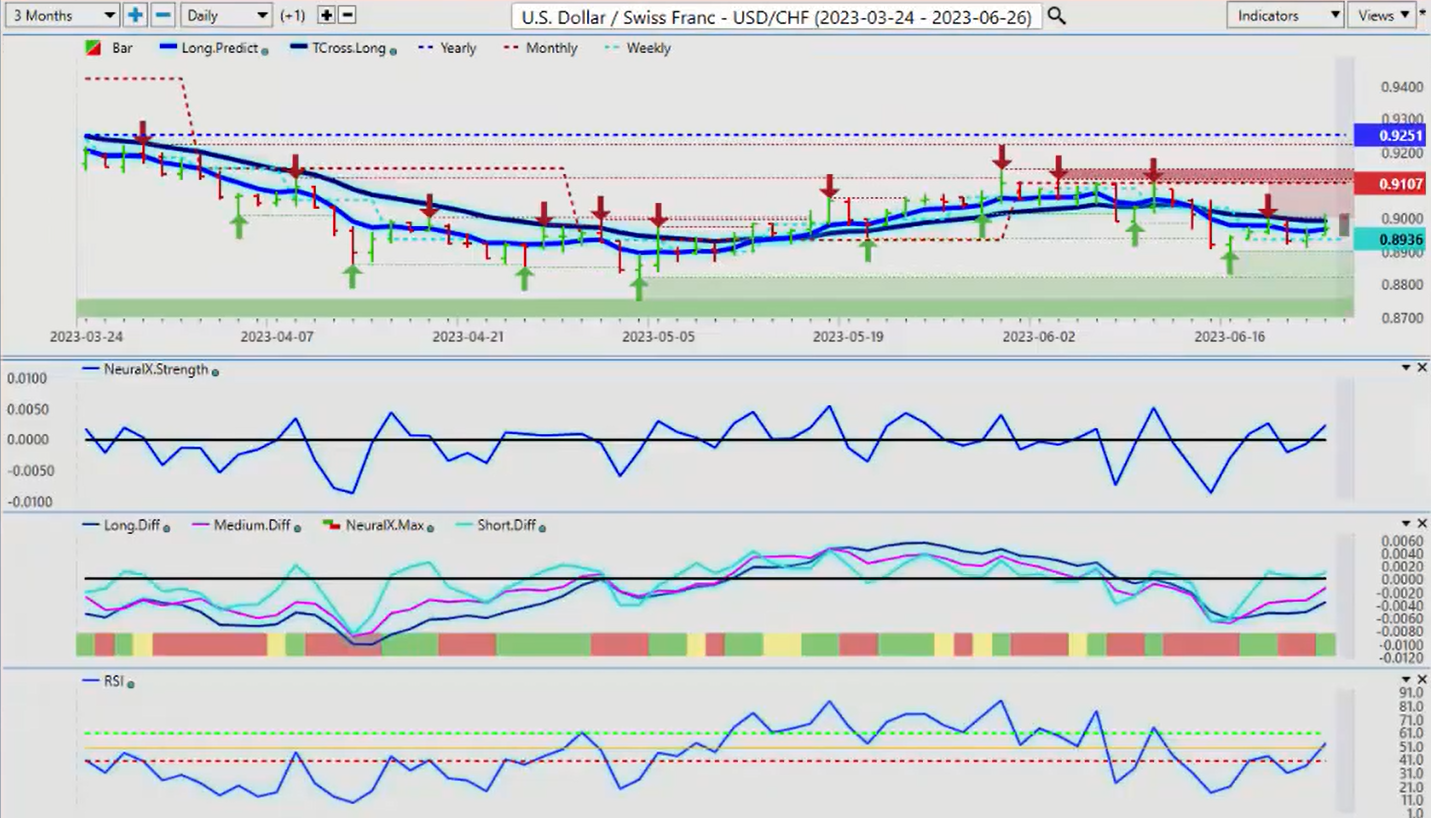
Now, USD/CHF could be a place to buy dollars next week, in the coming week, about a week and a half, two weeks, we’ll have about a week and a half of dollar strength approximately. But first, we need to break through the TCross.Long which is coming in at 0.8992. We get through that, that opens the door up to a bigger corrective move to the monthly opening price at 0.9107. The indicators support that at the current time, neural index, neural index strength, predictive difference cross and a rising RSI above 50. If the RSI can break through 60, then we will get that bigger push towards 0.91 that we would be looking for.
But again, this would be a short term move, guys. It’s not a long term play on dollar strength.
British Pound versus U.S. Dollar
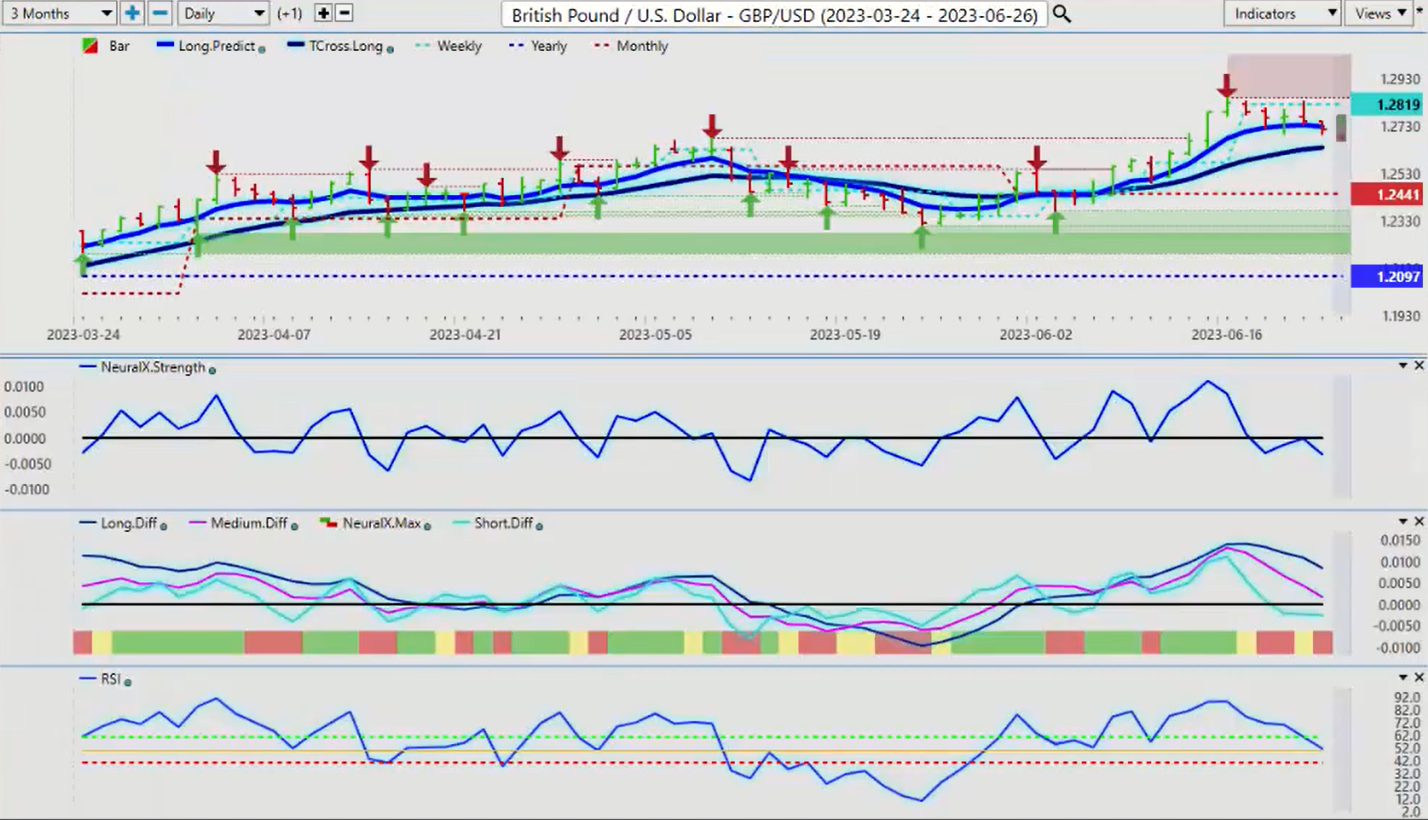
Now, the British pound, once again, getting very toppy up here. And you can see that dollar strength coming in right at the beginning of the week. Again holiday Monday, but then Tuesday, Wednesday, Thursday, Friday, we’re simply unable to push above the weekly opening price. The weekly opening price, looking at that each week will help guide you. It will help confirm whether you should be on the long or short side of this, regardless of what the indicators say. If this is truly bullish, then we would be able to hold above the weekly opening price. It’s a very simplistic approach to it. And then we layer our indicators in. So in this particular case, I’m looking at this on Tuesday and saying, okay, I’m on Tuesday. I’m not getting above the weekly opening price.
And again, a falling neural index strength while the neural index is green. So again, what we look for here, guys, is a situation more like this. Where our neural index strength has retraced to the zero line pointing straight down. Our predicted differences are pointing down, the neural index is in agreement, and we have a falling predicted RSI. This points towards, if nothing else, a test of the TCross.Long at 1.2637. That’s where we draw our line in the sand. We get below it, then we’re likely moving towards the monthly opening price. But again, we need to break down below that. So if you’re looking to continue to stay long on the GBP/USD next week, then you want that trade confirmed by holding above the TCross.Long and the weekly opening price.
U.S. Dollar versus Japanese Yen
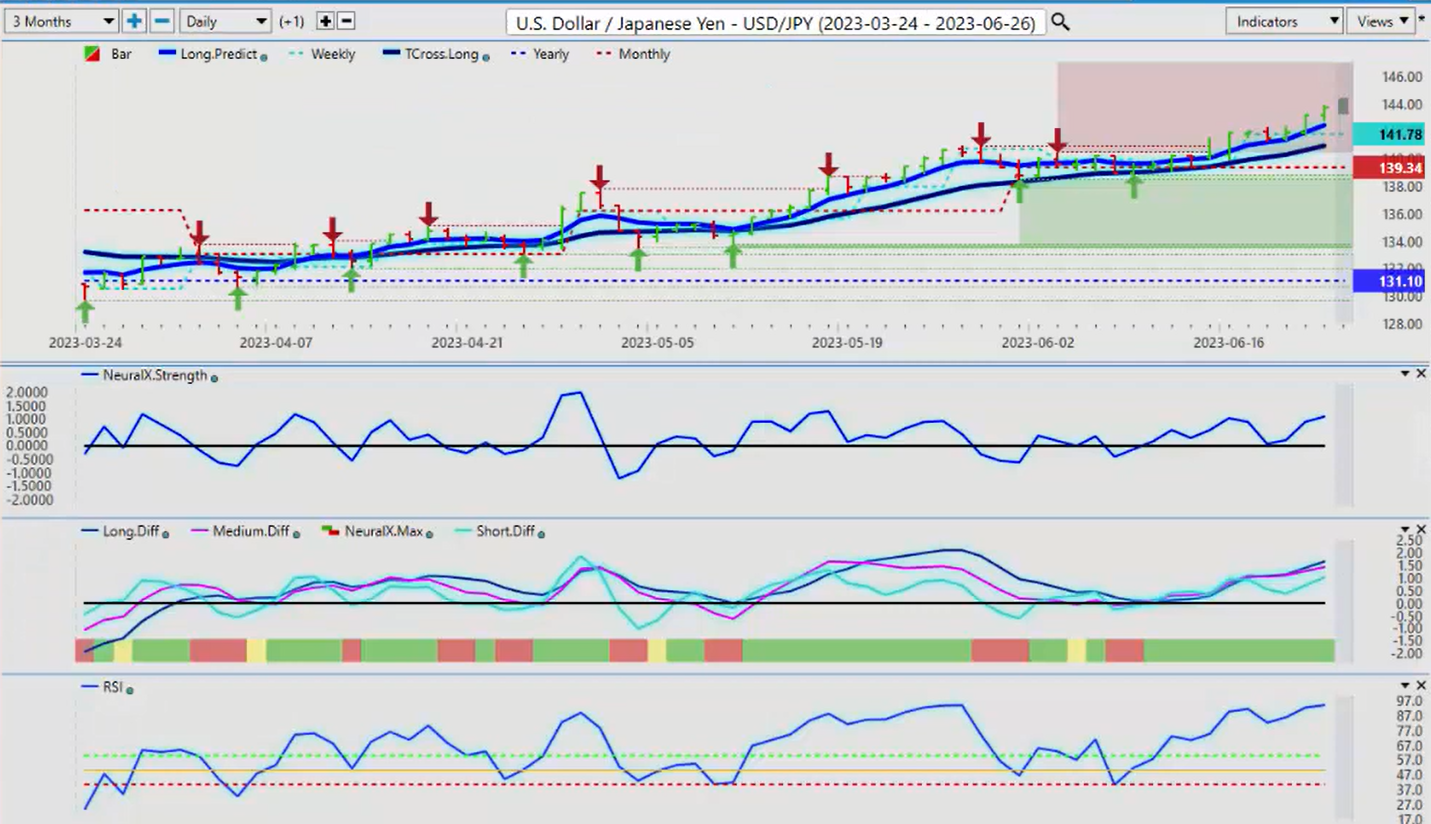
Now, the USD/JPY is really, really taking a hit here. Obviously with the carry trade, which is not overly surprising, but just the same, it is really… It’s hard to believe that we’re back up here on this pair again. But we are, and again, you can see where this all started down along this TCross.Long and it just simply wasn’t able to push below it. I had sell orders sitting below the TCross.Long that I was desperately hoping would get filled, and they didn’t. So unfortunately, I’ve missed this one, but again, I anticipated that the Fed would get ultra dovish and now he’s flipped the script again. And now he’s hawkish again. So for now, I do feel that this is a dangerous long trade up here. But the carry trade is the carry trade. So the interest rate differential between the Bank of Japan and the FOMC, they’re light years apart. Which heavily, heavily favors the US dollar.
Now, a lot of things happening this weekend in Russia. We could turn into a real risk-off scenario here, and that would help the yen. So I’m not sure how the market is going to respond to what went on in Moscow this weekend, but I would monitor that very, very closely. And because again, any risks off scenario, this thing turns. But the indicators right now are saying not yet. So we’ll monitor it. But the further we move away from 140.93, the VantagePoint TCross.Long, the more likely it is we’re going to retrace to it.
U.S. Dollar versus Canadian Dollar
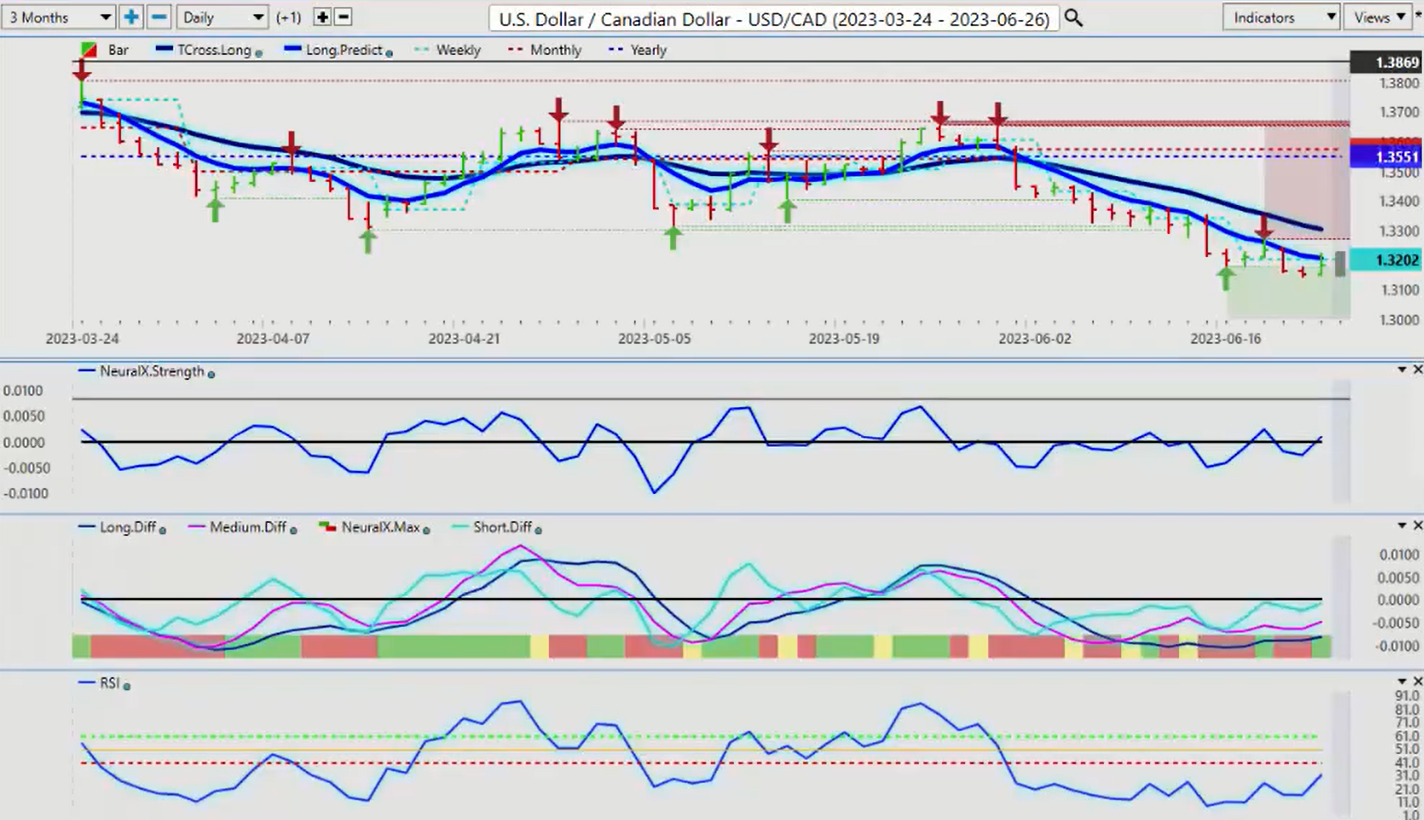
Now, when we come into our main equity/commodity based pairs, again, I think the market or the Bank of Canada has got it dead wrong on hiking rates this month. They were basing it off lagging unemployment numbers. The Canadian unemployment numbers came out. They were terrible. That was two days after they hiked.
So again, you’ve got some pretty heavy support building down here I would argue. Down around this 1.3138 area. And this is exactly what we’re looking for. The neural index strength is just poking above the zero line. The predicted differences have been running flat, and now they’re starting to turn up. The predicted RSI is recovering. So the first level of where the sellers and buyers are going to be battling it out is at the Long.Predict, 1.3205, then 1.3304. I can say with a degree of certainty that it’s extremely likely we are going to test 1.3304 early in the week, probably by Wednesday or Thursday, maybe even by Monday if equities and oil tank, the Canadian dollar will not stand a chance against those intermarket correlations. So on top of that, our weekly opening price is going to be set very low down here at this low, around 1.3143.
So if we’re not holding below 1.3143 by midday Tuesday, then the long trade is the side to be on here, guys. Just keep a close eye on stocks and keep a close eye on oil prices.
Australian Dollar versus U.S. Dollar
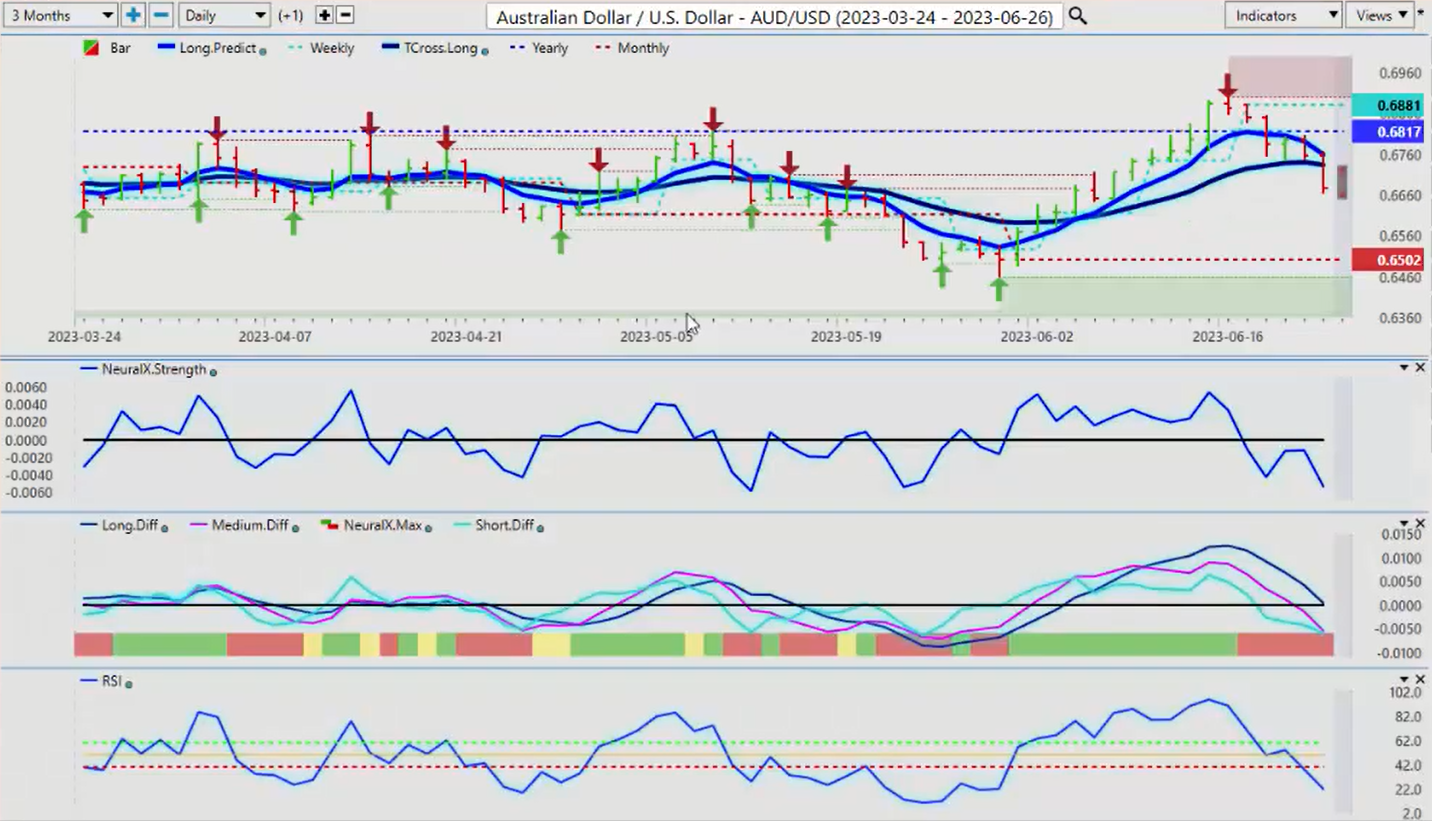
The same thing is going to apply for the AUD/USD. Now, you remember, in last week’s weekly outlook because again, this is an outlook, not a recap of something that already happened. We’re looking forward as to how we’re going to play this, week to week. So what I had discussed is that I’m going to use this as a barometer on the stock market. So yes, the neural index strength pointed us in the right direction. Then we flip over to intermarket correlations, and my argument was that if the AUD/USD cannot stay above the yearly opening price, then the S&P 500 is going down also. It’s a leading indicator.
So we can assess here very easily that basically we, on June the 20th, we slipped back below the yearly opening price. So again, if I do a very, very quick correlation here between these two, you can see that this is almost the exact same trade guys. So if for some reason the Aussie turns back up and retakes the yearly opening price, then the simple play is you would immediately buy the S&P 500 or the NASDAQ. I think the NASDAQ is the best place because of Bitcoin and some of the other cryptos. But again, if we stay below this, that’s a pretty strong break below that yearly opening price. But this is what you have to be careful of, guys, and I warned everybody of a bull trap last week. Because I see it a lot around this yearly opening. So this paints a very unique picture, not just against the Aussie, but against the US dollar, against oil, against gold, against the USD/CAD pair.
New Zealand Dollar versus U.S. Dollar
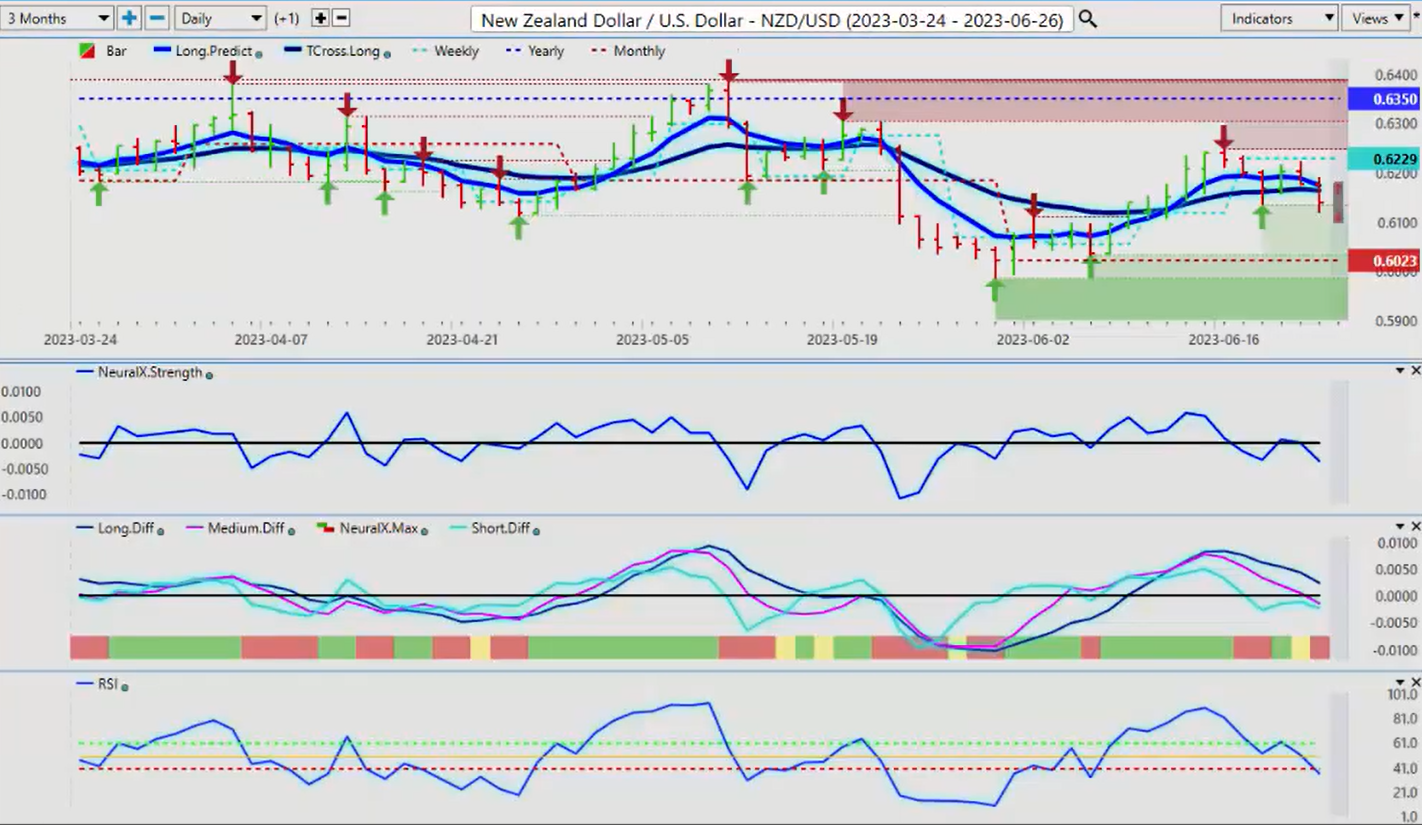
And the Kiwi is the same thing. The Aussie, the CAD, and the New Zealand often move together. So if the USD/CAD starts going up, then these pairs are going down. The indicators here are basically saying New Zealand is going lower. We’ve got momentum building here, predicted differences are dropping. So we have a lot to look at next week. But again, know your levels, know your inner market correlations, and again, you will be able to join the winning side of these markets. So with that said, this is the VantagePoint AI Market Outlook for the week of June the 26th, 2023.