-
View Larger Image
Welcome to the Artificial Intelligence Outlook for Forex trading.
VIDEO TRANSCRIPT
Hello everyone, and welcome back. My name is Greg Firman, and this is the VantagePoint AI Market Outlook for the week of June the 19th, 2023.
SPDR SPY ETF ($SPY)
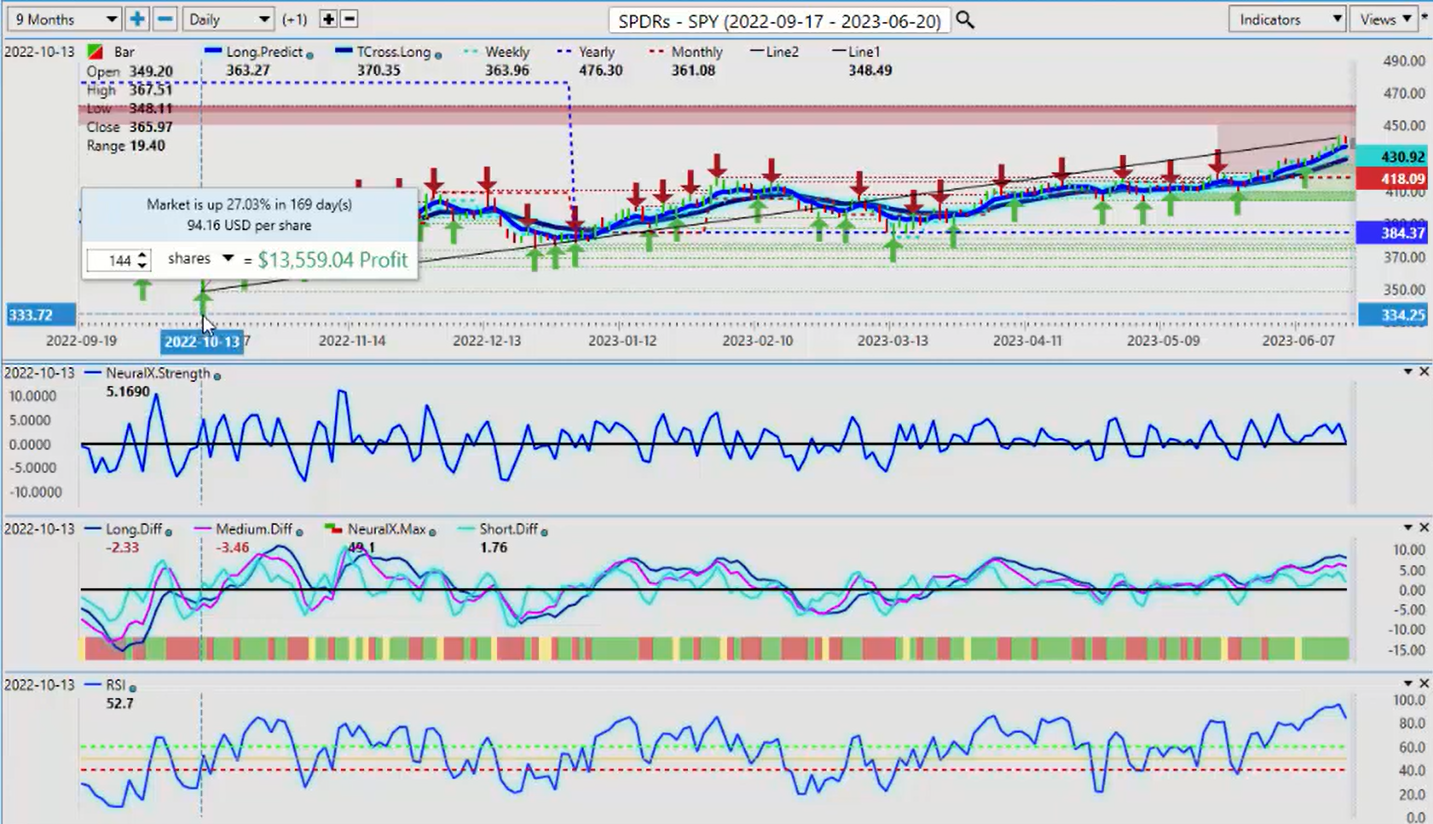
Now, to get started this week, we’ll look at the broader markets, first of all, looking at the SPY’ss, see where the equity markets are going. Now, the bulk of these gains, as we can see, the s&p 500, the SPYs bottomed out at or around October the 13th, 2022, and then we’ve seen about a 27% rise. So we can see the bulk of these gains are coming from actually in October, 2022. Now, if we look at it going into the calendar year 2023, we’ve also done quite well there for the most part. But when we can see where we’ve ended up on Friday after a relatively busy week, we can assess here, in 2023, we’re up about 14%.
So again, the bulk of those gains, we can identify where they’re coming from, but it’s very important to use accurate anchor points in your analysis, not rolling performance, because it’s often a lagging indicator that basically tells us something that happened a considerable period ago. If we look at 2022 with the fed rate hikes, unprecedented rate hikes, which of course we’re not getting in 2023, somewhat confused fed. But when we look at this right now, we can see that the indicators and vantage point on the spies are starting to roll back down. We’re we’re not showing a lot of momentum in here. So once again, getting that accurate anchor point in our delivery is very important. So our TCrossLong coming in at 429.32, but our yearly opening price 384, still in a strong uptrend 418. That’s the level we want to watch with the TCrossLong. That’s where the bulk of our supports are coming.
S&P 500 Index
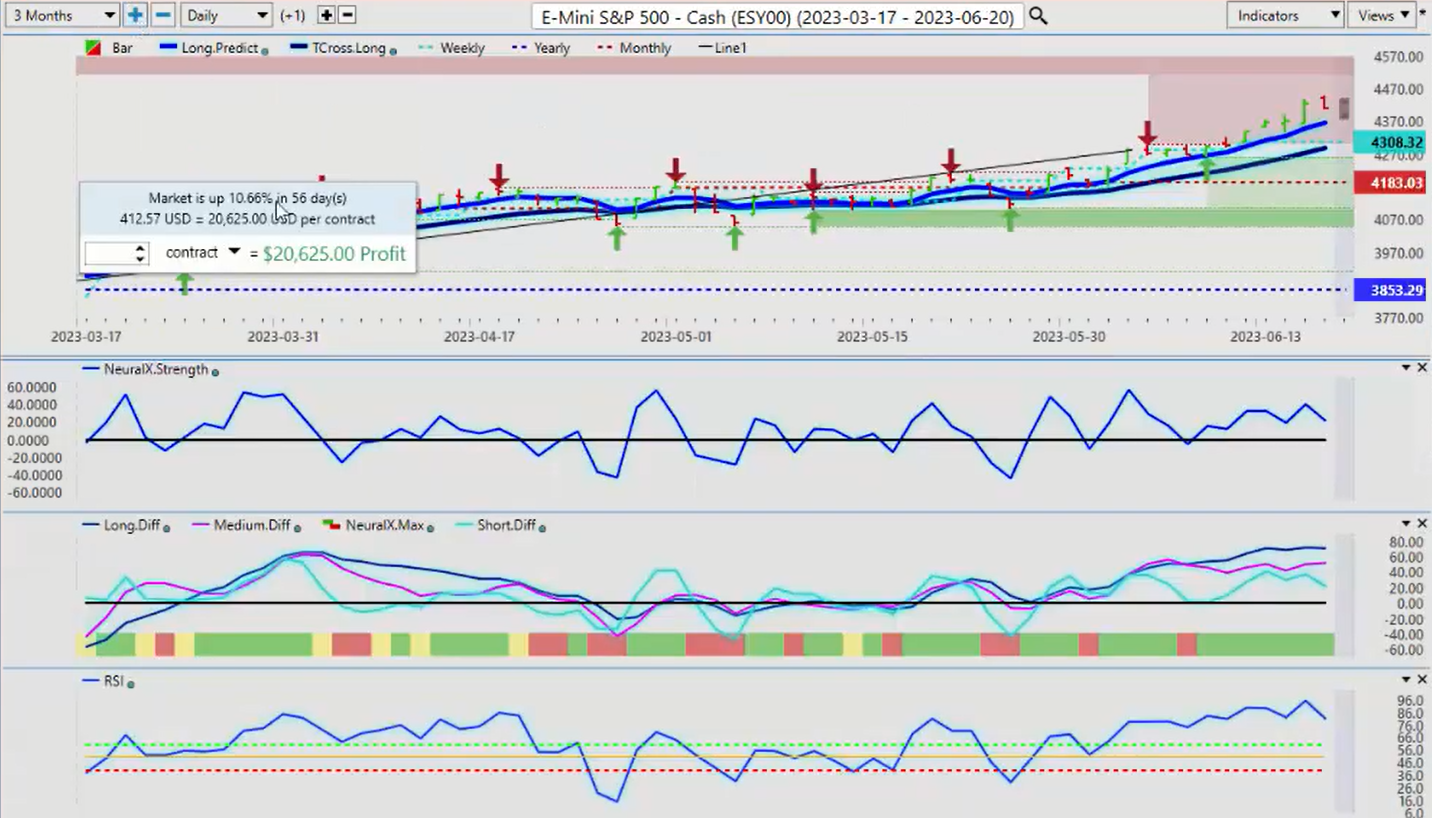
Now, again, when we cross-reference the SPY’s to the s&p 500, we can basically see something very, very similar here. But again, we’ve had a larger move. But if we come back to get an accurate look at where this activity has come from, we can see it’s on the exact same date on the s&p. So when we measure that point, going back from October, then we get a very strong idea of where the bulk of these gains have really come from. So again, when I look at the s&p 500, 27 point, approximately 27% were up from that October low. But again, when we look at these numbers, it’s important to have that accurate anchor point, because at the same time, we bottomed out on the spies and the s&p 500, the dollar was topping out. So again, when we cross-referenced the dollar index to this, we can see the exact same thing. As we get into this October, November area.
U.S. Dollar Index
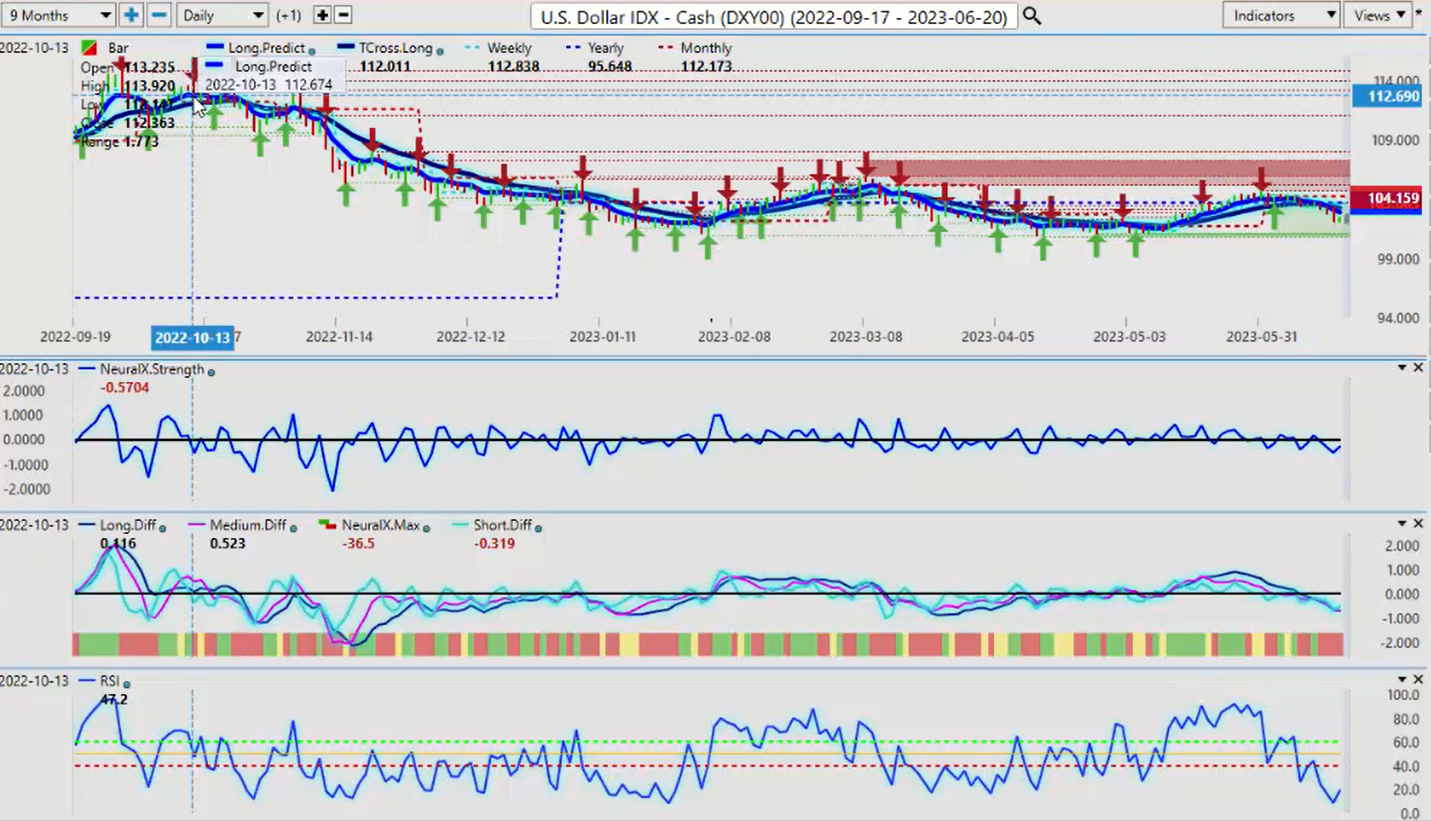
Then largely, the dollar index had stopped making any gains. So that direct intermarket correl inverse, intermarket correlation is very, very important to understand when they’re buying dollars. We haven’t actually made a new high in the dollars since October. We’ve had some retracement points. But again, right now, if we look at next week for the dollar trading, we’re basically running in a channel. So if we look at this particular channel, we can identify that so we know where our breakout points are. So right now, if I take this from a approximately a six month period, we can see the lower end of this channel would be our initial target here, the low point of 101.03. But remember guys, this is not a trending move up or down. We’ve been channeling like this all year. You can see that back in February, during a period of known dollar strength, that seasonality, we’ve bought them out there, coming in about 100.82.
So 100.82 is approximately our lowest point of the year, or the bottom end of this particular channel. The top end of this channel, that’s coming in at the high of about 105.88. You remember back in March of this year where I had warned about continuing to buy dollars up here, because the main strength in the dollar was coming from that seasonal. And even though most of your pundits were saying to sell equities in March, we were actually buying the equities back then because we are not looking at that rolling performance methodology. We’re looking at the actual anchor point from October the 13th, warning us that buying dollars up here would be very dangerous. So for next week, we would use the lower end of this channel as a potential target, down around between 100.82 and 101.02 is our support levels down here. We would need a sustained break of that level to trigger a trend, a larger trending move.
But for now, guys, we remain locked in this channel. The dollar, again, much is what we had discussed again just a few weeks ago with this dollar cycle. The dollar is strong at the beginning of the month. So we would look for the dollar to likely turn back up at the beginning of July. So a little bit more downside, and we would look to hold inside this particular channel.
Gold
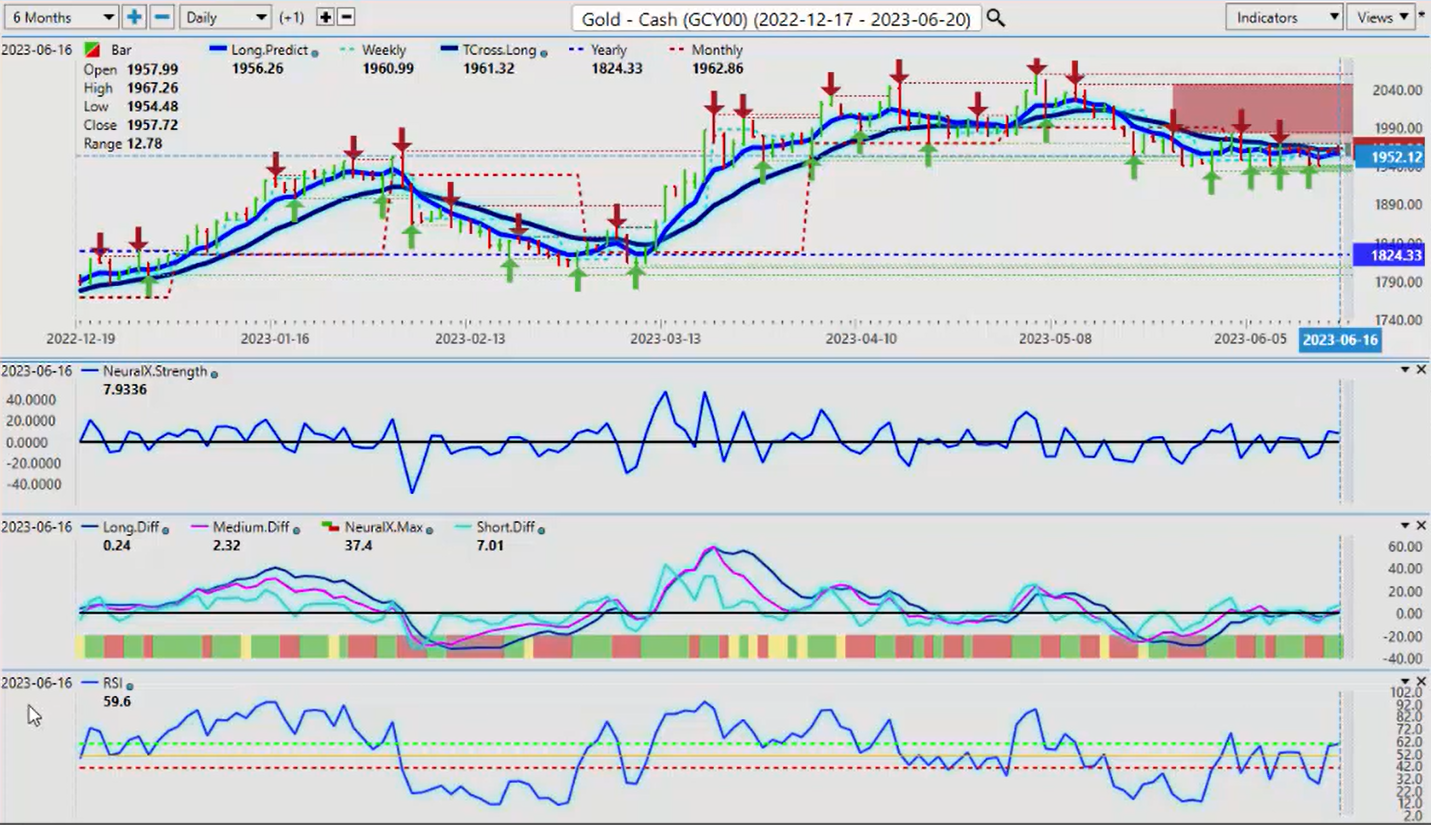
Now, if we look at gold contracts here, gold starting to show a little bit momentum to the upside, but not a lot here. We’re looking for that pre predicted RSI 59.6 to break above 60, our predicted differences, to start moving up so we can build some momentum here. Now, we should see some gold strength between now and the first week of July, but remember, we’ve got that period, the last period of the summer, of known dollar strength, usually at the end of June or the end of week of July.
So keep an eye on that. But our TCrossLong, 1961. We need a break of that level if we can start moving higher, which is the likely outcome going into next week, depending if we get any more rhetoric coming out of the fed.
Light Sweet Crude Oil
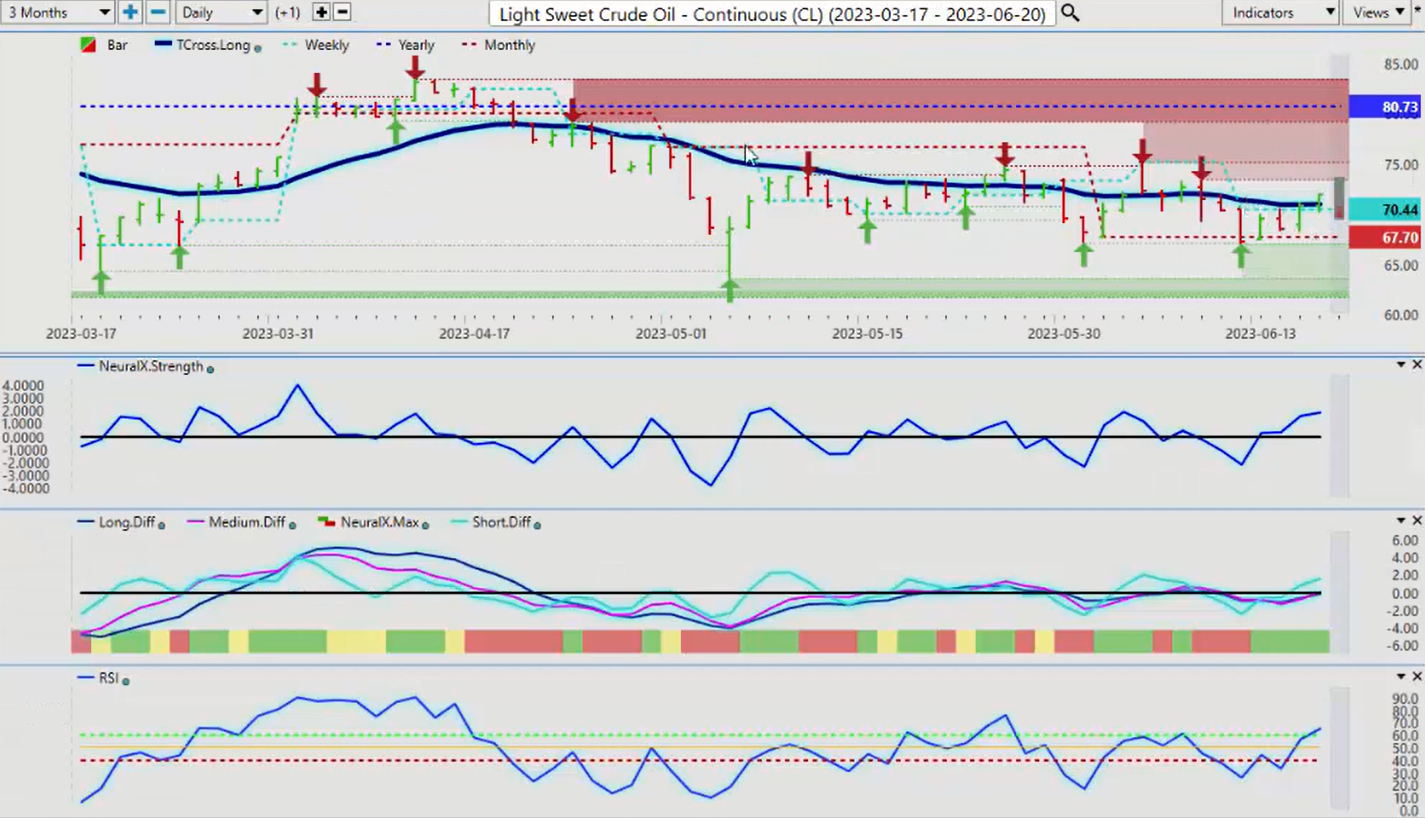
Now, when we look at light sweet crude oil, once again, we would be getting very, very close here, guys, to the end of the seasonal pattern in oil. Usually, that’s around about the first, second week of July. So probably a little bit more upside on oil, but after that, we want to be very, very cautious with longs. We remain negative on the year with oil. 80.73 is our yearly opening price. But in the month of June, you can see we’re actually doing pretty good. The monthly opening price, 67.70, keep a very close eye on that. And for next week, our main support is our TCrossLong at 71.01. We’re closing the week 71.93.
We would look to hold above that level, but more specifically, we want to hold above that very important monthly opening price at 67.70. Now, when we look at Bitcoin, Bitcoin’s starting to make a bit of a move here. We work on this one in the VantagePoint live training room. One of the stocks that I really do like that VantagePoint’s now forecasting for is Hut 8 Mining, or Hut 8 Mining.to, the Canadian version of that stock. But it’s a blockchain stock currently running around $3 a share, but also having a fantastic year.
Bitcoin
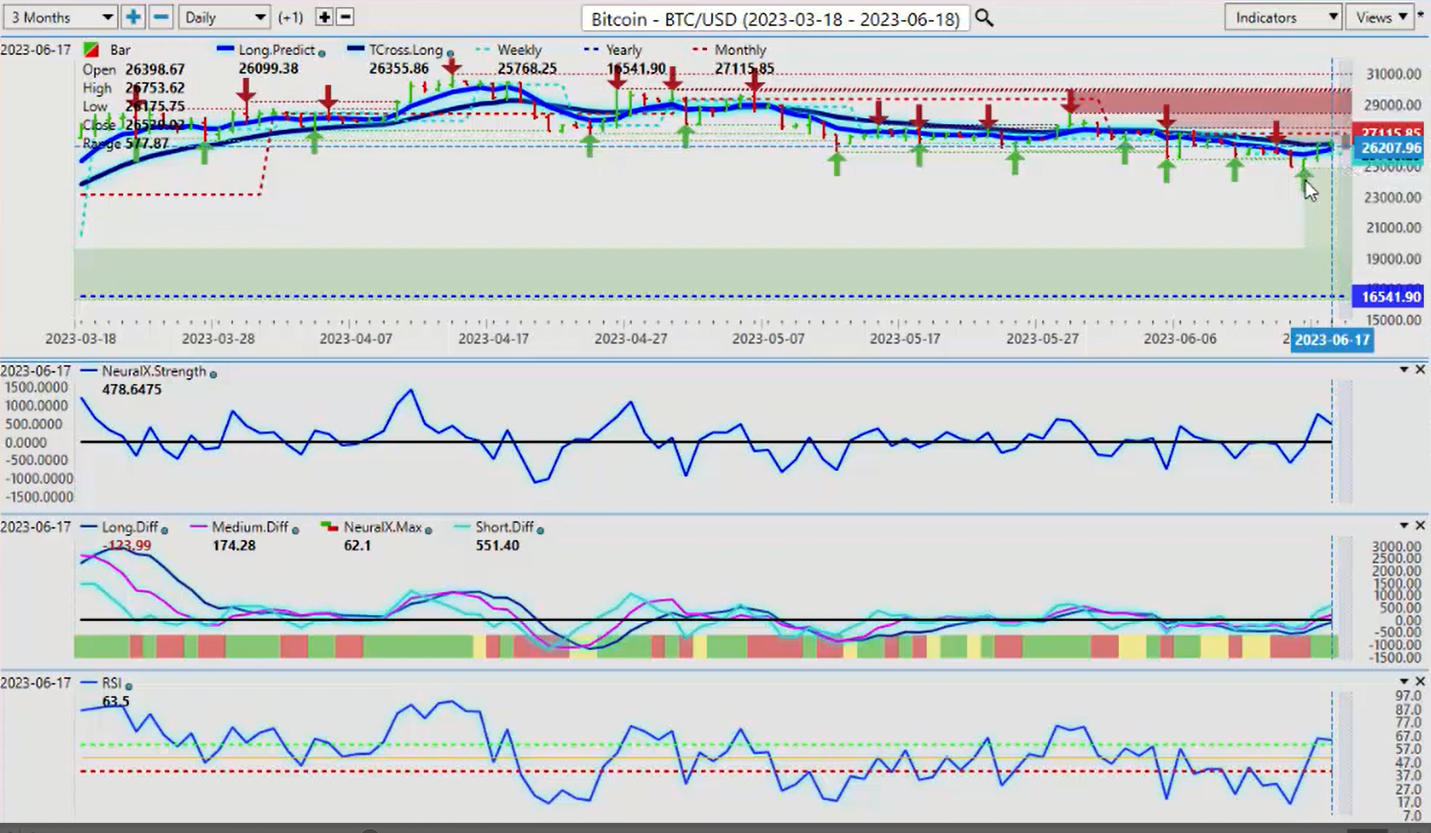
Now Bitcoin, the seasonal pattern in Bitcoin, in my respectful opinion, we’re about three to four weeks away for Bitcoin to start its move up from a seasonal standpoint. But right now, we remain bullish here. We’re pressuring the upside, but the monthly opening price 27,115, this is the level we need to start pushing above, but we remain firmly positive on the year.
Somewhat comical when we look at the commentary earlier in the year saying Bitcoin’s a scam. Don’t buy Bitcoin. I’ve never been in that camp guys. Bitcoin has done extremely well over the last 10 years. Yes, it had a terrible year last year, but I think what some of the pundits failed to mention is that whenever Bitcoin has been down 50% on the year, it’s then in turn rallied the next two or three years of 50 to 80%. So again, this year we’re already currently up about 58%. And again, the Hut 8 Mining stock is up even more than that. So once again, we look for that spinoff methodology of anything related to Bitcoin to rise when Bitcoin does. So right now, again, we’ll keep a very close eye on this, but we need to push… I would like to see this Bitcoin getting moving, but I think we still have a little bit more downside before we start moving towards that seasonal next month.
Euro versus U.S. Dollar
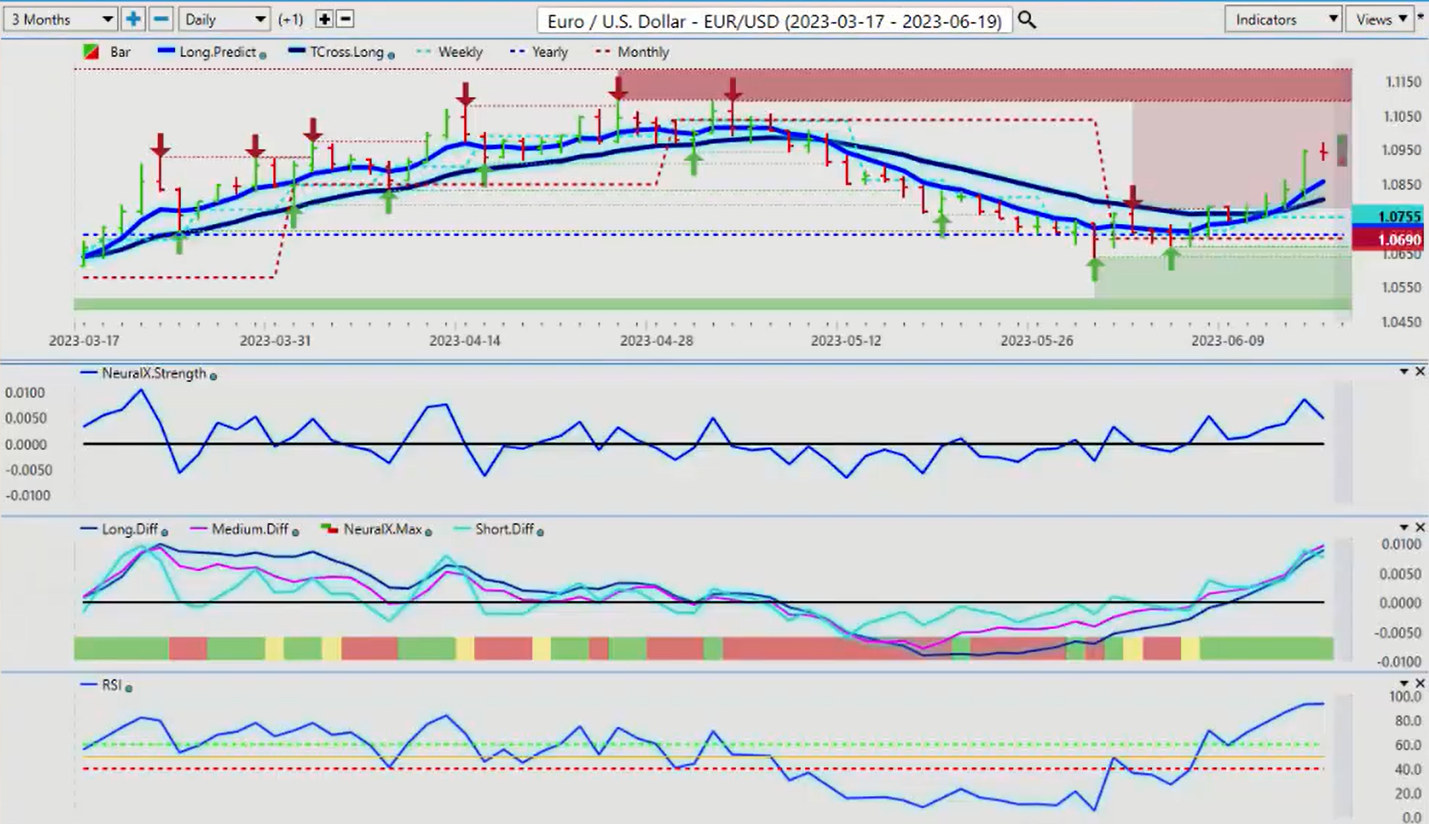
Now, as we come into some of our main forex payers for next week, Euro US is at the top of the list, rather a hawkish ECB. But I would argue that even though the Fed paused, he was somewhat of hawkish also. He’s making it very clear, higher for longer. They’re likely not done hiking yet. There’s more to come. So we’ll continue to watch this movie. But right now, I think the Euro, in my respectful opinion, somewhat overextended here. And the neural index strength, the slope of this is telling me we’re we’re starting to lose momentum here. The predicted differences, definitely they’re overextended, but they can still move higher. The predicted RSI, 93.6. So again, our next verified resistance level high, that’s coming in about 110.91. I think it’s inevitable that we likely get back up towards that level, but we also need to, again, remember, when we look at this from a six month standpoint, the Euro has fared well.
But again, whenever we make these a series of new highs, if we look at the high going back into February, then once we got near this, we did make new highs in the Euro, which is definitely bullish. But again, each time we’ve made these new highs, we’ve subsequently moved lower. So again, the Euro should hold most of its gains, at least until the end of the month. But the further we move away from the TCrossLong at 108.06, the more likely it is we’re going to retrace to it. So we want to watch these reversal indicators very, very closely to make sure we don’t get caught long here, because again, in my respectful opinion only, as confused as this fed is, I don’t think he’s done with the markets just yet.
U.S. Dollar versus Swiss Franc
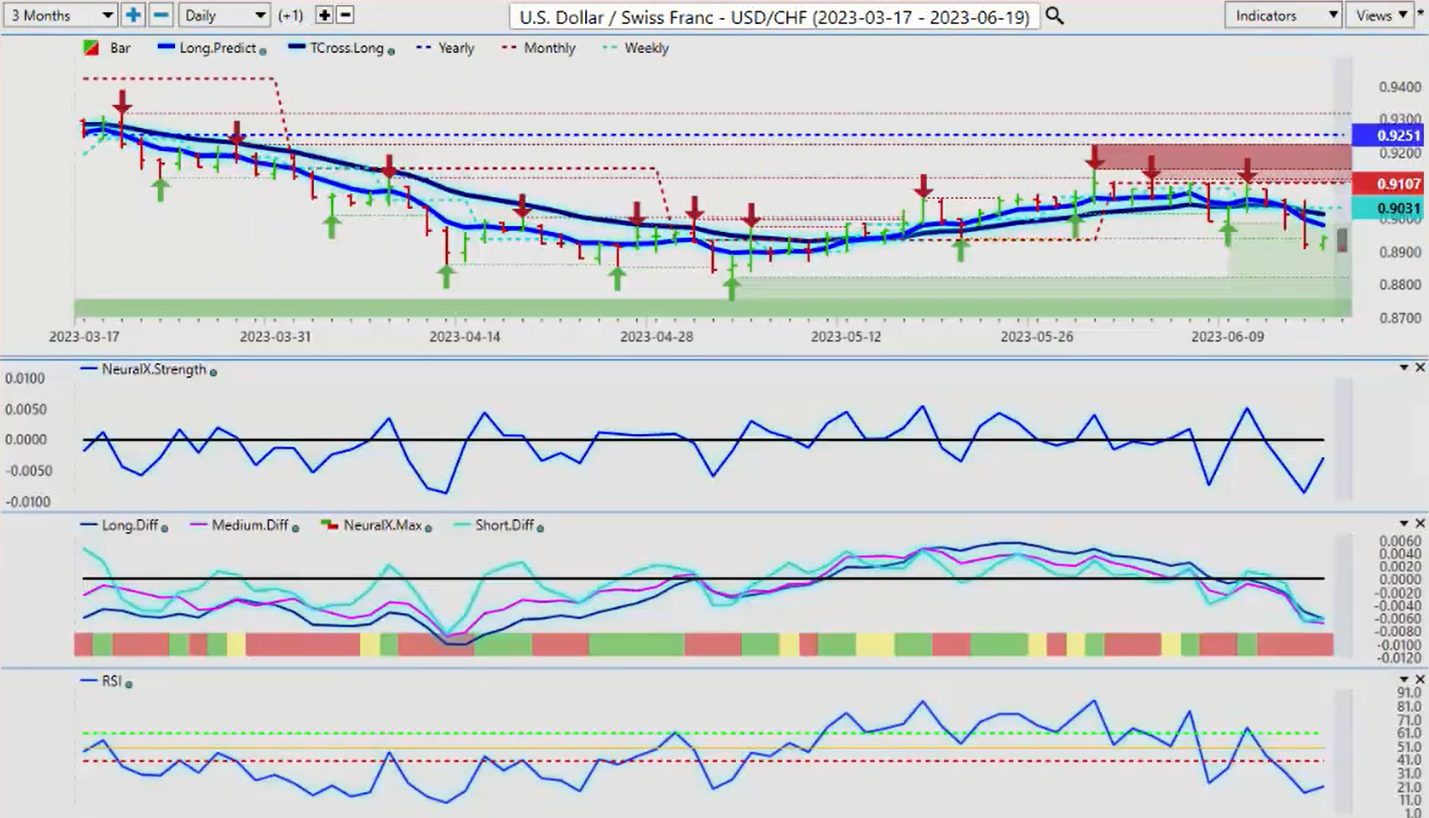
Now, the US Swiss Franc, we do have the Swiss National Bank rate announcement next week, so that’s likely going to be still bullish for the Swiss Franc week. This pair really does show the depreciation of the US dollar against this particular currency.
Right now, again, we remain pretty much locked in a very similar channel that we see with the other one, but this one’s far more pronounced, and the Swiss Franc also making gains against the Euro and a number of other currencies. So that flight to safety, it just seems that the Swiss Franc wins either way. Now, if they keep hiking and they hike this coming week, again, that we’ll see a further bullish Swiss Franc, but be careful because we could have some different rhetoric out here. We’ve got a reverse check mark. We’ve seen this before, and these that I’ve done and commented on this, in these weekly outlooks, that reverse check mark often points to a pending reversal coming.
And a reversal in this case is simply a retracement back to the TCrossLong. 90.12, that’s the area to watch for. I think we have further downside next week on this pair, as the dollar is not likely to get much relief anytime soon.
British Pound versus U.S. Dollar
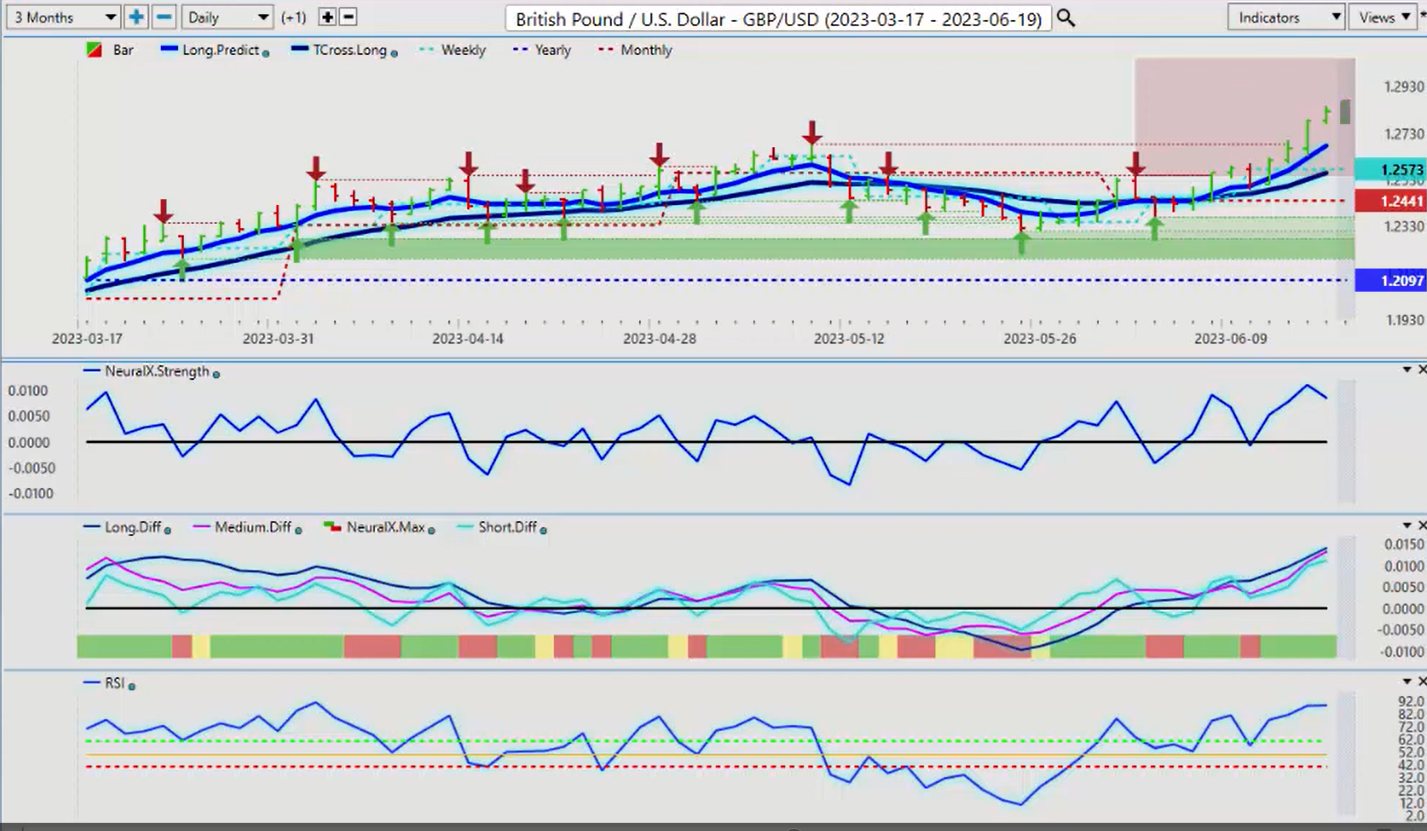
Now for the British pound, the British pound, we also, I believe, have the Bank of England next week, but I will warn everybody too, you’ve got a holiday in the US on Mondays, so we really don’t want to be looking at the markets on Monday, and we want to shift that focused over to Tuesday and Wednesday. This is where we’ll see real volume coming back into the market, and then we’ll recheck our indicators after the update on Monday and Tuesday night. And then on Wednesday, we’ll start to get into a true price. So be patient this coming week. And always remember, in a holiday short week, you’re going to see volatility.
But right now, the British pound, US dollar, grossly, in my opinion, overextended from the VantagePoint, long predicted at 126.27, the TCrossLong at 125.59. So we want to watch our reversal indicators for that corrective move lower. I don’t think we’re going to see a new trend of the downside. The British pound has been bullish the bulk of the year, 120.97. We hold above that. When we look at this from a six month perspective, you can see we had some volatility at the early part, but the pound’s been doing quite well since March here. Even though the dollar is done fairly well at points, the British pound has outperformed it. And the British pound, I will point out, has been positive for the bulk of the calendar year where the US dollar index has predominantly been negative for the better part of the year.
U.S. Dollar versus Japanese Yen
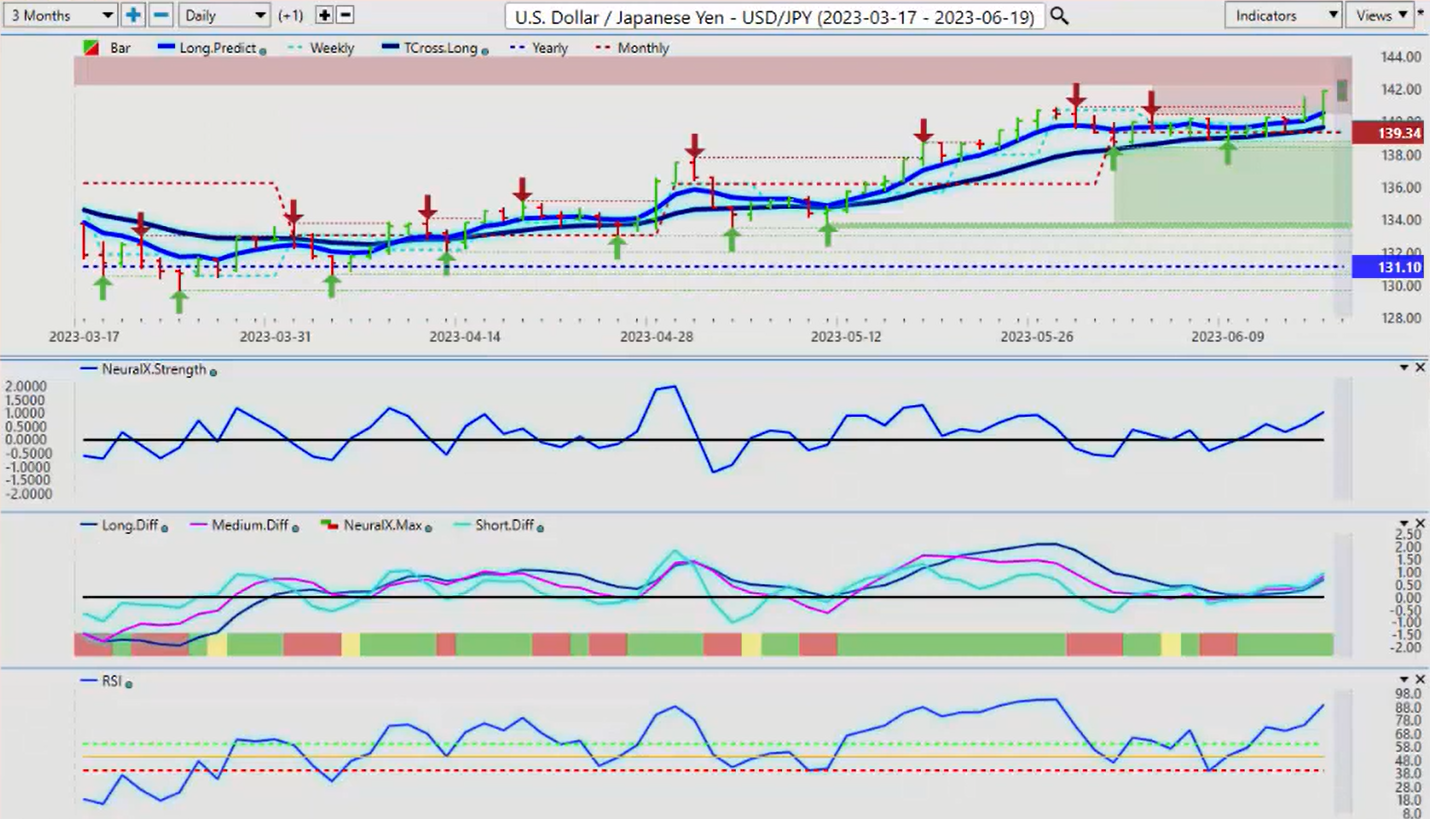
Now, the interest rate differentials continue to favor the carry trade. I’m shocked again to hear that the yen is back up at these levels. But you can see this past week, the market uses the VantagePoint TCrossLong. I personally use it as a pivot point and say, okay, the TCrossLong at this particular case is 139.29. A long while above that, I break down below this, then I’m going to retrace deeper. But you can see the market pressured the vantage point predicted moving average and was unsuccessful breaking through. Ultimately, it used the TCrossLong on Friday as a springboard to extend higher. But again, in my respectful opinion only, any type of risk off scenario would favor the yen, even with the interest rates here. But for now, I would caution everybody is the easiest way for me to say it, that we need to stay above 140.93, this newly formed verified resistance high if this is going to extend higher.
But either way, I believe that we have limited upside here unless the Fed comes in. But the indicators, accurately from VantagePoint, you can see that we were unable to break down below the T cross long. Were unable to break down below the 40 level on the predicted RSI, which ultimately led to a rebound and moving back up, even though it could be disputed whether that was a hawkish or a dovish fed. But I would still lean towards the hawkish side personally, because again, I don’t see that that labor report, it was the best. Some of the inflation’s coming down, but still not enough. But again, we’ll watch these levels very, very closely.
U.S. Dollar versus Canadian Dollar
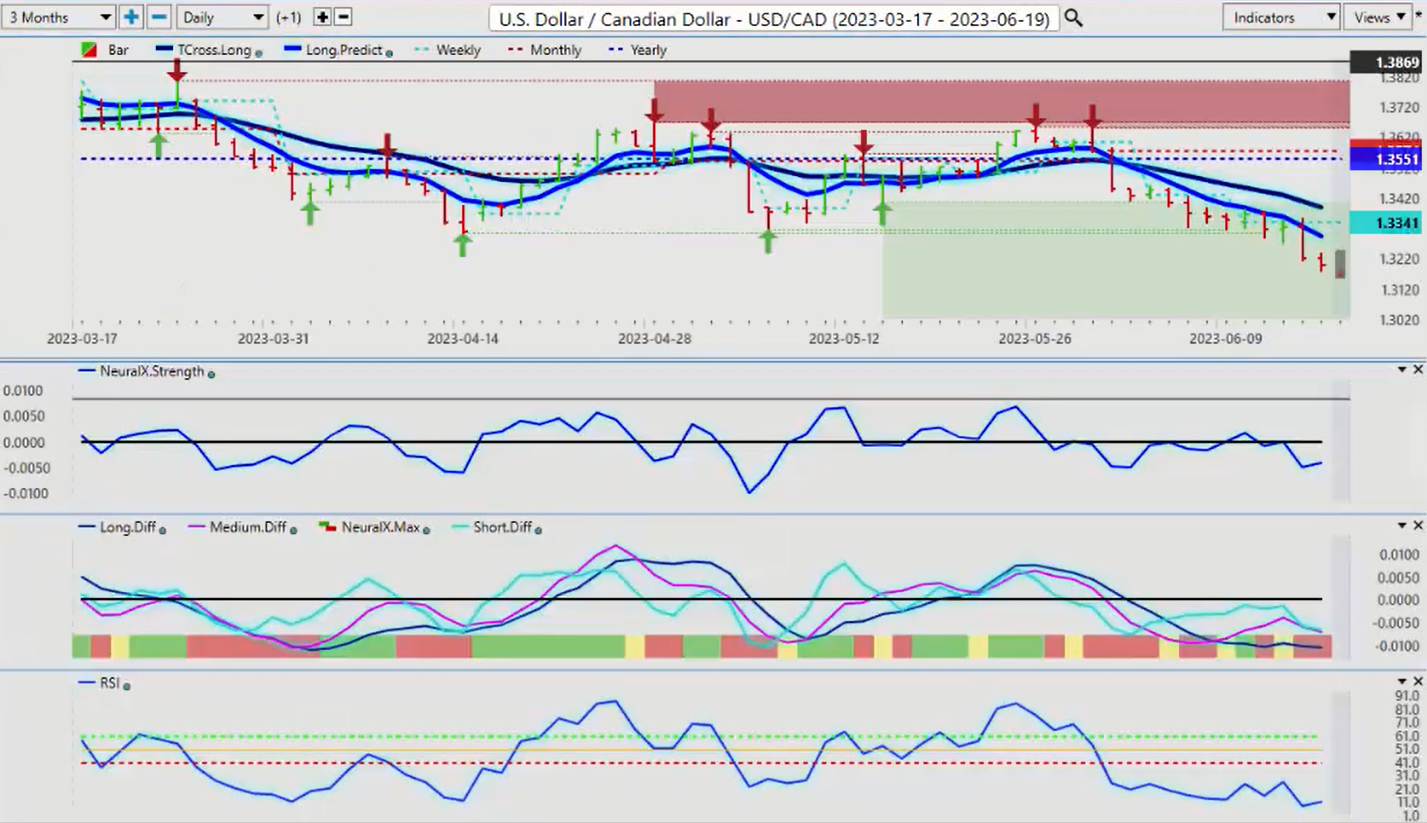
Now, as that seasonality in oils continues to support oil, it also indirectly supports the Canadian dollar. With that surprise rate hike coming from the Bank of Canada, which again, in my respectful opinion only, was a huge mistake.
The Canadian unemployment numbers came out after they hiked and they were terrible. So again, this is the problem with a lot of these central banks using lagging and indicators to make these hikes. But for now, we’ve extended a little too far away from the vantage point predicted moving average. This is not Fibonacci based. It’s a predicted moving average based on the correlation, to 31 other markets actually. So 133.89, that’s a significant line in the sand. We are bearish now on the month and the year, the monthly at 135.74, the weekly opening even last week, 133.41. But again, that monthly is very important. And our TCrossLong, that’s our immediate area. But we also have the long predicted, this shorter term predicted moving average that we also use it as a pivot point as on a weekly basis. So 132.95, I can say to a degree of about 80%, that we will at least hit that level in the next several days, by Wednesday.
So maybe a countertrend long there. We do have our crosses taken place, but we’re nearing the end of that seasonality and oil, and that should also hurt the Canadian dollar. And I think the media will start talking more about whether the Bank of Canada should have actually hiked last week or not, the week before, because highly questionable why they did that. Because again, I don’t think they’re using current data to support that. But again, could be wrong, we shall see. But for now, watch those two retracement points.
Australian Dollar versus U.S. Dollar
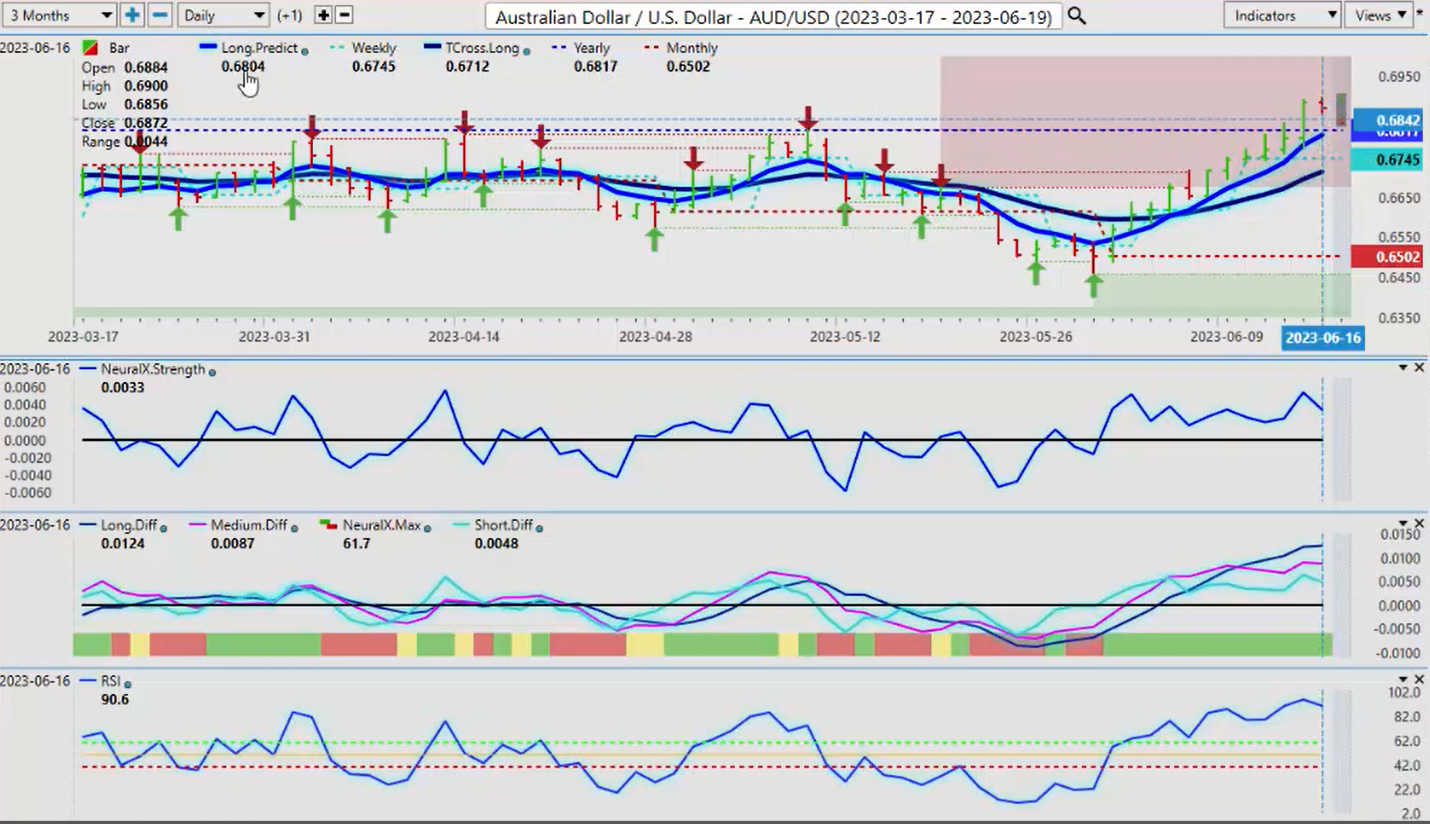
Now, the Aussie has had a good run up. Now, this is an interesting one going into next week, so we’re going to give you guys a little bit of help here, is that the yearly opening price, 68.17. This is a critical level. That is now going to intersect with the VantagePoint long predicted at 68.04. So all of our support is sitting right there. So again, this is an outlook, not a recap of something that already happened. We’re talking about next week’s trading and key support and resistance levels to watch for and how the market responds to them.
So this is a very big level. If the stocks start to turn lower, mainly the s&p 500, the nasdaq, et cetera, if they turn lower and we’ve topped out on them, then the Aussie will not hold this level. The direct positive correlation between stocks and the Aussie, the CAD, and the New Zealand is very, very high. So watch this level very cautiously, long while above that level. And if we not holding above this particular level, then shorts will work very, very quickly. I think either way, again, the long predicted 68.04, we come down to this level either way, like what I just showed you with US, Canada.
New Zealand versus U.S. Dollar
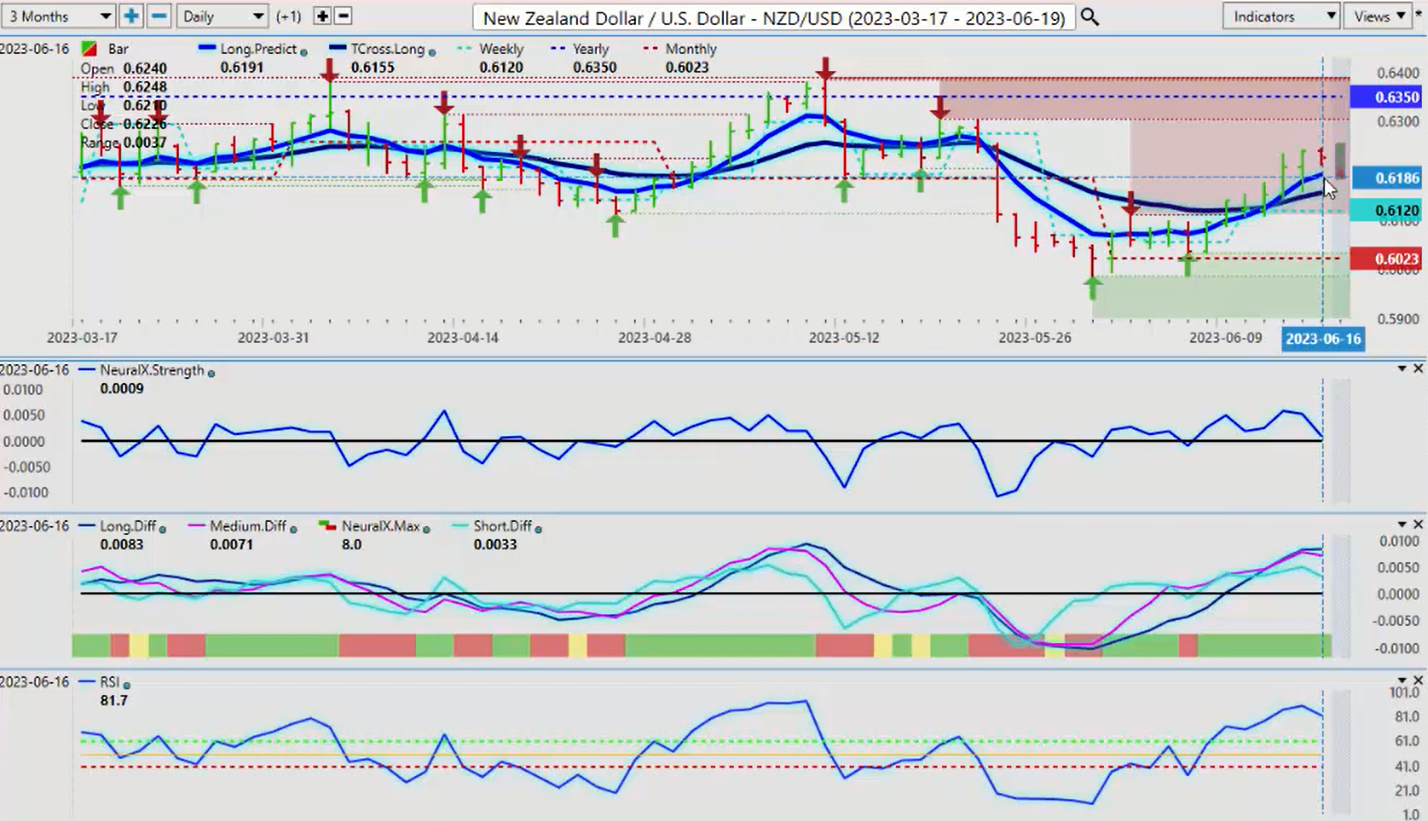
New Zealand will fall into the same boat. It’s going to make a push to the upside and what we want to look for, but you can see the difference between the Aussie. And the New Zealand.
And I was asked this question last week, this is your culprit here that also dictates whether you want to buy the Aussie US or New Zealand US. Aussie New Zealand, this is where Aussie is getting a lot of its strength for, where it’s beating up against its counterparts. So in order for people to buy Australia, New Zealand, they have to buy Aussie US, while at the same time, selling New Zealand US. So you can see this pair helps us determine which pair to go after. Now, Aussie New Zealand is getting very, very toppy up here and there’s not a lot of buyers. So if this starts moving lower, you could see the scenario between Aussie US and New Zealand US reverse, and you could see them start to sell Aussie US and buy New Zealand US. So watch for that. But indisputably, the difference between these two currencies, the Aussie is the stronger.
Now, if the dollar continues to fall against most currencies, then this pair would be a place of value to sell dollars by buying it against the Kiwi. Now, when I look at this right now, the indicators from VantagePoint are cautiously warning of yet another reversal back to the downside on this pair. So be very, very cautious as we go into a holiday short week. So with that said, this is the VantagePoint AI Market Outlook for the week of June the 19th, 2023.